SUPER SWEET CORN BREEDING BY BACKCROSS: A NEW CHOICE FOR THE BRAZILIAN MARKET
Geovana Cremonini Entringer1, Julio Cesar Fiorio Vettorazzi1, Jocarla Ambrozim Crevelari1, Nayara Norrene Lacerda Durães1, Renato Santa Catarina1 and Messias Gonzaga Pereira1
1Laboratório de Genética e Melhoramento de Plantas - Universidade Estadual do Norte Fluminense Darcy Ribeiro. Campos dos
Goytacazes, RJ- Brasil. E-mail: geovanaentringer@gmail.com
ABSTRACT
The sweet corn market has been expanding in recent years and the trend is to maintain this growth, aiming mainly the export market. The goal of this research was to evaluate the agronomic performance per se and in hybrid backcrosses of four sweet corn populations and to estimate genetic parameters inherent these populations, in order to achieve promising lines to obtain hybrids. The following genotypes were used for this test: the donor population of sh2 gene, two recurring
populations, interpopulation hybrids of common maize, four sweet corn populations, and four sweet corn interpopulation hybrids. The backcross method was efficient for obtaining populations with good agronomic performance. Because the sweet corn interpopulation hybrid presents agronomic performance similar to P8 x C8 interpopulation hybrid, it can be inferred that all sweet corn populations backcrossed are recommended for use in obtaining lines, in order to obtain productive hybrids, or even directly as varied trade after further assessments.
Keywords: Shrunken-2, hybrids, especially corn
MELHORAMENTO DE MILHO SUPERDOCE VIA RETROCRUZAMENTOS: UMA NOVA ESCOLHA PARA O MERCADO BRASILEIRO
RESUMO
O mercado do milho doce vem expandido nos últimos anos e a tendência é a manutenção deste crescimento visando, principalmente, o mercado para exportação. O objetivo desta pesquisa foi avaliar o desempenho agronômico per se e em combinações híbridas de quatro populações retrocruzadas de milho superdoce, e estimar os parâmetros genéticos inerentes a estas populações, a fim de extrair linhagens para a obtenção de híbridos. Para isso, foram utilizados os seguintes genótipos: a população doadora do gene sh2, as duas populações recorrentes, híbridos
interpopulacionais de milho superdoce. É evidente a eficácia do método em obtenção de populações com bom desempenho agronômico. Os híbridos interpopulacionais de milho superdoce apresentarem desempenho agronômico semelhante ao híbrido interpopulacional P8xC8, pode-se inferir, que todas as populações retrocruzadas são recomendadas para obtenção de linhagens, visando à obtenção de híbridos, ou até mesmo diretamente como variedades comerciais.
Palavras-chave: Shrunken-2, híbridos, milho especial
INTRODUCTION
Sweet corn, white corn and popcorn are among types of specialty corn. Sweet corn is considered a vegetable because it is an herbaceous plant and it used as food in its natural form. This vegetable has genes that limit starch biosynthesis, which causes accumulation of soluble polysaccharides in the endosperm and sweet character causes changes in texture and seed viability (TEIXEIRA et al., 2013).
Until the nineties, aspects such as the low seeds availability, low market supply, and the lack of knowledge among consumers meant the interest of farmers in sweet corn was small, (GAMMA et al., 1992) but this set has been modified, mainly due to substantial subsidies for sweet corn breeding (ASSUNÇÃO et al., 2009; BORDALLO et al., 2005;ENTRINGER et al., 2014; TRACY, 2001) In recent years, the market has shown a growing and broad potential (ABRASEM, 2011), and the yield in 2013 allowed an increase in overall exports of 2.2% in volume and 4.7% in value, reaching 265 tons and US$ 234 million respectively. Some cultures have registered some increase. For example, sweet corn, which climbed to third place in the ranking with 23%, increased in exports (REETZ et al., 2014).
In contrast, the narrow genetic base of sweet corn is a concern because it may prevent the progress of breeding programs in the near future (BRAZIL, 2014; TEXEIRA et al., 2013). Thus, in order to broaden the genetic variability and release new higher yield varieties in the market, the conversion of common corn genotypes in sweet corn genotypes by successive backcross is an excellent strategy. In Brazil there are excellent programs breeding common corn, and commercial cultivars with high agronomic performance.
However, to preserve the explored genetic diversity in the breeding program, it is necessary to preserve that the genetic diversity among the "new backcrossed populations" in order to
maximize heterosis effects. There is no definition of what parents are indicated as gene pools for sweet corn (TEIXEIRA et al., 2013). Perhaps one way to ensure heterosis between sweet corn genotypes would be the introgression of genes responsible for the phenotype of sweet in different heterotic groups of common corn already known such as, dent and flint.
Given the above information, this study aims at: evaluating the agronomic performance per se and hybrid combinations of four backcrossed populations of super sweet corn and estimating genetic parameters in these populations, in order to extract promising strains for obtaining hybrids.
MATERIAL AND METHODS
The super sweet corn synthetic populations SH2 (SDS) and the super sweet corn synthetic SH28HS (SD8HS) were used as donor parents of shrunken-2 gene (sh2). These populations came
from the National Center for Research on Corn and Sorghum (EMBRAPA) and they were selected for this purpose due their satisfactory performance per se. The CIMMYT-8 and 8-Piranão populations, which came from the eighth cycle of interpopulation recurrent selection developed at the State University Darcy Ribeiro (UENF), were used as recurrent parents. These populations have provided to the region North / Northwest of Rio de Janeiro one hybrid named 'UENF 506-8'. This hybrid has been used by farmers since 2000. It has excellent agronomic response compared to other genetic materials and good acceptance by the farmers.
Thus, in order to release super sweet corn genotypes, the SDSH SD8HS varieties were crossed with common maize varieties C8 and P8, achieving four populations of super sweet corn. Later, these four hybrids were backcrossed for five generations to recover the recurrent parent into the genome in conjunction with the super sweet trait.
The backcross process is explained as follows: for each cross, a population was backcrossed with its recurrent parent giving rise to the first backcross (BC1F1) generation. For each population, approximately three hundred plants of each BC1F1 population were grown in the field for classification. Primarily, the plants were analyzed for height, in other words, only brachytic plants (br2br2) were selected for further self-pollinating and harvested to assess grain texture. After
harvesting, they were analyzed and those with wrinkled seed (sh2sh2) were sown in the field and
subsequently used to obtain the RC2F1 progenies. From this generation, all the plants obtained in RC2F1 homozygous recessive for the plant height characteristic. Therefore, the selection was based
on the following generations only for seed texture characteristics, and only wrinkled seeds were selected. This process was repeated for five generations, in other words, approximately 98% recurrent parent’s genome was recovered with the super sweet characteristic. After five generations of backcrossing, four populations of super sweet corn were obtained, namely: PSH, CSH, P8HS and C8HS. Each one was crossed with the others to generate the following intervarietal hybrids: PSH x CSH; PSH x C8HS; P8HS x C8HS and P8HS x CSH. For the competition assay, the following 13 genotypes were used: SDSH, SD8HS, P8, C8, P8xC8, CSH, C8HS, PSH, P8HS, CSH x PSH, CSH x P8HS, C8HS x PSH and C8HS x P8HS.
The experiment was established in an experimental design of randomized blocks, with five replications and two locations: Agricultural College Anthony Sarlo and State Center for Research in Agro-Energy and Waste Utilization, both in the Campos dos Goytacazes North of the State of Rio de Janeiro. Each plot consisted of two rows of 5m, with 0.3m spacing between plants and between rows of 1m, and four continuous lines were around the planting area.
Many characteristics were evaluated, including the following: height of 6 competitive plants measured in meters (HP), plant stand (ST), number of ears (NE), prolificacy (PRO), number of grain rows (NGR), diameter of 10 ears measured in millimeters (DE), average diameter of 10 cobs measured in millimeters (DC), average length of 10 husked ears, measured in centimeters (LH). Other characteristics evaluated include the average length of 10 unhusked ears measured in centimeters (LU), the average weight of 10 husked ears measured in grams (WH), the average weight of unhusked ears measured in grams (WU), ear ratio -WU/WE- (RA), husked ears yield measured in t.ha-1 (YH) and unhusked ears yield measured in t.ha-1 (YU).
Genotypes were subjected to the analysis of variance according to a randomized block design. To check the differences between each group of genotypes studied, the degrees of freedom of genotypes were decomposed, and each group was assessed via orthogonal contrasts. Thus, each contrast generated a hypothesis to be tested, and was associated with a sum of squares with different degrees of freedom. Comparisons were drawn up in order to test the effects of groups and the interaction between them. To carry out the statistical analysis, the computational resources of Genes Program were used (CROSS, 2013).
RESULTS AND DISCUSSION
The analysis of variance showed significant differences in genotype for all traits, expressing the existence of genetic variability among genotypes, which is of fundamental importance for genetic improvement (Table 1).
Concerning the genotype by environment, the effects were significant for height plant (HP), plant stand (ST), number of ears (NE), prolificacy (PRO), diameter of ears (DE), diameter of cobs (DC) weight of unhusked ear (WU), ear ratio (WU/WE) (RA) and unhusked years yield (YU) (Table 1). These data indicate there are differences in the performance of genotypes among the evaluated environments for these traits, therefore the inferences about the performance of the progenies should be made for each environment.
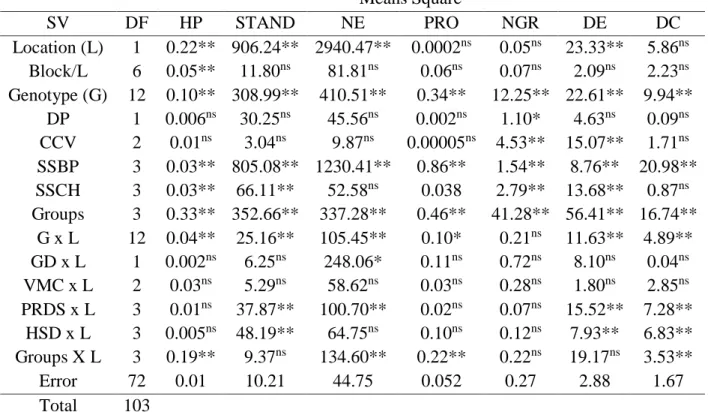
Table 1. Estimates of mean squares of 13 genotypes of Zea mays L. and their five respective groups evaluated at two locations (ColégioAgrícola e Estação Experimental da Pesagro) in Campos dos Goytacazes, State of Rio de Janeiro in the 2013/ 2014 growing season.
Means Square SV DF HP STAND NE PRO NGR DE DC Location (L) 1 0.22** 906.24** 2940.47** 0.0002ns 0.05ns 23.33** 5.86ns Block/L 6 0.05** 11.80ns 81.81ns 0.06ns 0.07ns 2.09ns 2.23ns Genotype (G) 12 0.10** 308.99** 410.51** 0.34** 12.25** 22.61** 9.94** DP 1 0.006ns 30.25ns 45.56ns 0.002ns 1.10* 4.63ns 0.09ns CCV 2 0.01ns 3.04ns 9.87ns 0.00005ns 4.53** 15.07** 1.71ns SSBP 3 0.03** 805.08** 1230.41** 0.86** 1.54** 8.76** 20.98** SSCH 3 0.03** 66.11** 52.58ns 0.038 2.79** 13.68** 0.87ns Groups 3 0.33** 352.66** 337.28** 0.46** 41.28** 56.41** 16.74** G x L 12 0.04** 25.16** 105.45** 0.10* 0.21ns 11.63** 4.89** GD x L 1 0.002ns 6.25ns 248.06* 0.11ns 0.72ns 8.10ns 0.04ns VMC x L 2 0.03ns 5.29ns 58.62ns 0.03ns 0.28ns 1.80ns 2.85ns PRDS x L 3 0.01ns 37.87** 100.70** 0.02ns 0.07ns 15.52** 7.28** HSD x L 3 0.005ns 48.19** 64.75ns 0.10ns 0.12ns 7.93** 6.83** Groups X L 3 0.19** 9.37ns 134.60** 0.22** 0.22ns 19.17ns 3.53** Error 72 0.01 10.21 44.75 0.052 0.27 2.88 1.67 Total 103 Continue… *, ** Significant a 5 e 1% by the F test, respectively.ns Non significant by the F test. DP= donor parents, CCV= common corn variety,
SSBP= super sweet corn backcross populations, SSCH= super sweet corn hybrid, HP = height of ears, STAND= number of plant per experimental unit, NE= number of ears, PRO= prolificacy, NGR= number of grain rows, DE= diameter of ears, DC= diameter of cobs
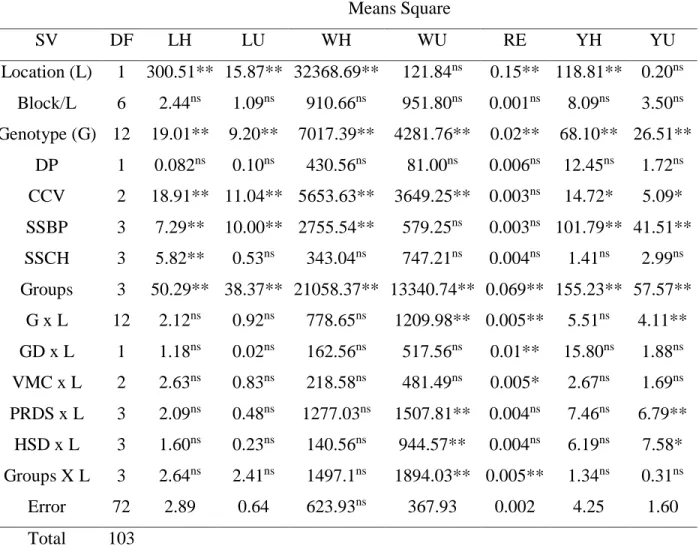
Table 1.Continue. Means Square SV DF LH LU WH WU RE YH YU Location (L) 1 300.51** 15.87** 32368.69** 121.84ns 0.15** 118.81** 0.20ns Block/L 6 2.44ns 1.09ns 910.66ns 951.80ns 0.001ns 8.09ns 3.50ns Genotype (G) 12 19.01** 9.20** 7017.39** 4281.76** 0.02** 68.10** 26.51** DP 1 0.082ns 0.10ns 430.56ns 81.00ns 0.006ns 12.45ns 1.72ns CCV 2 18.91** 11.04** 5653.63** 3649.25** 0.003ns 14.72* 5.09* SSBP 3 7.29** 10.00** 2755.54** 579.25ns 0.003ns 101.79** 41.51** SSCH 3 5.82** 0.53ns 343.04ns 747.21ns 0.004ns 1.41ns 2.99ns Groups 3 50.29** 38.37** 21058.37** 13340.74** 0.069** 155.23** 57.57** G x L 12 2.12ns 0.92ns 778.65ns 1209.98** 0.005** 5.51ns 4.11** GD x L 1 1.18ns 0.02ns 162.56ns 517.56ns 0.01** 15.80ns 1.88ns VMC x L 2 2.63ns 0.83ns 218.58ns 481.49ns 0.005* 2.67ns 1.69ns PRDS x L 3 2.09ns 0.48ns 1277.03ns 1507.81** 0.004ns 7.46ns 6.79** HSD x L 3 1.60ns 0.23ns 140.56ns 944.57** 0.004ns 6.19ns 7.58* Groups X L 3 2.64ns 2.41ns 1497.1ns 1894.03** 0.005** 1.34ns 0.31ns Error 72 2.89 0.64 623.93ns 367.93 0.002 4.25 1.60 Total 103
*, ** Significant a 5 e 1% by the F test, respectively.ns Non significant by the F test. DP= donor parents, CCV= common
corn variety, SSBP= super sweet corn backcross populations, SSCH= super sweet corn hybrid, LH length of husked ears, LU= length of unhusked ears, WH= weight of husked ears, WU= weight of unhusked ears, RE= ears ratio, YH= husked ears yield, YU= unhusked ears yield.
There was a significant effect of contrast between the four groups of genotypes (donor parents, common corn varieties, super sweetcorn backcrossed populations and super sweetcorn hybrids) for all traits (Table 1), evincing distinction between groups and enhancing the coherence of genotype classification groups.
With respect to intra-group differences (Table 1), varieties of common corn expressed significant differences for NGR, DE, LH, LU, WH, WU, YH and YU, suggesting differences in relation to yield components between the genotypes. It can be directly associated to the advance level of recurrent selection cycles applied in these materials and the high heterotic effect of hybrid P8xC8. Except for the WH and RA, significant differences for all agronomic characteristics
evaluated in the four backcrossed populations super sweet corn were observed. This denotes that the conversion from genotypes CIMMYT 8 and Piranão 8 to super sweet corn was efficient in releasing new genotypes of super sweet corn different from the parents.
Among the interpopulation hybrid super sweet corn, significant differences were found for HP, ST, NGR, DE and LH. The variations in the ST trait for genotypes that contain the allele sh2in
homozygous, could be due to germination failures, a common problem in super sweet varieties. The cultivars with allele sh2in homozygous have high content of soluble sugars and low
conversion rates for starch, which reduce their reservations in the endosperm that is the main nutrients source for the germinating embryo (BOROWSKI et al. 1991). Those factors contribute to a low seed vigor, reduced germination and rapid loss of viability, which leads the stand unevenness (ARAGÃO et al. 2001; REIS et al. 2011).
The overall average for each trait evaluated (Table 2) is according to the requirements of fresh corn market, except for the NRG trait.
The average plant height (2.02 m) is within the range cited by Barbosa (1983) and Gamma et al. (1983) for down-height maize with tolerance to high densities and mechanical harvesting. It is appropriate to point out that when one whants to incorporate crop residues into the soil, brachytic cultivars are more applicable so, it does not harm the next planting and it is possible a greater number of crops per year (BORDALLO et al. 2005). The weight of unhusked ears by weight of husked ears (RA) informs indirectly the amount of straw present in the progenies, the mean value (0.65), this trait is positively correlated with RA with industrial productivity. This affirmation indicates that the increased industrial productivity could be achieved through of reduction weight of the straw. However, it is necessary to pay attention to not reduce the stuffing until the point of increasing the damage by pest and disease.
It was estimated an average equal 1.61 for the PRO trait. This result expresses relevant amount as indicating the degree of prolificacy of genotypes. Pereira et al. (2009), working with agronomic and nutritional characters of sweet corn genotypes, obtained average was 1.38 for the same trait. Due to the demands of the sweet corn market (large and well grenades ears) it required greater attention to the prolificacy trait, because, they negatively correlated with the percentage of commercial ears (YOUNES AND ANDREW, 1978). Although the index showed values higher than one unity, and consequently the progenies are prolific, the ears had excellent quality, both for fresh consumption and for industrial acceptance.
Table 2. Overall mean and experimental parameters of 16 genotypes at two locations (Colégio Agrícola e Estação Experimental da Pesagro) in Campos dos Goytacazes, State of Rio de Janeiro in the 2013/ 2014 growing season.
Characteristics X CVe
% CVg
% IV
% AS 2 H HP 2.02 5.57 6.49 116.5 0.94 91.67 ST 33.35 9.57 18.32 191.4 0.98 96.69 NE 53.74 14.15 12.78 90.31 0.94 89.11 PRO 1.61 13.92 11.59 83.26 0.92 75.00 NGR 12.75 4.11 9.59 233.3 0.98 97.39 DE 45.45 3.37 3.45 102.3 0.93 87.23 DC 26.31 4.91 3.86 78.61 0.91 83.06 LH 28.27 9.15 5.91 64.59 0.92 84.79 LU 20.27 3.95 5.10 129.1 0.96 93.04 WH 329.54 7.57 8.57 113.2 0.95 91.11 WU 214.24 8.95 10.32 115.2 0.95 91.41 RE 0.65 7.3 6.80 93.15 0.94 88.00 YH 15.66 13.66 18.03 131.9 0.96 93.77 YU 10.13 12.51 17.40 139.0 0.96 93.96 X = overall mean, % eCV = coefficient of genotypic variation, CVg % = coefficient of genetic variation, rgg
^
= accuracy, 2
H = herdability, HP = height of ears, ST= number of plant per experimental unit, NE= number of ears, PRO= prolificacy, NGR= number of grain rows DE= diameter of ears, DC= diameter of cobs, LH length of husked ears, LU= length of unhusked ears, WH= weight of husked ears, WU= weight of unhusked ears, RE= ears ratio, YH= husked ears yield, YU= unhusked ears yield.
For ST average was about 33 plants experimental unit-1, this result denotes the loss of plants into some treatments, once the ideal stand for this study was 50 plants experimental unit-1. Researches of sweet corn, in general, have shown inferior quality in the seeds, possibly due to greater sensitivity to physical damage and those from its biochemical changes. There is not certainties if the low seed vigor is due to a lower starch reserve into the endosperm, or the fact that the embryo itself is genetically inferior and for this reason it has a low vigor, or if it is still caused by the bad manipulation and storage of seeds (WALTERS JR & BLANCHETTE, 1983; MCDONALD et al. 1994). Evaluating super sweet corn genotypes containing allele sh2 in
homozygous about the response to seedling transplanting compared to direct seeding Welbaum et al. (1998), had higher germination percentage using transplanting with productivity differences of 12.08 t.ha-1 for transplanting versus 8.74 t ha-1 with direct seeding. In this case, one can conclude
that genotypic effects may be involved both in the formation of the final stand and in yield super sweet corn genotypes present in this study.
Estimates of determination genotypic coefficient ranged from 75.00 to 96.69 (Table 2). This parameter is a measure of the relative importance of heredity. High estimates as those found in this study, can be inferred that most of the variation of genotypes is due to genetic causes. These data are confirmed by the observed selective accuracy, since the values were between 0.91 and 0.98 (Table 2). According to the scale proposed by Resende and Duarte (2007) estimates an accuracy of higher than 0.90 was classified as very high. The variation index (Iv) expressed above 1 unit to most traits, except for NS, PRO, DE, DC, LH and RA, indicating that the genotypic variation is higher than experimental variation (Table 2). Moreover, it should be noted that the CVe values are within normal limits as proposed by Scapim et al. (1995) for experiments with corn, since the range was about 3.37 and 14.15%.
Resende & Duarte (2007) highlight the advantages of statistics as heritability, coefficient of determination, F test, accuracy and others to estimate the experimental precision, and recommend that the evaluation tests are addressed for genetic as statistical approach. Similarly, their propose to use of selective accuracy due to its property to report on the effectiveness of inference of genetic value, it is the product of the ratio of genetic by residual variations, plus the number of repetitions. According to the information above, it is clear, in this paper,that the environmental effects related to evaluation sites were not prevalent or harmful to, the genetic variability of the genotypes under evaluation. One registers results (Table 3) about the performance of each group in each environment, as well as estimates of heterosis for the traits required by the sweet corn market. Traits such as WU, LU, DE, NGR and YH need greater attention from sweet corn breeders because the cultivars that do not comply with market requirements may be not marketed.
For this reason, cultivars must have: weight unhusked ear higher or equal to 200g, length unhusked ears with 20cm diameter ear higher or equal to 30mm, number of grain rows equal to 14 and yield greater or equal than 12tha-1 (PEREIRA FILHO, 2003).
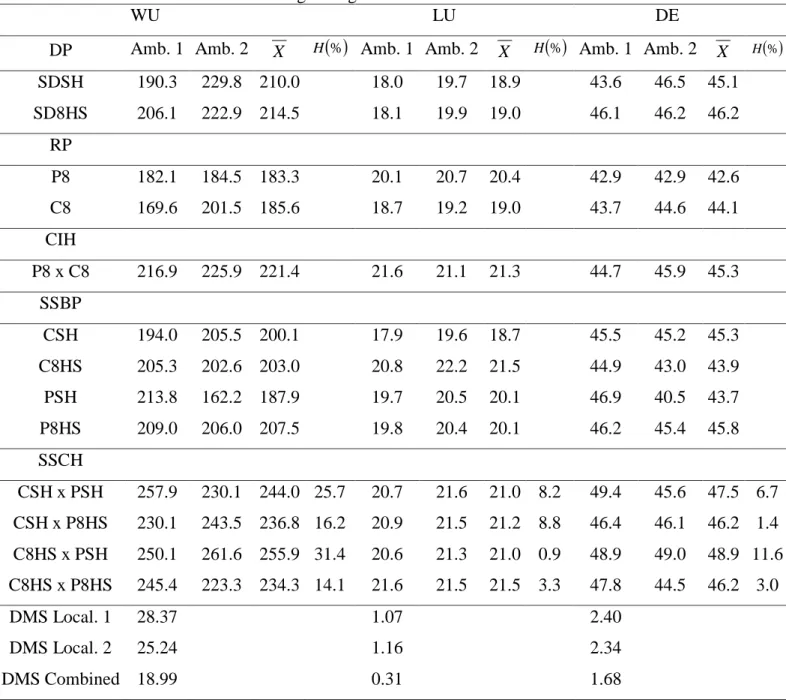
Table 3. Averages (X ) and heterosis estimative (H) of 16 genotypes at two locations (Colégio Agrícola e Estação Experimental da Pesagro) in Campos dos Goytacazes, State of Rio de Janeiro in the 2013/ 2014 growing season.
WU LU DE
DP Amb. 1 Amb. 2 X H % Amb. 1 Amb. 2 X H % Amb. 1 Amb. 2 X H %
SDSH 190.3 229.8 210.0 18.0 19.7 18.9 43.6 46.5 45.1 SD8HS 206.1 222.9 214.5 18.1 19.9 19.0 46.1 46.2 46.2 RP P8 182.1 184.5 183.3 20.1 20.7 20.4 42.9 42.9 42.6 C8 169.6 201.5 185.6 18.7 19.2 19.0 43.7 44.6 44.1 CIH P8 x C8 216.9 225.9 221.4 21.6 21.1 21.3 44.7 45.9 45.3 SSBP CSH 194.0 205.5 200.1 17.9 19.6 18.7 45.5 45.2 45.3 C8HS 205.3 202.6 203.0 20.8 22.2 21.5 44.9 43.0 43.9 PSH 213.8 162.2 187.9 19.7 20.5 20.1 46.9 40.5 43.7 P8HS 209.0 206.0 207.5 19.8 20.4 20.1 46.2 45.4 45.8 SSCH CSH x PSH 257.9 230.1 244.0 25.7 20.7 21.6 21.0 8.2 49.4 45.6 47.5 6.7 CSH x P8HS 230.1 243.5 236.8 16.2 20.9 21.5 21.2 8.8 46.4 46.1 46.2 1.4 C8HS x PSH 250.1 261.6 255.9 31.4 20.6 21.3 21.0 0.9 48.9 49.0 48.9 11.6 C8HS x P8HS 245.4 223.3 234.3 14.1 21.6 21.5 21.5 3.3 47.8 44.5 46.2 3.0 DMS Local. 1 28.37 1.07 2.40 DMS Local. 2 25.24 1.16 2.34 DMS Combined 18.99 0.31 1.68 Continue…
DP= donor parents, RP= recurrent parents, CIH= common corn interpopulation hybrid, SSBP= super sweet corn backcross populations, SSCH= super sweet corn hybrid, WU= weight of unhusked, LU= length of unhusked ears, DE= diameter of ears.
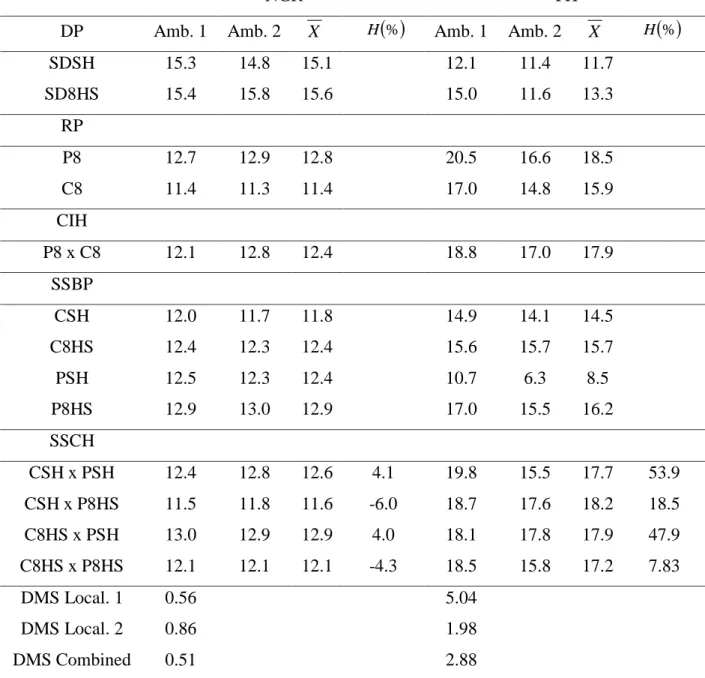
Table 3. Continue...
NGR YH
DP Amb. 1 Amb. 2 X H
% Amb. 1 Amb. 2 X H
%SDSH 15.3 14.8 15.1 12.1 11.4 11.7 SD8HS 15.4 15.8 15.6 15.0 11.6 13.3 RP P8 12.7 12.9 12.8 20.5 16.6 18.5 C8 11.4 11.3 11.4 17.0 14.8 15.9 CIH P8 x C8 12.1 12.8 12.4 18.8 17.0 17.9 SSBP CSH 12.0 11.7 11.8 14.9 14.1 14.5 C8HS 12.4 12.3 12.4 15.6 15.7 15.7 PSH 12.5 12.3 12.4 10.7 6.3 8.5 P8HS 12.9 13.0 12.9 17.0 15.5 16.2 SSCH CSH x PSH 12.4 12.8 12.6 4.1 19.8 15.5 17.7 53.9 CSH x P8HS 11.5 11.8 11.6 -6.0 18.7 17.6 18.2 18.5 C8HS x PSH 13.0 12.9 12.9 4.0 18.1 17.8 17.9 47.9 C8HS x P8HS 12.1 12.1 12.1 -4.3 18.5 15.8 17.2 7.83 DMS Local. 1 0.56 5.04 DMS Local. 2 0.86 1.98 DMS Combined 0.51 2.88
DP= donor parents, RP= recurrent parents, CIH= common corn interpopulation hybrid, SSBP= super sweet corn backcross populations, SSCH= super sweet corn hybrid, NGR= number of grain rows and YH= husked ears yield.
When comparing the averages of the individuals in each group, one can see the higher performance of the donor parent (SD8HS) that showed superiority for all traits. Analyzing NGR character, it can be inferred that the SDSSH and SDS8HS populations, that is, the sweet character of donors have on average 15.1 and 15.6 respectively, higher values than recurrent parents and market imposition as well. However, this mean was not kept in the backcrossed populations as well as to intrapopulational hybrids. We can see (Table 3) the range was from 11.8 to 12.9 and
consequently it had low heterosis estimated. This result was expected, because donors were crossed once, in order to transfer only the sh2 gene and then about 98% of the recurrent parent genome was
recovered. The manifestation of heterosis leads to the conclusion that there is genetic diversity among the genotypes analyzed. However the opposite is not always true; in other words, the absence of heterosis does not necessarily imply a lack of genetic diversity among the parents or absence of dominance, since the sum of the dominance deviations may be null, when they have opposite signs (SCAPIM et al., 2002). In addition to this statement, there is a significant genotype effect, the estimate heritability (97.39) and genetic variation index (2.33), then can be inferred that there is genetic variability within intrapopulational hybrids to this trait, so there is the possibility of genetic gains via selection (Table 2). Emphasis should also be given to the drop in performance of the super sweet population PSH, for both WU and for YH, especially in the environment 2. Due to the proximity of the environment, this fact may be related to failures in the practice of cultivation during the development in this environment, which may well have affected their performance. Although the yield of PSH population on the environment 1 (10.7 t ha-1) had showed superior performance when compared to environment 2 (6.3 t ha-1), it had the worst performance within their group in both environments. Thus, genetic effects, for example, non-allelic complementarity may also be involved.
Analysing the means between the groups, it is noted the similarity between the values obtained for interpopulation corn hybrids super sweet corn and intrapopulational hybrid corn common in all characteristics (Table 3). These facts indicate heterotic effects derivative of crossing between backcrossed parents and effectiveness of backcrossing in the recovery of their genomes. For all traits evaluated, there were heterosis effects (Table 3), indicating that the development of hybrid lines derived from backcrossed populations is an excellent alternative for obtaining promising cultivars.
In spite of being in the early stages of improvement, these super sweet corn populations, already answered to the requirements for marketing and they are up than some varieties. Working with 16 hybrid varieties, Pereira et al. (2009) obtained an average yield of 11.13 t.ha-1, while in this study, evaluating the same traits, it was obtained an interpopulation hybrid performance exceeding 37.29%. When assessing super sweet corn hybrids, the diameter and length of unhusked ears, Souza et al. (2013) found these results, 45.7 mm and 17.8 cm respectively. In contrast, this paper presents a similar estimate for DE (46.3) and LU (15.91%), higher values than those published by these
authors. The results of super sweet corn backcrossed populations and super sweet corn hybrid interpopulation showed the high potential of these populations to breeding.
CONCLUSIONS
All of those populations (CSH, C8HS, PSH and P8HS) are recommended for use in obtaining lines, aimed at obtaining high value hybrids in breeding programs, or even directly as commercial hybrids after further assessments.
REFERENCES
ABRASEM - Associação brasileira do comércio de sementes e mudas 2011. Pesquisa de mercado
de sementes de hortaliças 2011. Campinas. Available in:
<http://www.abcsem.com.br/dadosdosegmento.php>. Access in: July 30, 2015.
REETZ, E. R; KIST, B. B.; SANTOS, C.E. DE.; DRUN, M. 2014. Anuário Brasileiro de Hortaliças. Santa Cruz do Sul: Editora Gazeta Santa Cruz. 88 p.
ARAGÃO, C. A.; LIMA, M. W. P. DE.; MORAES, O. M.; ONO, E. O.; BAORO, C. S.F.; RODRIGUES, J. D; NAKAGAWA, J.; CAVARIANI, C. 2001.Fitorreguladores na germinação e no vigor de plântulas de milho super doce. Revista Brasileira de Sementes, Londrina,v.23
n.1 p.62-67. Available in:
<http://www.abrates.org.br/revista/artigos/2001/v23n1/artigo09.pdf>Access in: July 25, 2015. ASSUNÇÃO, A.; BRASIL, E. M.; OLIVEIRA, J. P. DE.; REIS, A. J. S. DOS.; PEREIRA, A.F.;
BUENO, L. G.; RAMOS, M. R. 2010. Heterosis performance in industrial and yield components of sweet corn. Crop Breeding and Applied Biotechnology. Viçosa, v.10 n.3 p.183-190. Available in: <http://dx.doi.org/10.1590/S1984-70332010000300001>. Access in: August 15, 2014.
BARBOSA, J.V.A. FISIOLOGIA DO MILHO. 1983. In: EmpresaBrasileira de Assistência técnica e extensão rural. Cultura do Milho, Brasília,7-12 p.
BORDALLO, P.N.; PEREIRA, G. P.; JUNIOR, A. T. A. DO.; GABRIEL, A. P. 2005. Análise dialélica de genótipos de milho-doce e comum para caracteres agronômicos e proteína total. Horticultura Brasileira. Brasília, v.23 n.1 p.123-127. Available in: <http://www.scielo.br/pdf/hb/v23n1/a26v23n1.pdf>. Access in: May 30, 2015.
BOROWSKI, A.M.; VICENTE, A.F.; WATERS J.R. 1991. Seed maturity influences germination and vigor two shrunken-2 sweet corn hybrids. Journal America Society Horticultural
Science. Virgínia, v.116 Available in:
<http://journal.ashspublications.org/content/116/3/401.full.pdf+html>. Access in: February 17, 2015.
BRASIL 2014. Ministério da Agricultura, Pecuária e Abastecimento. Registro Nacional de Cultivares - RNC/ Ministério da Agricultura, Pecuária e Abastecimento. Secretaria de Defesa
Agropecuária. – Brasília. Available in:
<http://extranet.agricultura.gov.br/php/snpc/cultivarweb/cultivares_registradas.ph p>. Access in: July 30, 2014.
CRUZ, C.D. 2013. GENES - a software package for analysis in experimental statistics and quantitative genetics. Acta Scientiarum, Maringá, v.35 n.3 p.271-276. Available in: <http://www.scielo.br/pdf/asagr/v35n3/v35n3a01>. Access in: April 22, 2016.
ENTRINGER, G.C.; VETTORAZZI, J.C.F.; SANTOS, E. A.; PEREIRA, M. G.; VIANA, A. P. 2016. Genetic gain estimates and selection of S1 progenies based on selection indices and REML/ BLUP in super sweet corn. Australian Journal of Crop Science, Australia. v.10 n.3 p.411-417. Available in: < DOI: 10.21475/ajcs.2016.10.03p7248>. Access in: November 22, 2016.
YOUNES, M. H.; ANDREWS, R. H. 1978. Productivity and prolificicacy in a diallel series of Market sweet corn hybrids. Crop Science, Madison, v.18 n.2 p.224-226. Available in: <doi:10.2135/cropsci1978.0011183X001800020007x>. Access in: November 20, 2014.
MCDONALD, M.B.; SULLIVAN, J.; LAWER, M.J. 1994. The pathway of water uptake in maize seeds. Seed Science and Tecnology, Virgina, v.22 n.1 p.79-90. <agris.fao.org/agris-search/search.do?recordID=CH9500182>.Access in: September 22, 2015.
PEREIRA, A.F.; MELO, P.G.S.; PEREIRA, J. M.; ASSUNÇÃO A.; NASCIMENTO A. A. DOS.; XIMENES P.A. 2009. Caracteres agronômicos e nutricionais de genótipos de milho doce. Bioscience Journal, Uberlândia, v.25 n.1 p.104-112. Available in: <http://www.seer.ufu.br/index.php/biosciencejournal/article/view/6828> Access in: September 22, 2014.
PEREIRA FILHO, I. A; CRUZ, J.C., GAMA, E.E.G. 2003. Cultivares para o consumo verde. In: Pereira Filho, I. A. O cultivo do milho verde. Brasília,17-30p.
REIS, S. R.; PEREIRA, M. G.; SILVA, R. F. DA.; MEIRELES, R. C. 2011. Efeito da heterose na qualidade de sementes de milho doce. Revista Brasileira de Sementes, Londrina, v.33 n.2 p.310-315. Available in: <http://dx.doi.org/10.1590/S0101-31222011000200013>. Access in: March 10, 2015.
RESENDE, M.D.V.; DUARTE, J.B. 2007. Precisão e controle de qualidade em experimentos de avaliação de cultivares. Pesquisa Agropecuária Tropical, Goiânia, v.37 n.3 p.182-194. Available in: <http://ainfo.cnptia.embrapa.br/digital/bitstream/item/32984/1/Pecisao-e-controle-de-qualidade-em-experimentos.pdf>Access in: October 3, 2014.
SCAPIM, C. A.; PACHECO, C. A. P.; TONET, A.; BRACCINI, A. L. DE.; PINTO, R. J. B. 2002. Análise dialélica e heterose de populações de milho-pipoca. Bragantia, Campinas, v.61 n.3 p.219-230. Available in: <http://dx.doi.org/10.1590/S0006-87052002000300003>. Access in: September 10, 2015.
SCAPIM, C. A.; CARVALHO, C. G. P.; CRUZ, C. D. 1995. Uma proposta de classificação dos coeficientes de variação para a cultura do milho. Pesquisa Agropecuária Brasileira, Brasília
– DF v.30 n.4 p.683-686. Available in:
<http://www.alice.cnptia.embrapa.br/bitstream/doc/995743/1/Umapropostadeclassificacaodos coeficientesdevariacaoparaaculturadomilho.pdf>Access in: September 30, 2014.
SOUZA, R. S.; VIDIGAL FILHO, P. S.; SCAPIM C. A.; MARQUES O. J. QUEIROZ D. C.; OKUMURA R.S.; RECHE, D. L.; CORTINOVE, V. B. 2013. Qualidade e produtividade do milho-doce em diferentes populações de plantas. Semina: Ciências Agrárias, Londrina, v.34 n.3 p.995-1010. Available in: <DOI: 10.5433/1679-0359.2013v34n3p995>. Access in: December 6, 2015.
TEIXEIRA, F. F.; MIRANDA, R. A.; PAES, M.C.D.; SOUZA, S.M.; GAMA E.E.G. 2013. Melhoramento do milho doce. Sete Lagoas: Embrapa Milho e Sorgo, 32p.
WATERS, L.; BLANCHETTE, B. 1983. Prediction of sweet corn field emergence conductivity and cold tests. Journal of American Society Horticultural Science, Virgina, v.108 n.5 p. 778-781. Available in: <http://agris.fao.org/agris-search/search.do?recordID=US19840069698>. Access in: July 12, 2015.
WELBAUM, G.E.; BRASFORD K.J.; KYU-OCK YIN.; BOOTH D.T.; OLUOCH, M.O. 1998. Biophysical, physiological and biochemical processes regulating seed germination.Seed
Science Research,Napoli. 8:161-172. Available
in:<http://dx.doi.org/10.1017/S0960258500004074>. Access in: September 17, 2016.
Recebido em: 12/12/2016 Aceito para publicação em: 24/4/2017