Acta Scientiarum. Agronomy Maringá, v. 33, n. 4, p. 575-581, 2011
Mathematical modeling of the drying process of corn ears
Paulo Cesar Corrêa, Fernando Mendes Botelho*, Gabriel Henrique Horta Oliveira, André Luis Duarte Goneli, Osvaldo Resende and Sílvia de Carvalho Campos
Departamento de Engenharia Agrícola, Centro de Ciências Agrárias, Universidade Federal de Viçosa, Cx. Postal 270, 36571-000, Viçosa, Minas Gerais, Brazil. *Author for correspondence. E-mail: [email protected]
ABSTRACT. The objective of this work was to study and model the drying process of corn ears at different air temperatures. Thermodynamic properties associated with the drying process of this product were also determined. Corn ears with initial moisture content of 0.45 dry basis (kgw kgdm-1) were dried until they reached a final moisture content of 0.12 (kgw kgdm-1) at temperatures of 45, 55 and 65°C. Traditional models used to describe the drying process of several agricultural products were employed to fit the observed data of the drying process of corn ears. The effective diffusion coefficient (Def) was determined by
means of an analytical solution of Fick’s second law. It was concluded that the Logarithmic model was the one that best fit the observed data representing the drying process. Def values
increased with temperature increases, ranging from 5.490 x 10⁻¹⁰ to 1.163 x 10⁻⁹ m2 s-1. Based on the dependence of the drying constant of the Logarithmic model with temperature, thermodynamic properties were determined, concluding that the drying kinetics variation is dependent on the energy contributions of the surrounding environment.
Keywords:Zea mays,mathematical models, moisture content.
RESUMO. Modelagem matemática do processo de secagem de espigas de milho. Objetivou-se com este trabalho estudar e modelar o processo de secagem do milho em espiga para diferentes condições de temperatura do ar. Buscou-se, ainda, determinar algumas relações termodinâmicas associadas à secagem deste produto, para a faixa de temperatura utilizada. Utilizaram-se espigas de milho com teor de água inicial de 0,45 (b.s.), que foram secas até um teor de água final de 0,12 (b.s.), nas temperaturas de 45, 55 e 65°C. Aos dados observados da secagem das espigas de milho ajustaram-se diferentes modelos tradicionalmente utilizados para descrever o processo de secagem de diversos produtos agrícolas. O coeficiente de difusão efetivo (Def) foi determinado por meio da solução analítica para a segunda lei de Fick. Conclui-se que o modelo Logarithmic foi o que melhor se ajustou aos dados observados, sendo o indicado para representar o processo de secagem do milho em espiga. O Def aumentou com a elevação da temperatura, variando de 5,490 x
10-10 a 1,163 x 10-10 m2 s-1. Com base na dependência da constante de secagem do modelo Logarithmic com a temperatura, determinaram-se alguns parâmetros termodinâmicos, a partir do qual foi possível verificar que a variação da cinética de secagem é dependente de contribuições de energia do meio.
Palavras-chave:Zea mays,modelos matemáticos, teor de água.
Introduction
Corn is one of the most important cultivated and consumed cereals in Brazil and in the world due to its potential productivity, chemical composition and nutritional value. Corn ears, still fresh, are often used in Brazil as raw materials for some traditional recipes, such as porridge, pamonha and cakes, besides being consumed in cooked or baked form.
In seed production, aiming higher quality for the final product, producers harvest corn ears in a period near its physiological maturation. This harvest method allows the product to remain for a limited time in the field, avoiding material exposure to climatic events, microorganisms and insect attacks
that could depreciate its physical and physiological quality. However, in this process, corn is harvested under conditions of high humidity, requiring it to be dried as soon as it is harvested.
mechanisms, require water for their activities. With a reduction in the water availability, until safe levels of storage are provided, the water activity and speed of chemical reactions are reduced; thus, the microorganism’s development is also reduced.
The simulation and theoretical information about each product’s behavior during moisture removal are very important for drying systems study, equipment development, optimization and the determination of commercial viability (CORRÊA et al., 2007).
Several methods have been proposed to analyze and simulate the drying process in hygroscopic products. In processes that are able to be modeled (drying, for instance), two types of models can be used: theoretical and empirical. The first models are based on laws and theories, which are difficult to manage due to their complexity and the involvement of several functions and parameters; these are not convenient for computational practices in most situations (MASKAN, 2002). The empirical models normally do not possess a theoretical formulation and are usually obtained through simple mathematical analogies based on experimental data and dimensional and statistical analysis. These models frequently present a good fit for the observed data. However, their use is limited due to their dependence on the experimental conditions in which the data were obtained and the characteristics of the material that was used. They also require several experimental tests and should not be extrapolated (MAYOR; SERENO, 2004). Despite these facts, these models were proposed by researches to simulate several processes in different engineering areas, obtaining satisfactory results (BALA; WOODS, 1984; MIDILLI et al., 2002; PELEG, 1988).
Depending on the material being dried, moisture can move into the interior by different mechanisms. In porous products, like most agricultural products, possible moisture transportation mechanisms include: liquid diffusion, capillary diffusion, diffusion in the surface, hydrodynamic flow, vapor diffusion and thermal diffusion (BROOKER et al., 1992).
The mechanism of moisture diffusion in agricultural products is very complex due to the diversity of chemical compositions and the physical structure of products. In the literature regarding drying involving the moisture diffusion phenomenon, large variations in diffusivity coefficient values are observed, not only due to the product’s complexity, but also due to the different prediction methods that are used, the material type,
moisture content, the drying process and the methodology that is used (RESENDE et al., 2005).
For the calculation of the effective diffusion coefficient, many researchers have been using the liquid diffusion theory, known as Fick’s second law, which establishes a relationship between the diffusion coefficient and the concentration gradient in a given environment. An effective diffusion coefficient can be used when grain is considered to be homogeneous material (IGUAZ et al., 2003).
Drying curves obtained under controlled conditions provide important information regarding the water transportation mechanisms, and they are utilized in the determination of the effective diffusion coefficient (GELY; SANTALLA, 2007).
Having in mind corn processing, the storage of corn ears and the lack of theoretical information about the corn ears’ drying processes, the goal of this work was to estimate and model the drying curves and determine the effective diffusion coefficients for corn ears for different drying conditions.
Material and methods
The present work was developed at the Laboratory of Physical Properties and Quality Evaluation of Agricultural Products belonging to the National Grain Storage Training Center – CENTREINAR, located at Federal University of Viçosa, Viçosa, Minas Gerais State, Brazil.
Determination and modeling of drying curves
Corn ears were utilized, (variety UFVM – 100), with an initial moisture content of 0.45 kgw kgdm-1
(kg of water by kg of dry matter), dried until a final moisture content of 0.11 kgw kgdm-1 was reached.
The product moisture content was measured by a gravimetric process until constant mass was reached and the ears were divided into three pieces. Afterwards, a piece was randomly chosen and dried in an oven at 105 ± 1°C.
Drying the corn ears to obtain the remaining moisture content levels was accomplished in an oven with forced circulation at temperatures of 45, 55 and 65°C, with three repetitions.
The experimental data of the drying process of corn ears were fit to mathematical models expressed by equations one through ten (Table 1). These models are frequently used to describe the drying phenomenon in agricultural products.
To determinate the moisture ratio (MR)
Acta Scientiarum. Agronomy Maringá, v. 33, n. 4, p. 575-581, 2011 Table 1. Mathematical models to obtain the drying curves of
agricultural products.
Model name Model equation
Page MR=exp
(
−k tη)
(1)Diffusion approach MR=aexp(−k t) (+1−a)exp(−kb t) (2) Two-term exponential MR=aexp(−k t) (+1−a)exp(−kbt) (3)
Verna MR=aexp(−k t) (+1−a)exp(−gt) (4)
Newton MR=exp(−k t) (5)
Midili MR=aexp
(
−k tη)
+bt (6)Logarithmic MR=aexp(−k t)+b (7)
Henderson and Pabis MR=aexp(−k t) (8) Two-term model MR=aexp(−k t)+bexp(−gt) (9) Modified Henderson and
Pabis MR=aexp(−kt)+bexp(−gt)+cexp(−ht)(10)
where:
t = drying time, s; k = drying constant, s-1;
a, b, c, g, h, η = model’s parameters, dimensionless.
0
t e
e
U U
MR
U U
− =
− (11)
where:
Ut = moisture content at a given time, kgw kgdm-1;
Uo = initial moisture content, kgw kgdm-1 ;
Ue = equilibrium moisture content, kgw kgdm-1.
Statistical analysis
The models were fit to the drying data, and a non-linear regression procedure was performed using the Gauss Newton method to estimate the parameters of the mathematical models, using the program STATISTICA 6.0®. To evaluate the degree
of fit of each model to the observed data, the magnitudes of the determination coefficients (R2),
the mean relative error (MRE), the standard error of estimate (SEE) and the residual distribution (RD) plots were used. The mean relative error and standard error of estimate were calculated by the following expressions:
1 -100 n exp pre
i exp
M M
MRE
n = M
=
(12)
(
)
21
-n
exp pre i
f
M M
SEE
D
=
= (13)
where:
Mexp = experimental value of drying process;
Mpre = value predicted by the model;
n = number of data points;
Df = degrees of freedom of the regression model.
Determination of the Effective Diffusion Coefficient (Def)
The effective diffusion coefficient was obtained through the model adjustment of the liquid diffusion (described by Equation 14), to the drying experimental data of corn ears. This equation is the analytical solution of Fick’s second law, considering the geometric shape of a cylinder, ignoring the grain volumetric variation and considering the known moisture condition at the grain surface (BROOKER et al., 1992).
2
2 2
1 0
4
exp n ef t e
i
e n
D t
U U
MR
U U r
λ λ
∞
=
−
−
= =
−
(14)where:
MR = moisture ratio, dimensionless; λn = Bessel Equation roots;
Def = effective diffusion coefficient (m² s-1);
R =equivalent radius (m).
The analytical solution of this equation is presented in the form of an infinite series, and therefore, finite terms numbers (n) in truncation are able to determinate the results with satisfactory precision.
The equivalent radius of a product is defined as the radius of a sphere having the equivalent volume of the product. To achieve the average volume for corn ears, a straight cylinder shape was considered. In order to calculate the volume, length (a), width (b) and thickness (c) measurements for the corn ears were made using a digital pachymeter with 0.01 mm precision, considering the cylinder diameter as the average of the width and the thickness, as shown by Equation 15.
(
)
216 π
= +
V a c b (15)
Temperature influence on the drying constant and thermodynamic considerations
To evaluate the temperature influence on the drying constant, the Arrhenius equation was used (Equation 16).
0exp
=
a
abs k
R T E
k (16)
k = drying constant, s-1;
k0 = pre-exponential factor, s-1;
Ea= activation energy, kJ mol-1;
R = universal gas constant, 8.314 J mol-1 K-1;
Tabs = absolute temperature, in K.
The activation energy value allowed the determination of different thermodynamic parameters, such as the enthalpy, entropy and Gibbs free energy of activation, according to equations 17, 18 and 19 (JIDEANI; MPOTOKWANA, 2009).
*
Δ
H
=
E
a−
RT
abs (17)*
ln ln ln
Δ = − −
b
abs p
k
S R k T
h (18)
* * *
ΔG = ΔH −TabsΔS (19)
where:
ΔH* = enthalpy of activation, J mol-1;
ΔS* = entropy of activation, J mol-1;
ΔG* = Gibbs free energy of activation, J mol-1;
kb = Boltzmann constant, 1.38 × 10⁻²³ J K-1;
hp = Planck’s constant, 6.626 × 10⁻³⁴ J s.
Results and discussion
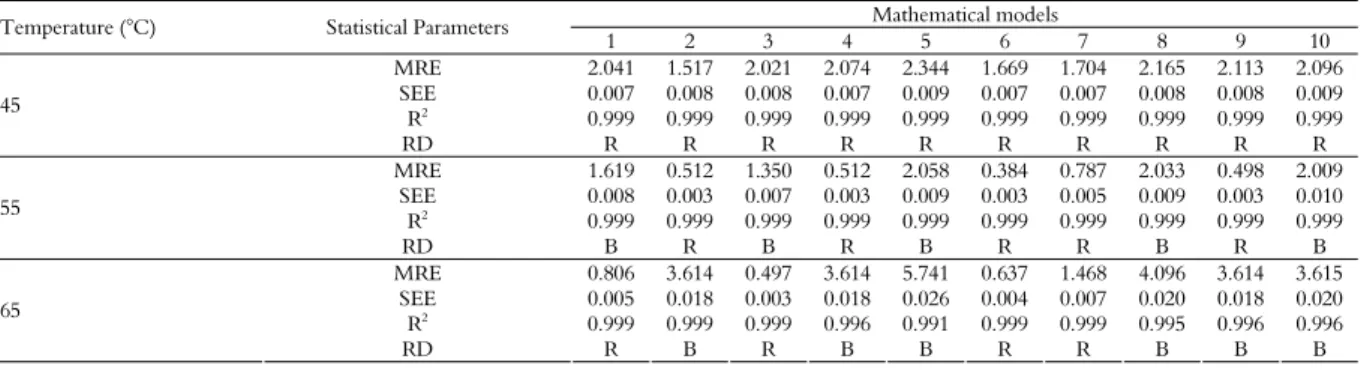
The statistical parameters obtained in order to verify the fit of each model to the observed data during the corn ears’ drying at temperatures of 45, 55 and 65°C are presented in Table 2.
In Table 2, we notice that, for the three drying air temperatures, all of the models presented determination coefficients (R2) greater than 0.99,
satisfactory values of standard error of estimate (SEE) and mean relative error (MRE) lower than ten percent, which, according to Mohapatra and Rao (2005), represents a good fit for the experimental data. However, only the Midili and Logarithmic models (models 6 and 7, respectively), presented random distributions of the residual plots for the three drying temperatures. The Logarithmic model was recommended to describe the corn ears’ drying phenomenon due to lower parameter numbers. Midili
and Kucuk (2003) also recommended the Logarithmic model as the one most suitable for describe unshelled and shelled pistachios using solar energy. Goyal et al. (2007) recommended the model as the one that best represents plums’ drying behavior.
Table 3 presents the Logarithmic model’s fit coefficients which are designed for the three air drying temperatures for corn ears.
As Table 3 shows, the model coefficients varied with temperature; the coefficient b decreased and the coefficients a and k increased with the increase in temperature. According to Babalis and Belessiotis (2004), the drying constant (k) can be utilized as an approximation for characterizing the temperature effect; it is related to the effective diffusivity of the drying process’s falling period and the liquid diffusion that governs this process. The equations that describe these coefficients, correlating to temperature, are shown in Table 4.
The activation energy for the water diffusion of corn ears during the drying process, obtained by the variation of the drying constant with temperature, was 17,644.8 J mol-1. Zogzas et al. (1996) reported
that activation energy generally ranges from 12.7 to 110 kJ mol-1 for food; therefore, a consistent value
was achieved in this study. Furthermore, this value was lower than observed by Doymaz and Pala (2003) with studying corn; they acquired an activation energy-for the variation of effective diffusion coefficients of 29.56 kJ mol-1. It is also
slightly inferior to the value that was established by Corrêa et al. (2007), which verified an activation energy of 10.08 kJ mol-1 for edible beans, in a
temperature range of 25 to 55°C.
The Logarithmic model can be presented with the described coefficients as a function of temperature in the corn ears drying modeling with the temperature range of 45 to 65°C, according to Equation 20.
( )
( )
17644.8
0.01110211 0.51609802 exp 4.6292
-0.01084858 0.47428181
+ − −
=
+ +
abs
T t
RT MR
T
(20)
Table 2. Mean relative error (MRE), standard error of estimate (SEE), determination coefficients (R²) and residual distribution behavior {random (R) or biased (B)}, of the models and drying air temperatures.
Mathematical models Temperature (°C) Statistical Parameters
1 2 3 4 5 6 7 8 9 10 MRE 2.041 1.517 2.021 2.074 2.344 1.669 1.704 2.165 2.113 2.096
SEE 0.007 0.008 0.008 0.007 0.009 0.007 0.007 0.008 0.008 0.009 R2 0.999 0.999 0.999 0.999 0.999 0.999 0.999 0.999 0.999 0.999
45
RD R R R R R R R R R R
MRE 1.619 0.512 1.350 0.512 2.058 0.384 0.787 2.033 0.498 2.009 SEE 0.008 0.003 0.007 0.003 0.009 0.003 0.005 0.009 0.003 0.010 R2 0.999 0.999 0.999 0.999 0.999 0.999 0.999 0.999 0.999 0.999
55
RD B R B R B R R B R B
MRE 0.806 3.614 0.497 3.614 5.741 0.637 1.468 4.096 3.614 3.615 SEE 0.005 0.018 0.003 0.018 0.026 0.004 0.007 0.020 0.018 0.020 R2 0.999 0.999 0.999 0.996 0.991 0.999 0.999 0.995 0.996 0.996
65
Acta Scientiarum. Agronomy Maringá, v. 33, n. 4, p. 575-581, 2011 where:
T = drying temperature, °C; t = drying time, s.
Table 3. Logarithmic model’s fit coefficients for temperatures of 45, 55 and 65°C.
Temperatures (°C) Coefficients
45 55 65
a 1.037059 1.083981 1.259102
k 1.24 x 10⁻⁵ 1.51 x 10⁻⁵ 1.84 x 10⁻⁵
b -0.030713 -0.088774 -0.247684
Table 4. Variation of Logarithmic model coefficients with temperature, with the respective determination coefficients (R2
).
Equation R2 (%)
0.01110211 0.51609802
a= T+ 0.999
- 0.01084858 0.47428181
b= T+ 0.933
( )
17644.8ln = −4.6292−
abs k
RT 0.999
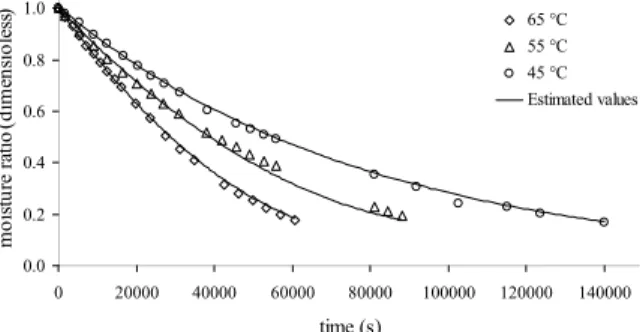
Figure 1 represents corn ears’ drying curves with observed and estimated values obtained through the Logarithmic model at temperatures of 45, 55 and 65°C.
0.0 0.2 0.4 0.6 0.8 1.0
0 20000 40000 60000 80000 100000 120000 140000
time (s)
m
o
istu
re
ra
tio
(di
m
en
si
ol
es
s
) 65 °C
55 °C 45 °C
Estimated values
Figure 1. Observed values versus estimated values through the Logarithmic model for different temperatures.
Kayacier and Singh (2004) reported that activation energy decreases as the moisture content of the product increases. For drying processes, the lower the activation energy is, the greater the water diffusivity of the product will be.
Enthalpy and entropy of activation decreased, while the Gibbs free energy increased with increased temperatures for the range shown in Table 5. An analysis of the equations used to obtain these thermodynamic parameters (equations 17, 18 and 19) allows us to conclude that this behavior is expected. Bayram et al. (2004), studying the variation in physical properties of soybeans during cooking, also observed this trend; however, they obtained positive values for the entropy of activation. Similar values for entropy were reported by Jideani and Mpotokwana (2009), who evaluated the water absorption of Vigna subterranea L. grains.
According to our results, one notices that the water diffusion process for the product during drying responds to sensible heat and requires energy (ΔH*>0) in order to promote changes, which is
usually observed during a drying process. The evaluation of enthalpy values allows an analysis of the energy contribution that is added to the process which is responsible for altering the water diffusion velocity (BAYRAM et al., 2004).
According to Moyano and Zúñiga (2004), ΔS*
measures the order alterations of a system. Therefore, the values decrease can be explained by the fact that when the product is being dehydrated, moisture content decreases and the movement of water molecules become more restricted (there are less available sites). The positive values for Gibbs free energy of activation (ΔG* > 0) mean that the
phenomenon is not spontaneous and actually requires energy from the environment so that the process can occur. Corn ear diffusion coefficient values at the various temperatures are shown in Table 6.
Table 5. Values of thermodynamic parameters at different temperatures for the drying process of corn ears.
Temperature (°C) ΔH(J mol-1) ΔS*(J mol-1 K-1) ΔG*(J mol-1)
45 30,132.90 -317.59 13,1174.58
55 30,049.76 -317.85 13,4351.79
65 29,966.62 -318.10 13,7531.53
Table 6. Corn ears diffusion coefficients for each drying temperature.
Temperature (°C) Effective Diffusion Coefficients (m2 s-1)
45 5.490 x 10⁻¹⁰
55 7.597 x 10⁻¹⁰
65 1.163 x 10⁻⁹
According to Table 6, the corn ears diffusion coefficients increased with increasing temperature, and they were consistent with the results of the drying processes of other agricultural products cited in the literature, which, according to Madamba et al. (1996), presented values with magnitudes ranging from 10-11 to 10-9 m2 s-1. Doymaz and Pala (2003),
observed corn diffusion coefficients ranging from 9.488 x 10⁻¹¹ to 1.768 x 10⁻¹⁰ m2 s-1 at temperatures of
55 and 75°C, and Mohapatra and Rao (2005) obtained diffusion coefficients for wheat grains ranging from 1.2181 x 10⁻¹⁰ to 2.8611 x 10⁻¹⁰ m2 s-1
As the temperature increases, the water viscosity decreases, and since viscosity is a measurement of the fluid’s resistance to flow, variations in this property imply that water diffusion alterations in the capillaries of porous media promote fluid movement inside the product. Another factor that can be attributed to this effective diffusion coefficient variation is that, with temperature increase, the molecular vibration level of water molecules also increases, contributing to higher fluid diffusion in the material.
Conclusion
Based on the obtained values, the Midili and Logarithmic models were adequate in describing drying phenomena of corn ears. However, since the Logarithmic model is simpler, it was selected to describe the drying process of corn ears.
The diffusion coefficients for corn ears are 5.490 x 10⁻¹⁰, 7.597 x 10⁻¹⁰ and 1.163 x 10⁻⁹ m2 s-1 for
temperatures of 45, 55 and 65°C, respectively. The activation energy obtained by the variation of drying constants of the corn ears was 17,644.8 J mol-1 at a temperature range of 45 to
65°C.
Acknowledgements
The authors thank CNPq and Capes for funding, indispensable for accomplishing this study.
References
BABALIS, S. J.; BELESSIOTIS, V. G. Influence of the drying conditions on the drying constants and moisture diffusivity during the thin-layer drying of figs. Journal of Food Engineering, v. 65, n. 3, p. 449 - 458, 2004. BALA, B. K.; WOODS, J. L. Simulation of deep bed malt drying. Journal of Agricultural Engineering Research, v. 30, n. 3, p. 235-244, 1984.
BAYRAM, M.; KAYA, A.; ÖNER, M. D. Changes in properties of soaking water during production of soy-bulgur. Journal of Food Engineering, v. 61, n. 2, p. 221-230, 2004.
BROOKER, D. B.; BAKKER-ARKEMA, F. W.; HALL, C. W. Drying and storage of grains and oilseeds. Westport: The AVI Publishing Company, 1992.
CORRÊA, P. C.; RESENDE, O.; RIBEIRO, D. M. Isotermas de Sorção das espigas de milho: Obtenção e Modelagem. Revista Brasileira de Milho e Sorgo, v. 4, n. 1, p. 126-134, 2005.
CORRÊA, P. C.; RESENDE, O.; MARTINAZZO, A. P.; GONELI, A. L. D. G.; BOTELHO, F. M. Modelagem matemática para a descrição do processo de secagem do feijão (Phaseolus vulgaris L.) em camadas delgadas. Engenharia Agrícola, v. 27, n. 2, p. 501-510, 2007.
DOYMAZ, I.; PALA, M. The thin-layer drying characteristics of corn. Journal of Food Engineering, v. 60, n. 2, p. 173-179, 2003.
GELY, M. C; GINER, S. A. Diffusion coefficient relationships during drying of soya bean cultivars. Biosystems Engineering, v. 96, n. 2, p. 213-222, 2007. GELY, M. C.; SANTALLA, E. M. Moisture diffusivity in quinoa (Chenopodium quinoa Willd.) seeds: Effect of air temperature and initial moisture content of seeds. Journal of Food Engineering, v. 78, n. 3, p. 1029-1033, 2007. GOYAL, R. K.; KINGSLY, A. R. P.; MANIKANTAN, M. R.; ILYAS, S. M. Mathematical modelling of thin layer drying kinetics of plum in a tunnel dryer. Journal of Food Engineering, v. 79, n. 1, p. 176-180, 2007.
HALL, C.W. Drying and storage of agricultural crops. Westport: AVI, 1980.
IGUAZ, A.; SAN MARTIN, M. B.; MATÉ, J. I.; FERNANDEZ, T.; VÍRSEDA, P. Modelling effective moisture diffusivity of rough rice (Lido cultivar) at low drying temperatures. Journal of Food Engineering, v. 59, n. 2-3, p. 253-258, 2003.
JIDEANI, V. A.; MPOTOKWANA, S. M.; Modeling of water absorption of Botswana bambara varieties using Peleg’s equation. Journal of Food Engineering, v. 92, n. 2, p. 182-188, 2009.
KAYACIER, A.; SINGH, R. K. Application of effective diffusivity approach for the moisture content prediction of tortilla chips during baking. Swiss Society of food Science and Technology, v. 37, n. 2, p. 275-281, 2004. MADAMBA, P. S.; DRISCOLL, R. H.; BUCKLE, K. A. Thin-layer drying characteristics of garlic slices. Journal of Food Engineering, v. 29. n. 1, p. 75-97, 1996. MASKAN, M. Effect of processing on hydration kinetics of three wheat products of the same variety. Journal of Food Engineering, v. 52, n. 4, p. 337-341, 2002.
MAYOR, L.; SERENO, A. M. Modelling shrinkage during convective drying of food materials: a review. Journal of Food Engineering, v. 61, n. 3, p. 373-386, 2004.
MIDILLI, A.; KUCUK, H. Mathematical modeling of thin layer drying of pistachio by using solar energy. Energy Conversion and Management, v. 44, n. 7, p. 1111-1122, 2003.
MIDILLI, A.; KUCUK, H.; YAPAR, Z. A new model for single-layer drying. Drying Technology, v. 20, n. 7, p. 1503-1513, 2002.
MOHAPATRA, D.; RAO, P. S. A thin layer drying model of parboiled wheat. Journal of Food Engineering, v. 66, n. 4, p. 513-518, 2005.
MOYANO, P. C.; ZÚÑIGA, R. Enthalpy-entropy compensation for browning of potato strips during deep-fat frying. Journal of Food Engineering, v. 63, n. 1, p. 57-62, 2004.
PELEG, M. An empirical model for description of moisture sorption curves. Journal of Food Science, v. 53, n. 4, p. 1216-1219, 1988.
Acta Scientiarum. Agronomy Maringá, v. 33, n. 4, p. 575-581, 2011 volumétrica na difusão líquida durante o processo de
secagem do arroz em casca. Revista Brasileira de Armazenamento, v. 30, n. 2, p. 163-171, 2005.
VERAVERBEKE, E. A.; VERBOVEN, P.; SCHEERLINCK, N.; HOANG, M., L.; NICOLA, B. M. Determination of the diffusion coefficient of tissue, cuticle, cutin and wax of apple. Journal of Food Engineering, v. 58, n. 3, p. 285-294, 2003.
ZOGZAS, N. P.; MAROULIS, Z. B.; MARINOS-KOURIS, D. Moisture diffusivity data compilation in
foodstuffs. Drying Technology, v. 14, n. 10, p. 2225-2253, 1996.
Received on May 15, 2009. Accepted on October 1, 2009.