Bragantia, Campinas, v. 77, n. 4, p.536-545, 2018
536
ABSTRACT: The aim of the present study was to investigate relations among ten traits in super-sweet corn genotypes assessed by means of simple correlation, path and canonical variable analyses, as well as to investigate the relative importance of such traits to the super-sweet corn breeding program developed at Darcy Ribeiro Northern Fluminense State University in order to develop strategies able to improve the efficiency in the selection of superior genotypes. Thus, trials comprising 3 × 6 partial diallel of super-sweet (sh2) corn were carried out, according to a randomized block design (RBD) with four repetitions, in two different environments located in Northern Rio de Janeiro State, Brazil (Itaocara and Campos dos Goytacazes counties). The correlation study showed that traits
PLANT BREEDING - Article
Development and selection of super-sweet corn
genotypes (
sh2
) through multivariate approaches
Gabriel Moreno Bernardo Gonçalves*, Messias Gonzaga Pereira, José Arantes Ferreira Júnior, Ismael Albino Schwantes, Nayara Norrene Lacerda Durães, Jocarla Ambrosim Crevelari, Antonio Teixeira do Amaral Junior
Universidade Estadual do Norte Fluminense Darcy Ribeiro - Laboratório de Genética e Melhoramento Vegetal - Campos dos Goytacazes (RJ), Brazil.
*Corresponding author: [email protected] Received: Oct. 3, 2017 – Accepted: Jan. 2, 2018
such as ear diameter and useful ear length contributed the most to increase ear yield (without husk); the variable ear diameter stood out for having stronger direct effect on ear yield, as well as for presenting high heritability (0.95). The trait number of grains per ear row contributed the most to the variation between hybrids, whereas the trait useful ear length contributed the least. The canonical variables showed that the genetic backgrounds of
sh2-gene donor populations had effect on recurrent populations,
even after five backcrossing cycles, thus resulting in the formation of two divergent groups.
537
Bragantia, Campinas, v. 77, n. 4, p.536-545, 2018
Genetic improvement of super-sweet corn
INTRODUCTION
Corn (Zea mays L.) is one of the most widely cultivated
species in the world. It accounts for 38.8% of the total cereal, legume and oilseed production in Brazil and its annual grain production reaches 82.7 million tons (IBGE 2016). In addition, it has enormous potential for sweet corn production; however, such potential is yet to be explored. It can be used as canned or frozen cobs or grains, as well as dehydrated or as baby corn, depending on the harvest point (Tracy 2001; Melo et al. 2014).
Sweet corn is among the most profitable vegetables (ABCSEM 2014); however, nowadays, it has limited productivity due to low supply of quality cultivars to several regions in the country. The main cultivar traded in Brazil is Tropical Plus (sh2), which was registered in 2005 by the
multinational company Syngenta and is recommended for cultivation from Northern to Southern Brazil (MAPA 2016).
The super-sweet group shows total sugar content higher than that of the sweet group, and up to 15 times higher than field corn grains (Tosello 1987; Azanza et al. 1994; Tracy 2001). In addition, according to Goldman and Tracy (1994), the protein content in sh2-gene carrier corn species is up
to 30% higher than that found su1-carriers, which have the
same genetic background.
The sweet corn breeding may be summarized in two action forms, namely: by subjecting a sweet germplasm to a routine breeding program (Parentoni et al. 1990) or by introducing the sweet (monogenic recessive) trait of any genetic source in a normal-endosperm germplasm developed through classical breeding methods (Santos et al. 2014). However, the second option (introducing the gene through backcrossing) would require new selection stages because, unlike field corn whose main product lies on grains, the commercial product in sweet corn is the whole cob (Tracy 2001). Therefore, it requires special attention during breeding programs.
It is necessary conducting studies about direct and indirect relations between yield and several plant and fruit traits (Entringer et al. 2014; Cabral et al. 2016), as well as about the relative importance of each trait to genotype variability, in order to help increasing the efficiency of breeding programs. For instance, the trait ear yield without husk (EY) has high direct effect on fresh grain yield in sweet corn crops (Ilker 2011). Thus, EY is a more practical measure that may reflect the interest of the industry.
Accordingly, the aim of the present study was to investigate the relationship between traits, as estimated through simple correlation and path analyses, as well as to investigate the relative importance of such traits to the super-sweet corn breeding program developed at Darcy Ribeiro Northern Fluminense State University.
MATERIALS AND METHODS
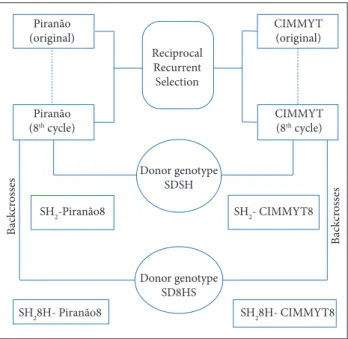
Based on 10 × 10 partial diallel trials conducted in two different environments, nine inbred lines were selected, according to their general and specific combining ability, to be used in a more advanced stage of the Super-Sweet Corn Breeding Program developed at Darcy Ribeiro Northern Fluminense State University. These nine inbred lines were used to perform a new 3 × 6 partial diallel trial, which resulted in 18 single-cross hybrids, in total. The herein used lines derived from base-genotype populations such as CIMMYT8 and Piranão8 during the 8th recurrent reciprocal selection cycle. Both populations were backcrossed five times with two shrunken-2 (sh2) mutant gene populations (SH2
and SH28HS), and it resulted in the following super-sweet populations: SH2-CIMMYT8 (CSH), SH2-8HS-CIMMYT (C8HS), SH2-Piranão (PSH) and SH2-8HS-Piranão (P8HS) (Fig. 1).
Figure 1. Scheme for obtaining populations SH2-CIMMYT8, SH2-8HS-CIMMYT8, SH2-Piranão8, and SH2-8HS-Piranão8, through eight cycles of reciprocal recurrent selection and backcrossing with the SDSH and SH8HS super-sweet corn genotypes.
Donor genotype SDSH Reciprocal Recurrent Selection
CIMMYT (original)
CIMMYT (8th cycle) Piranão
(original)
Piranão (8th cycle)
SH2-Piranão8 SH2- CIMMYT8
SH28H- CIMMYT8 SH28H- Piranão8
B
ac
kcr
os
ses
B
ac
kcr
os
ses
Bragantia, Campinas, v. 77, n. 4, p.536-545, 2018
538
G. M. B. Gonçalves et al.
Three out of the nine inbred lines derived from the CSH population, three came from the PSH population and three from the P8HS one. Nine single-cross hybrids were formed through the inbred line cross CSH × PSH (SC1, SC2, SC3, SC7, SC8, SC9, SC13, SC14, and SC15) and nine single-cross hybrids derived from the inbred line cross CSH × P8HS (SC4, SC5, SC6, SC10, SC11, SC12, SC16, SC17, and SC18). A super-sweet corn (sh2) control from Syngenta (Tropical
Plus) was used as reference.
Two experiments were carried out in complete randomized blocks, with four repetitions; they comprised single 3.00 m-row plots spaced 0.90 m between rows and 0.30 m between plants. The experiments were implemented in the counties Campos dos Goytacazes, Rio de Janeiro, Brazil (Latitude 21°24’48” S; Longitude 41°44’48” W; altitude 14 m), and Itaocara, Rio de Janeiro, Brazil (Latitude 21°40’09” S; Longitude 42°04’34” W; altitude 60 m), during the 2016/2017 crop year. Harvesting was performed 22 days after silking, when sh2-gene carrier
genotypes presented the highest fresh weight and volume (Guan et al. 2013), as well as better taste and texture (Camilo et al. 2015).
The traits assessed in the experiments were: ear yield (without husk) (EY); grain filling, using scores from 1 to 10, whereas 1 is for cobs with few grains and 10 for cobs filled with grains (GF); ear diameter (ED); number of rows per ear (RE); number of grains per ear row (GR); grain length × thickness product (LT); useful ear length (EL); ear insertion height (EH); plant height (PH); and silking days (SD).
The following mathematical models were used to calculate: (Eq. 1) phenotypic correlation, (Eq. 2) genotypic correlation, and (Eq. 3) environmental correlation estimates based on variance and joint covariance analyses:
where: QMe corresponds to the mean square of the error; r is the number of repetitions; l is the number of locations;
and q is the tabulated value of the total studentized range (least significant difference at p < 0.05);
σ²f = QMc/r.l (phenotypic variance) (6)
фg = QMc – QMe/r.l (genotypic quadratic component) (7)
where: QMc corresponds to the mean square of crosses;
VCe (%) = 100 × √QMe/μ (experimental variation coefficient) (8)
VCg (%) = 100 × √фg/μ (genotypic variation coefficient) (9)
VI = VCg/VCe (variation index) (10)
H² = фg/σ²f (genotypic determination coefficient) (11)
The path analysis was conducted by solving the equation X’Xβ = X’Y, wherein X’X is the non-singular correlation matrix between the basic variable and β, which is the column vector of the path analysis coefficient; whereas X’Y is the column vector of the correlation between the explanatory variables and the dependent one. The correlation matrix was based on genotypic correlations; it considered the trait EY as basic variable, and the other variables (GF, ED, RE, GR, LT, EL, EH, PH, and SD) as explanatory.
Multivariate analyses were conducted by using canonical variables to assess genetic divergence between hybrids, whereas Mahalanobis-D2 was used as dissimilarity measure to assess the relative importance of the traits. Statistical analyses were performed in the GENES software (Cruz 2013).
RESULTS
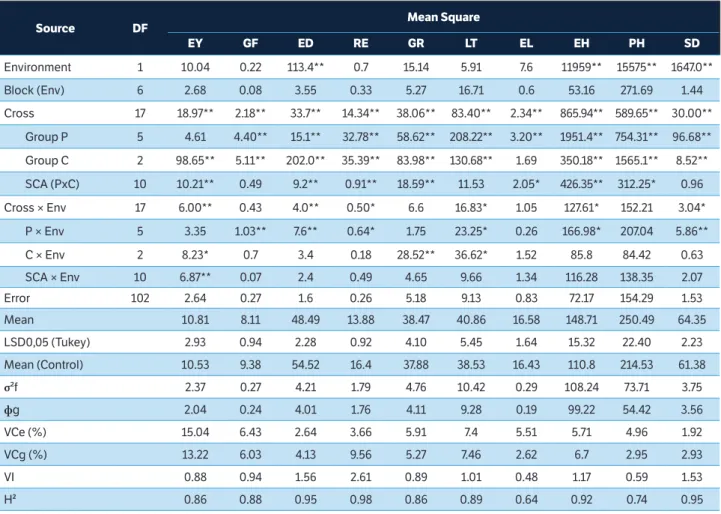
The analysis of variance (Table 1) showed significant crossbreeding differences (p < 0.01) in all the studied traits and it indicated variability in the investigated genotypes. All the variables in the Piranão group showed significant general combining ability (GCA), except for ear yield (EY), whereas useful ear length (EL) was the only variable that did not show significant GCA in the CIMMYT group. All the ×
𝑟𝑟! = ()#*"#$%.)#*%,' '
𝑟𝑟, (()#$%("#$...)#0%,'%. "#0).( )#$%,''. )#0) ')
𝑟𝑟2 ()#0"#0%.)#0%,' '
3
45∑ 𝑌𝑌45 45 µ
%𝑄𝑄𝑄𝑄𝑄𝑄 𝑟𝑟.𝑙𝑙+
×
𝑟𝑟! ()#*"#$%,'
%.)#*'
𝑟𝑟, = (()#$%("#$...)#0%,'%. "#0).( )#$%,''. )#0) ')
𝑟𝑟2 ()#0"#0%.)#0%,' '
3
45∑ 𝑌𝑌45 45 µ
%𝑄𝑄𝑄𝑄𝑄𝑄 𝑟𝑟.𝑙𝑙+
σ² 𝑄𝑄𝑄𝑄𝑄𝑄+𝑟𝑟. 𝑙𝑙
×
𝑟𝑟! ()#*"#$%.)#*%,' '
𝑟𝑟, (()#$%("#$...)#0%,'%. "#0).( )#$%,''. )#0) ')
𝑟𝑟2= ()#0"#0%.)#0%,' '
3
45∑ 𝑌𝑌45 45 µ
%𝑄𝑄𝑄𝑄𝑄𝑄 𝑟𝑟.𝑙𝑙+
σ² 𝑄𝑄𝑄𝑄𝑄𝑄+𝑟𝑟. 𝑙𝑙
×
𝑟𝑟! ()#*"#$%.)#*%,' '
𝑟𝑟, (()#$%("#$...)#0%,'%. "#0).( )#$%,''. )#0) ')
𝑟𝑟2 ()#0"#0%.)#0%,' '
3
45∑ 𝑌𝑌45 45 = µ (general mean)
%𝑄𝑄𝑄𝑄𝑄𝑄 𝑟𝑟.𝑙𝑙+
σ² 𝑄𝑄𝑄𝑄𝑄𝑄+𝑟𝑟. 𝑙𝑙
The genetic statistical parameters were set through the estimators (Eqs. 4 to 11):
(1)
(2)
(3)
(4)
𝑟𝑟! ()#*"#$%.)#*%,' '
𝑟𝑟, (()#$%("#$...)#0%,'%. "#0).( )#$%,''). )#0')
𝑟𝑟2 ()#0"#0%.)#0%,' '
3
45∑ 𝑌𝑌45 45 µ
LSD = q.%𝑄𝑄𝑄𝑄𝑄𝑄 𝑟𝑟.𝑙𝑙+
σ² 𝑄𝑄𝑄𝑄𝑄𝑄+𝑟𝑟. 𝑙𝑙
539
Bragantia, Campinas, v. 77, n. 4, p.536-545, 2018
Genetic improvement of super-sweet corn
variables showed significant specific combining ability (SCA), except for grain filling (GF) and grain length × thickness product (LT). EL and plant height (PH) were the only variables among the ten herein assessed ones that did not show interaction with the environment in any of the effects.
The mean EY of the hybrids exceeded that of the control in absolute values, although without significance. However, when 18 genotypes, on average, show such a trend, it puts in evidence the genetic potential of the crossbreeding and allows identifying superior genotypes. The mean values of traits such as number of grains per ear row (GR), LT and EL in the hybrids were not significantly different from the mean values found in the control. As for the other traits, the control showed better GF, higher ear diameter (ED) and number of rows per ear (RE), and lower ear insertion height (EH), PH and silking days (SD) than the mean of the hybrids.
VCe values ranged from 1.92% (SD) to 15.04% (EY), and it evidenced the reliability of the herein presented results. As for the other traits, VCe estimates were below 7.40%; ED (2.64), RE (3.66) and SD (1.92) showed the lowest values.
The genetic variation coefficient (VCg) ranged from 2.62 (EL) to 13.22 (EY). The highest estimates were found in EY, which was followed by RE and LT; as for the other traits – EL (2.62), PH (2.95) and SD (2.93) – the likelihood of having progress through selection was reduced due to low VCg estimates.
RE, ED and SD presented the highest variation index (VI) values (2.61, 1.56 and 1.53, respectively). Only RE showed high VCg values among the aforementioned traits, whereas ED and SD presented low VCe, fact that led them to show the highest variation indices. EL and PH presented the lowest VIs due to the low VCg values they presented.
Table 1. Estimate of the mean squares, averages and genetic parameters of ten traits evaluated in partial diallel (3 × 6) of super-sweet corn in two environments (Itaocara-RJ and Campos dos Goytacazes-RJ), 2016/2017 crop year.
Source DF Mean Square
EY GF ED RE GR LT EL EH PH SD
Environment 1 10.04 0.22 113.4** 0.7 15.14 5.91 7.6 11959** 15575** 1647.0**
Block (Env) 6 2.68 0.08 3.55 0.33 5.27 16.71 0.6 53.16 271.69 1.44
Cross 17 18.97** 2.18** 33.7** 14.34** 38.06** 83.40** 2.34** 865.94** 589.65** 30.00**
Group P 5 4.61 4.40** 15.1** 32.78** 58.62** 208.22** 3.20** 1951.4** 754.31** 96.68**
Group C 2 98.65** 5.11** 202.0** 35.39** 83.98** 130.68** 1.69 350.18** 1565.1** 8.52**
SCA (PxC) 10 10.21** 0.49 9.2** 0.91** 18.59** 11.53 2.05* 426.35** 312.25* 0.96
Cross × Env 17 6.00** 0.43 4.0** 0.50* 6.6 16.83* 1.05 127.61* 152.21 3.04*
P × Env 5 3.35 1.03** 7.6** 0.64* 1.75 23.25* 0.26 166.98* 207.04 5.86**
C × Env 2 8.23* 0.7 3.4 0.18 28.52** 36.62* 1.52 85.8 84.42 0.63
SCA × Env 10 6.87** 0.07 2.4 0.49 4.65 9.66 1.34 116.28 138.35 2.07
Error 102 2.64 0.27 1.6 0.26 5.18 9.13 0.83 72.17 154.29 1.53
Mean 10.81 8.11 48.49 13.88 38.47 40.86 16.58 148.71 250.49 64.35
LSD0,05 (Tukey) 2.93 0.94 2.28 0.92 4.10 5.45 1.64 15.32 22.40 2.23
Mean (Control) 10.53 9.38 54.52 16.4 37.88 38.53 16.43 110.8 214.53 61.38
σ²f 2.37 0.27 4.21 1.79 4.76 10.42 0.29 108.24 73.71 3.75
фg 2.04 0.24 4.01 1.76 4.11 9.28 0.19 99.22 54.42 3.56
VCe (%) 15.04 6.43 2.64 3.66 5.91 7.4 5.51 5.71 4.96 1.92
VCg (%) 13.22 6.03 4.13 9.56 5.27 7.46 2.62 6.7 2.95 2.93
VI 0.88 0.94 1.56 2.61 0.89 1.01 0.48 1.17 0.59 1.53
H² 0.86 0.88 0.95 0.98 0.86 0.89 0.64 0.92 0.74 0.95
EY = ear yield (without husk) (t∙ha–1); GF = grain filling (score); ED = ear diameter (mm); RE = number of rows per ear; GR = number of grains per ear row;
Bragantia, Campinas, v. 77, n. 4, p.536-545, 2018
540
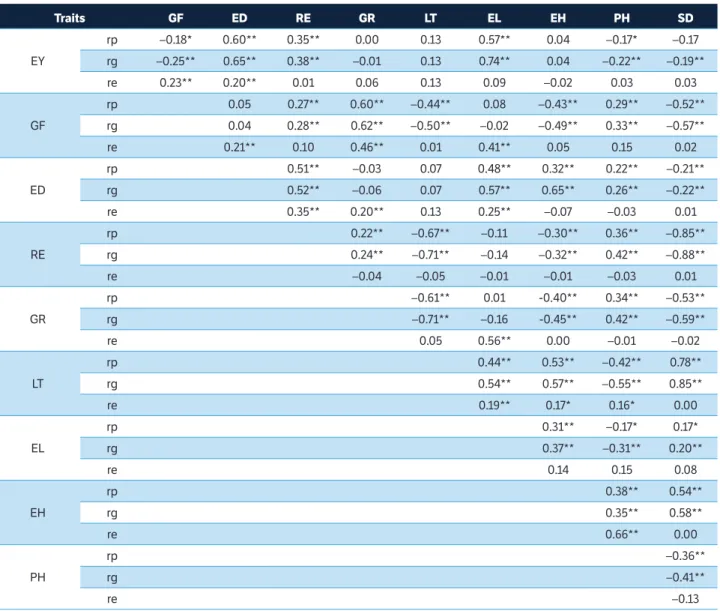
Overall, the herein assessed traits showed high H2 estimates; it is worth highlighting that RE, ED and SD showed values above 0.95; whereas ED, GF, GR, LT, and EH showed estimates above 0.86. Table 2 shows the phenotypic, genetic and environmental correlation estimates of the traits investigated in the current study. Trait pairs EY and ED (0.60), ED and GR (0.60), and LT and SD (0.78) presented the highest phenotypic correlation values. On the other hand, trait pairs RE and SD (–0.85), RE and LT (–0.67), and ED and SD (–0.52) showed the highest negative phenotypic correlations. Trait pairs EY and EL (0.74), ED and GR (0.62), and ED and EH (0.65) showed the highest positive genetic correlations. The genotypic correlations were predominantly higher than the phenotypic ones showing the
same signal, fact that indicated less environmental influence on trait expression. EY showed positive and significant genetic correlation with three other explanatory variables, namely: RE, ED, and EL (0.38, 0.65, and 0.74, respectively); on the other hand, it was negatively correlated with three other traits and showed magnitudes –0.19 (SD and EY) and –0.25 (ED and EY). GR, LT and EH presented non-significant genotypic, phenotypic and environmental correlations with the basic variable EY.
Most trait pairs showed low environmental correlation estimates, since the highest values were 0.66 (EH and PH) and 0.56 (GR and EL). It is worth emphasizing that low-magnitude environmental correlations were found when the correlations between EY and the other traits
Table 2. Estimates of the coefficients of genotypic, phenotypic and environmental correlation among ten traits evaluated in partial diallel (3 × 6) of super-sweet corn in two environments (Itaocara-RJ and Campos dos Goytacazes-RJ), 2016/2017 crop year.
Traits GF ED RE GR LT EL EH PH SD
EY
rp –0.18* 0.60** 0.35** 0.00 0.13 0.57** 0.04 –0.17* –0.17
rg –0.25** 0.65** 0.38** –0.01 0.13 0.74** 0.04 –0.22** –0.19**
re 0.23** 0.20** 0.01 0.06 0.13 0.09 –0.02 0.03 0.03
GF
rp 0.05 0.27** 0.60** –0.44** 0.08 –0.43** 0.29** –0.52**
rg 0.04 0.28** 0.62** –0.50** –0.02 –0.49** 0.33** –0.57**
re 0.21** 0.10 0.46** 0.01 0.41** 0.05 0.15 0.02
ED
rp 0.51** –0.03 0.07 0.48** 0.32** 0.22** –0.21**
rg 0.52** –0.06 0.07 0.57** 0.65** 0.26** –0.22**
re 0.35** 0.20** 0.13 0.25** –0.07 –0.03 0.01
RE
rp 0.22** –0.67** –0.11 –0.30** 0.36** –0.85**
rg 0.24** –0.71** –0.14 –0.32** 0.42** –0.88**
re –0.04 –0.05 –0.01 –0.01 –0.03 0.01
GR
rp –0.61** 0.01 -0.40** 0.34** –0.53**
rg –0.71** –0.16 -0.45** 0.42** –0.59**
re 0.05 0.56** 0.00 –0.01 –0.02
LT
rp 0.44** 0.53** –0.42** 0.78**
rg 0.54** 0.57** –0.55** 0.85**
re 0.19** 0.17* 0.16* 0.00
EL
rp 0.31** –0.17* 0.17*
rg 0.37** –0.31** 0.20**
re 0.14 0.15 0.08
EH
rp 0.38** 0.54**
rg 0.35** 0.58**
re 0.66** 0.00
PH
rp –0.36**
rg –0.41**
re –0.13
rp = phenotypic correlation; rg = genotypic correlation; re = environmental correlation; degrees of freedom = 142; t0,01 = 2,24; and t0,05 = 1,96; EY = ear yield (without husk) (t.ha–1); GF = grain filling (score); ED = ear diameter (mm); RE = number of rows per ear; GR = number of grains per ear row; LT = grain length ×
541
Bragantia, Campinas, v. 77, n. 4, p.536-545, 2018
Genetic improvement of super-sweet corn
were taken into consideration; environmental correlations values ranged from 0.01 to 0.23 and most of them were not significant.
The multicollinearity diagnosis applied to the genetic correlation matrix showed weak collinearity (21.47); therefore, it was not necessary transforming data to improve
relations between variables or excluding variables to conduct the path analysis. The variables used in the analysis were able to explain 87.46% (R2) of the variation in EY.
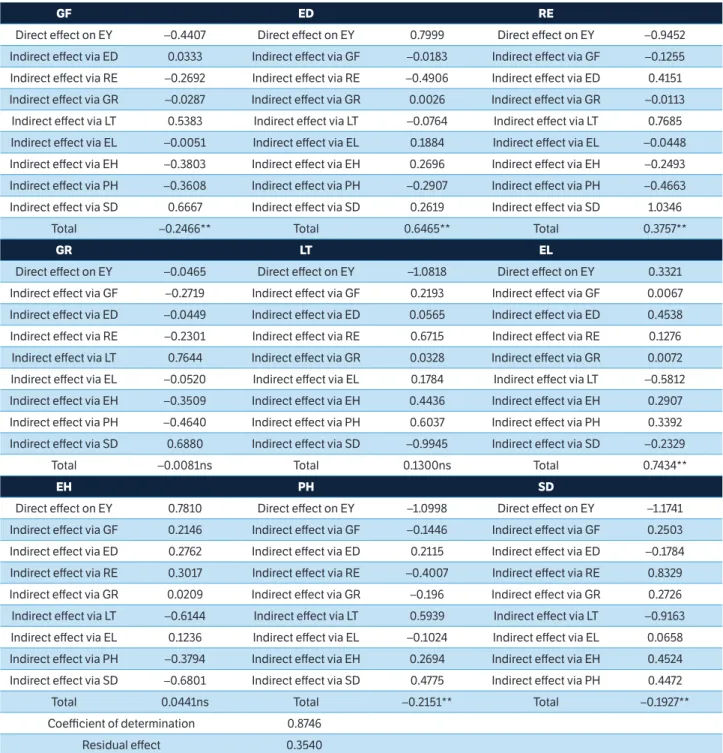
According to the path analysis (Table 3), ED and EL had high direct effects on the basic variable EY, and showed moderate and significant total correlation.
Table 3. Decomposition of effects of genotypic correlation coefficient in path analysis of nine explanatory traits of the basic trait ear yield (without husk), assessed in 18 single-cross hybrids diallelics of super-sweet corn.
GF ED RE
Direct effect on EY –0.4407 Direct effect on EY 0.7999 Direct effect on EY –0.9452
Indirect effect via ED 0.0333 Indirect effect via GF –0.0183 Indirect effect via GF –0.1255
Indirect effect via RE –0.2692 Indirect effect via RE –0.4906 Indirect effect via ED 0.4151
Indirect effect via GR –0.0287 Indirect effect via GR 0.0026 Indirect effect via GR –0.0113
Indirect effect via LT 0.5383 Indirect effect via LT –0.0764 Indirect effect via LT 0.7685
Indirect effect via EL –0.0051 Indirect effect via EL 0.1884 Indirect effect via EL –0.0448
Indirect effect via EH –0.3803 Indirect effect via EH 0.2696 Indirect effect via EH –0.2493
Indirect effect via PH –0.3608 Indirect effect via PH –0.2907 Indirect effect via PH –0.4663
Indirect effect via SD 0.6667 Indirect effect via SD 0.2619 Indirect effect via SD 1.0346
Total –0.2466** Total 0.6465** Total 0.3757**
GR LT EL
Direct effect on EY –0.0465 Direct effect on EY –1.0818 Direct effect on EY 0.3321
Indirect effect via GF –0.2719 Indirect effect via GF 0.2193 Indirect effect via GF 0.0067
Indirect effect via ED –0.0449 Indirect effect via ED 0.0565 Indirect effect via ED 0.4538
Indirect effect via RE –0.2301 Indirect effect via RE 0.6715 Indirect effect via RE 0.1276
Indirect effect via LT 0.7644 Indirect effect via GR 0.0328 Indirect effect via GR 0.0072
Indirect effect via EL –0.0520 Indirect effect via EL 0.1784 Indirect effect via LT –0.5812
Indirect effect via EH –0.3509 Indirect effect via EH 0.4436 Indirect effect via EH 0.2907
Indirect effect via PH –0.4640 Indirect effect via PH 0.6037 Indirect effect via PH 0.3392
Indirect effect via SD 0.6880 Indirect effect via SD –0.9945 Indirect effect via SD –0.2329
Total –0.0081ns Total 0.1300ns Total 0.7434**
EH PH SD
Direct effect on EY 0.7810 Direct effect on EY –1.0998 Direct effect on EY –1.1741
Indirect effect via GF 0.2146 Indirect effect via GF –0.1446 Indirect effect via GF 0.2503
Indirect effect via ED 0.2762 Indirect effect via ED 0.2115 Indirect effect via ED –0.1784
Indirect effect via RE 0.3017 Indirect effect via RE –0.4007 Indirect effect via RE 0.8329
Indirect effect via GR 0.0209 Indirect effect via GR –0.196 Indirect effect via GR 0.2726
Indirect effect via LT –0.6144 Indirect effect via LT 0.5939 Indirect effect via LT –0.9163
Indirect effect via EL 0.1236 Indirect effect via EL –0.1024 Indirect effect via EL 0.0658
Indirect effect via PH –0.3794 Indirect effect via EH 0.2694 Indirect effect via EH 0.4524
Indirect effect via SD –0.6801 Indirect effect via SD 0.4775 Indirect effect via PH 0.4472
Total 0.0441ns Total –0.2151** Total –0.1927**
Coefficient of determination 0.8746
Residual effect 0.3540
Bragantia, Campinas, v. 77, n. 4, p.536-545, 2018
542
RE, PH and SD presented high direct negative effects on the basic variable EY. However, they showed weak total correlation with the basic variable, as well as EH, which had high positive direct effect on EY.
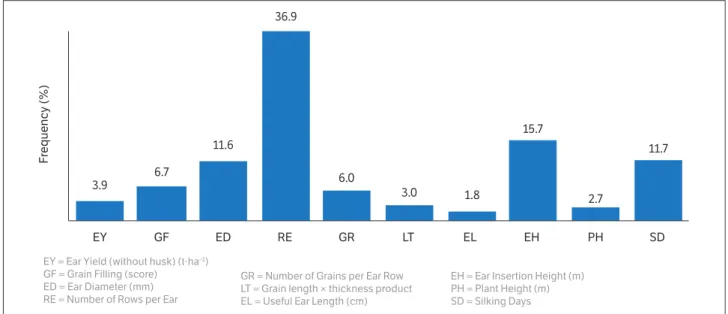
The relative importance of the ten herein investigated variables to the genetic divergence of hybrids was measured, based on the Mahalanobis-D2 estimate, according to the method by Singh (1981). RE results contributed to most of the variations (36.9%), whereas EL and PH presented the lowest contributions (1.8% and 2.7%, respectively), thus indicating the possibility of discarding these variables in divergence studies comprising these genotypes (Fig. 2).
The canonical variable dispersion chart explained 73.23% of the variation in the sum of canonical variables (CV) 1 and 2. As the most explanatory dispersion lies on CV1, it is possible seeing the grouping of hybrids derived from lines belonging to the PHS population (SC1, SC2, SC3, SC7, SC8, SC9, SC13, SC14 and SC15); these hybrids are separated from the those derived from lines belonging to the P8HS population (SC4, SC5, SC6, SC10, SC11, SC12, SC16, SC17 and SC18); the CSH lines are able to discriminate the two groups. The Tropical Plus control presented great similarity with hybrids derived from P8HS × CSH lines (Fig. 3).
Figure 3. Graphical dispersion of the 18 partial diallel hybrids (3 × 6) of super-sweet corn and control (commercial cultivar Tropical Plus), according to ten canonical variables.
Figure 2. Relative contribution of ten traits, assessed in 18 single-cross hybrids diallelics of super-sweet corn, based on Mahalanobis- D2.
Control
CV1 (55.44%)
CV2 (
1
7.
79%)
SC10
SC11 SC4
SC12 SC6
SC8 SC9
SC2 SC7
SC14 SC1 SC13
–13 19 20.2 21.4 22.6 23.8 25 26.2 27.4 28.6 29.8 31
–11.8 –10.6 –9.4 –8.2 –7 –5.8 –4.6 –3.4 –2.2 –1
SC15 SC13
SC5
SC18 SC16
SC17
F
requency (%)
3.9
EY GF ED RE GR LT EL EH PH SD
EY = Ear Yield (without husk) (t·ha–1)
GF = Grain Filling (score) ED = Ear Diameter (mm) RE = Number of Rows per Ear
6.7
11.6
36.9
6.0
3.0 1.8
15.7
2.7
11.7
EH = Ear Insertion Height (m) PH = Plant Height (m) SD = Silking Days GR = Number of Grains per Ear Row
543
Bragantia, Campinas, v. 77, n. 4, p.536-545, 2018
Genetic improvement of super-sweet corn
DISCUSSION
The mean EY estimate was higher than that found by Souza et al. (2013), Oliboni et al. (2013), and Oliveira Jr. et al. (2006). This information is very important because it allows highlighting the potential of the tested genotypes and makes it possible using them in the final tests of the breeding program in question.
There was good control of the conditions applied to the present study due to the low experimental variation coefficients herein observed. EY recorded the highest VCe, fact that was already expected due to the polygenic nature of such trait; this result was corroborated by other studies (Oliveira Jr. et al. 2006; Souza et al. 2013; Oliboni et al. 2013).
Correlations may have genetic or environmental causes; genetic and phenotypic correlations are the most important ones in plant breeding (Hallauer et al. 2010). Thus, three aspects must be considered at the time to interpret correlations, namely: magnitude, direction, and significance. Positive correlation coefficient estimates indicate that a given variable tends to increase when another one increases; negative correlations indicate that a given variable tends to increase when the other one decreases (Nogueira et al. 2012). According to the results in the current study, the high complexity between production components contribute to EY and make the selection of super-sweet corn genotypes complex. Thus, it becomes evident the need to unfold correlations in direct and indirect effects in order to assess the degree of importance of each explanatory variable in comparison to the main or basic variable (Santos et al. 2014).
Results showed that variables such as ED and EL significantly contributed to EY increase (Table 3). In addition, ED stood out for showing high heritability (0.95). Therefore, it is possible inferring that ED can be used in indirect selection processes aimed at increasing EY. According to Vencovsky and Barriga (1992), it should be taken into consideration that when the correlation coefficient and the direct effect show similar magnitude and sign, this direct correlation explains the true association between variables. It shows that, apparently, this variable is more independent than the others.
EH and LT presented high direct positive and negative effects, respectively; however, the correlation was not significant due to indirect effects. Accordingly, Vencovsky
and Barriga (1992) suggested using restricted selection to eliminate undesirable indirect effects and to allow the advantage that the existing direct effect is able to provide. RE presented positive and significant correlation coefficient in the path analysis and such coefficient was higher than that of the residual variable; however, the direct effect of RE was highly negative. According to Lorentz et al. (2006), when the linear correlation coefficient is positive but the direct effect is negative or negligible, the correlation is caused by the indirect effects.
GF, PH and SD presented negative direct effects that, although of small magnitude, contributed to EY reduction. Thus, it is possible inferring that plants showing smaller height and higher flowering precocity contribute to EY increase. However, due to the low magnitude of the total correlation, it is recommended restricting the use of these variables in the selection index.
Although the results of the correlation and path analyses indicated that ED and EL were the main variables influencing EY, the results of the path analysis indicated which trait presented the highest direct and indirect effects, fact that assures greater security at the time to choose the traits that should be improved in order to reach the final goal (Montardo et al. 2003), in the present case, a higher EY.
Since EL presented low relative importance, low direct effect on the base variable, as well as lower VI, H2 and VCg, one could suggest ignoring it in the analysis. On the other hand, since EL is important to the ear quality assessment and since it is not replaceable, it must not be ignored. Similarly, since PH is considered of significant importance in corn breeding – whether it is the sweet, field or popcorn type (Kleinpaul et al. 2014; Cabral et al. 2016) – it should not be ignored in the assessments.
The canonical variables presented groupings that reflected the genetic background of sh2-gene donor
Bragantia, Campinas, v. 77, n. 4, p.536-545, 2018
544
were selected in a truncated way, based on the general and specific combining abilities of the EY, which reduced its variability.
CONCLUSION
Ear diameter was the variable that showed the greatest explanatory power for ear yield, as well as sufficient variability for the selection process.
Plants showing smaller height and higher flowering precocity contributed to ear yield increase due to the use of selection indices.
The genetic backgrounds of the SDSH and SDS8HS donor populations strongly influenced the recurrent population, even after five backcrossing cycles.
ORCID IDS
G. M. B. Gonçalves
https://orcid.org/0000-0003-0103-7553
M. G. Pereira
https://orcid.org/0000-0002-3463-3768
J. A. Ferreira Júnior
https://orcid.org/0000-0002-9178-3930
I. A. Schwantes
https://orcid.org/0000-0002-9485-8467
N. N. L. Durães
https://orcid.org/0000-0003-3112-4543
J. A. Crevelari
https://orcid.org/0000-0001-9466-2803
A. T. Amaral Junior
https://orcid.org/0000-0003-4831-7878
ABCSEM [Associação Brasileira do Comércio de Sementes e Mudas] (2014). 2º Levantamento de Dados Socioeconômicos da Cadeia Produtiva de Hortaliças no Brasil (Ano base 2012). ABCSEM; [accessed 2017 June 20]. http://www.abcsem.com.br/ imagens_noticias/Apresenta%C3%A7%C3%A3o%20completa%20 dos%20dados%20da%20cadeia%20produtiva%20de%20 hortali%C3%A7as%20-%2029MAIO2014.pdf
Azanza, F., Juvik, J. A. and Klein, B. P. (1994). Relationships between sensory quality atributes and kernel chemical composition of fresh-frozen sweet corn. Journal of Food Quality, 17, 159-172. http://dx.doi. org/ 10.1111/j.1745-4557.1994.tb00140.x
Cabral, P. D. S., Amaral Júnior, A. T., Freitas, I. L. J., Ribeiro, R. M. and Silva, T. R. C. (2016). Relação causa e efeito de caracteres quantitativos sobre a capacidade de expansão do grão em
milho-pipoca. Revista Ciência Agronômica, 47, 108-117. http://dx.doi.
org/10.5935/1806-6690.20160013
Camilo, J. D. S., Barbieri, V. H. B., Rangel, R. M., Bonnas, D. S., Luz, J. M. Q. and Oliveira, R. C. (2015). Aceitação sensorial de híbridos de milho doce e híbridos de milho verde em intervalos de colheita. Revista
Ceres, 62, 1-8. http://dx.doi.org/10.1590/0034-737X201562010001
Cruz, C. D. (2013) Genes: a software package for analysis in experimental statistics and quantitative genetics. Acta Scientiarum
Agronomy, 35, 271-276. http://dx.doi.org/10.4025/actasciagron.
v35i3.21251
REFERENCES
Entringer, G. C., Santos, P. H. A. D., Vettorazzi, J. C. F., Cunha, K. S. and Pereira, M. G. (2014) Correlação e análise de trilha para componentes de produção de milho superdoce. Revista Ceres, 61,
356-361. http://dx.doi.org/10.1590/S0034-737X2014000300009
Goldman, I. L. and Tracy, W. F. (1994) Kernel protein concentration in sugary-1 and shrunken-2 sweet corn. HortScience, 29, 209-210.
Guan, Y. J., Hu, J., Wang, K. F., Zhu, S. J., Wang, J. C. and Knapp, A. (2013) Time series regression analysis between changes in
kernel size and seed vigor during developmental satage of sh2
sweet corn (Zea mays L.) seeds. Scientia Horticulturae, 154, 25-30. http://dx.doi.org/10.1016/j.scienta.2013.02.016
Hallauer, A. R., Carena, M. J. and Miranda Filho, J. B. (2010). Quantitative Genetics in Maize Breeding. New York: Springer. http://dx.doi.org/10.1007/978-1-4419-0766-0
IBGE [Instituto Brasileiro de Geografia e Estatística] (2016). Levantamento sistemático da produção agrícola: pesquisa mensal de previsão e acompanhamento das safras agrícolas no ano civil. Vol. 29. Rio de Janeiro: IBGE.
Ilker, E. (2011). Correlation and path coefficient analysis in sweet corn. Turkish Journal of Field Crop, 16, 105-107.
545
Bragantia, Campinas, v. 77, n. 4, p.536-545, 2018
Genetic improvement of super-sweet corn
de milho de ciclo precoce. Revista da Estatística da Universidade Federal de Ouro Preto, 3, 304-308.
Lorentz, L. H., Fortes, F. O. and Lúcio, A. D. (2006). Análise de trilha entre as variáveis das análises de sementes de espécies florestais exóticas do Rio Grande do Sul. Revista Árvore, 30,
567-574. http://dx.doi.org/10.1590/S0100-67622006000400009
MAPA [Ministério da Agricultura, Pecuária e Abastecimento] (2016). Registro Nacional de Cultivares. Brasília: Cultivarweb gerenciamento de informações; [accessed 2018 August 28]. http://sistemas.agricultura.gov.br/snpc/cultivarweb/cultivares_ registradas.php
Melo, A. R., Lima A. S. O. D., Oliveira, L. F., Tolentino, V. R. and
Branco, C. S. V. (2014). Conservas de minimilho (Zea mays, L.)
orgânico: Processamento e aceitação sensorial. Revista Verde de Agroecologia e Desenvolvimento Sustentável, 9, 271-277.
Montardo, D. P, Dall’Agnol, M., Crusius, A, F. and Paim, N. (2003) Path analysis for seed production in red clover (Trifoliumpratense
L.). Revista Brasileira de Zootecnia, 32, 1076-1082. http://dx.doi. org/10.1590/S1516-35982003000500007
Nogueira, A. P. O., Sediyama, T., Sousa, L. B., Hamawaki, O. T., Cruz, C. D., Pereira, D. G. and Matsuo, E. (2012). Análise de trilha e correlações entre caracteres em soja cultivada em duas épocas de semeadura. Bioscience Journal, 28, 877-888.
Oliboni, R., Faria, M. V., Neumann, M., Resende, J. T. V., Battistelli, G. M., Tegoni, R. G. and Oliboni, D. F. (2013). Análise dialélica na avaliação do potencial de híbridos de milho para a geração de populações-base para obtenção de linhagens.
Semina: Ciências Agrárias, Londrina, 34, 7-18. http://dx.doi.
org/10.5433/1679-0359.2013v34n1p7
Oliveira Jr., L. F. G., Deliza, R., Bressan-Smith, R., Pereira, M. G. and Chiquieri, T. B. (2006). Seleção de genótipos de milho mais promissores para o consumo in natura. Food Science
and Technology, 26, 159-166. http://dx.doi.org/10.1590/
S0101-20612006000100026
Parentoni, S. N., Gama, E. E. G., Magnavaca, R., Reifschneider, F. J. B. and Boas, G. L. V. (1990). Milho doce. Informe Agropecuário, 14, 17-22.
Santos, P. H. A. D., Pereira, M. G., Trindade, R. D. S., Cunha, K. S. D., Entringer, G. C. and Vettorazzi, J. C. F. (2014). Agronomic performance of super-sweet corn genotypes in the north of Rio de Janeiro. Crop Breeding and Applied Biotechnology, 14, 8-14. http://dx.doi.org/10.1590/S1984-70332014000100002
Singh, D. (1981). The relative importance of characters affecting
genetic divergence. TheIndian Journal of Genetic and Plant
Breeding, 41, 237-245.
Souza, R. S., Vidigal Filho, P. S., Scapim, C. A., Marques, O. J., Queiroz, D. C., Okumura, R. S., José, J. V., Reche, D. L. and Cortinove, V. B. (2013). Produtividade e qualidade do milho-doce em diferentes populações de plantas. Semina: Ciências Agrárias,
34, 995-1010. http://dx.doi.org/10.5433/1679-0359.2013v34n3p995
Tosello, G. A. (1987). Milhos especiais e seu valor nutritivo. In M. E. A. G. Z. Paterniani and G. P. Viégas (Coords.), Melhoramento e produção de milho no Brasil (p. 375-409). Campinas: Fundação Cargill.
Tracy, W. F. (2001). Sweet corn. In A. R. Hallauer (Ed.), Specialty
corns (p. 155-198). 2nd ed. Boca Raton: CRC Press.