Transactions
PAPER
Cite this: DOI: 10.1039/c5dt04176g
Received 23rd October 2015, Accepted 15th March 2016 DOI: 10.1039/c5dt04176g www.rsc.org/dalton
Characterization of decavanadate and decaniobate
solutions by Raman spectroscopy
†
Manuel Aureliano,*
a,bC. André Ohlin,
cMichele O. Vieira,
bM. Paula M. Marques,
b,dWilliam H. Casey
eand Luís A. E. Batista de Carvalho
bThe decaniobate ion, (Nb10= [Nb10O28]6−) being isoelectronic and isostructural with the decavanadate
ion (V10= [V10O28]6−), but chemically and electrochemically more inert, has been useful in advancing the
understanding of V10toxicology and pharmacological activities. In the present study, the solution
chem-istry of Nb10and V10between pH 4 and 12 is studied by Raman spectroscopy. The Raman spectra of V10
show that this vanadate species dominates up to pH 6.45 whereas it remains detectable until pH 8.59, which is an important range for biochemistry. Similarly, Nb10is present between pH 5.49 and 9.90 and
this species remains detectable in solution up to pH 10.80. V10dissociates at most pH values into smaller
tetrahedral vanadate oligomers such as V1and V2, whereas Nb10dissociates into Nb6under mildly (10 >
pH > 7.6) or highly alkaline conditions. Solutions of V10and Nb10are both kinetically stable under basic pH
conditions for at least two weeks and at moderate temperature. The Raman method provides a means of establishing speciation in the difficult niobate system and these findings have important consequences for toxicology activities and pharmacological applications of vanadate and niobate polyoxometalates.
1.
Introduction
Decavanadate ([V10O286−], V10) is a member of a larger family of Group V and VI polyoxoanions commonly known as poly-oxometalates (POMs). POMs have been found to have anti-dia-betic, -bacterial, -protozoal, -viral and -cancer activities, which have sparked interest in their use as bio-inorganic drugs.1–4 Decavanadate is a homoleptic isopolyoxovanadate that inter-acts with high affinity with several proteins such as myosin, actin, and Ca2+-ATPase, thus affecting a range of cellular pro-cesses, including calcium homeostasis, muscle contraction, cytoskeleton dynamics and mitochondrial oxygen consumption.4–11 Furthermore, the antidiabetic, anti-virus, anti-bacterial and anti-tumor activities of V10 and vanadate compounds are attracting increasing interest.12–18 Decavana-date also exhibits insulin-mimetic behavior, and it was shown that, upon incubation with decavanadate, rat adipocytes accumulate much more glucose than with well-established mimetic agents such as BMOV.18 Decavanadate is in many
cases likely a pro-drug, inducing anti-diabetic activity through peroxovanadate production.17 On the other hand, in vivo exposure to decavanadate, in comparison with vanadate, affects differently subcellular metal distribution, antioxidant enzyme activities, lipid peroxidation and tissue damage in several organs.4,9,10,19 Recently, decavanadate has also found application in other processes such as aerobic oxidation of starch, solar-driven photocatalysis and protein crystallography.20–22
Depending on factors such as vanadate concentration, pH and ionic strength, different vanadate oligomeric species can occur simultaneously in vanadium(V) solutions, including
monomeric (V1, [VO4]3− at high pH), dimeric (V2, [V2O7]4−), tetrameric (V4, [V4O12]4− and [V4O13]6−), and pentameric (V5, [V5O15]5−) vanadates.4,23,24 These ortho and metavanadate species are comprised of tetrahedral vanadate units. In addition to them, the decavanadate ion, V10, which consists of octahedral vanadate units, also occurs in solution. Its presence is easily detected due to the strong orange-yellow colour of V10 compared with the colourless ortho and metavanadates.
Whereas an equilibrium between the ortho and metavana-date species is achieved on the millisecond-to-second time scale in neutral and alkaline aqueous solutions, V10 interversion with the other vanadate oligomers occurs on a con-siderably longer time scale. The disappearance of the decamer follows a first-order kinetic process and can be easily followed by UV/Vis spectroscopy by recording the absorption band at 400 nm as a function of time.4–6 In addition, V10
decompo-†Electronic supplementary information (ESI) available. See DOI: 10.1039/ c5dt04176g
a
FCT and CCmar, University of Algarve, 8005-139 Faro, Portugal. E-mail: [email protected]; Fax: +351 289 800066; Tel: +351 289 800905
bUnidade de I&D Química-Física Molecular, Department of Chemistry, University of
Coimbra, Portugal
cSchool of Chemistry, Monash University, Clayton, Vic 3800, Australia
d
Department of Life Sciences, University of Coimbra, 3004-535 Coimbra, Portugal
eDepartment of Chemistry, University of California, Davis, California 95616, USA
Published on 15 March 2016. Downloaded by Universidade do Algarve (UALG) on 05/04/2016 19:00:55.
View Article Online View Journal
sition may be prevented through binding to specific proteins, which apparently retard dissociation. Increases in the half-life from 5 to 17 hours in the presence of sarcoplasmic reticulum vesicles, and to 27 hours in the presence of actin were found at room temperature and pH 7.0,25 whereas no effects were observed with myosin, even though it is known to have a high-affinity V10-binding site.26
Decavanadate was observed to induce protein cysteine oxi-dation and vanadyl formation in the presence of SR Ca2+ -ATPase and actin, whereas no effects were observed on incu-bation with monomeric vanadate.7,10,27 This reactivity of V10 was attributed to the involvement of cysteines at the V10 -binding site, as well as the participation of reduced vanadyl (VIV-containing) species in the enzymatic inhibition process.10 It is known that actin, in common with other proteins such as transferrin and albumin, contains a high affinity binding site for vanadyl.7 Decavanadate interactions with certain proteins can thus lead to vanadyl protein binding, although the partici-pation of vanadyl in the process is yet to be clarified.10
Other mono- and polyoxometalates, such as niobates, tung-states and molybdates, have also been evaluated in the inhi-bition of SR calcium ATPase and were found to be less active as inhibitors.28The decavanadate, V10, and decaniobate (Nb10 = [Nb10O28]6−) ions are isostructural and isovalent, but where vanadium is redox active and labile in solution, niobium is kinetically inert and redox stable, making Nb10 an excellent tool to explore the mode of inhibition that the V10analogue undergoes with the proteins.27,28
The Nb10 and V10 compounds differ in their sizes, their ability to dissociate, their acid–base chemistry and their dis-sociation products. For example, there are no equivalents to the oligomeric metavanadates for niobium, which dissociates to the hexaniobate Lindqvist ion (Nb6= [Nb6O19]8−) and deriva-tives. In spite of these differences the decaniobate ion can be a useful tool to understand the mechanism and biological activi-ties of the decavanadate ion because of the structural simi-larity and relatively inert behaviour.27,28
Raman spectroscopy has been shown to be a suitable tool for investigating vanadate speciation, including oligomeriza-tion and its dependence on concentraoligomeriza-tion, ionic strength and pH,29as well as decavanadate interactions with different Ca2+ -ATPase conformations.27 We presently use Raman spec-troscopy to further characterize aqueous solutions of decavana-date and decaniobate in order to determine differences in the ensemble of oligomeric species present under experimental conditions, which may be important in biochemical studies where the two families of ions are compared.27,28 The appli-cation of vibrational spectroscopy to niobate solutions is par-ticularly important because, although the predominant Nb nucleus is NMR active (93Nb; I = 9/2), it yields broad lines in solution because of quadrupolar broadening. In contrast, vanadium NMR51V; I = 7/2) yields relatively narrow lines as it is less affected by quadrupolar broadening. Niobate speciation can only be practically monitored by NMR by enriching the com-pounds with17O and watching the17O NMR signal area change with time, but this is inherently limited30and expensive.
In contrast with vanadate, there is less precedence for Raman spectroscopy on niobate solutions. Apart from a few examples of Raman spectra of the [Nb6O19]8− ion at static pH31,32early pH-dependent work was carried out prior to the isolation of Nb10, leading researchers then33 and later34 to assign the signals of this ion to a dodecameric species, which required later revision. In addition, a tetrameric niobate was reported by Spinner et al.33 but this putative oligomer has never been isolated. There is thus a need for spectroscopic Raman data of niobate species to correct the existing literature.
2.
Materials and methods
All reagents were of biochemical analysis grade and were sup-plied by BDH, Merck, and Sigma. Anhydrous ammonium metavanadate was purchased from Riedel-de Haën. Tetra-methylammonium decaniobate, [N(CH3)4]6[Nb10O28]·6H2O, was synthesised according to published procedures.35The syn-thesis of K7H[Nb6O19] was via adaptation of a standard method.36
2.1 Preparation of solutions
Decavanadate stock solution was prepared in MilliQ water (conductivity <0.055μS cm−1at 25 °C), by adjusting the pH of an ammonium metavanadate solution (50 mM, pH 6.7) to 4.0, according to literature methods,26,27and the formation of the V10ion was readily observed by the characteristic orange-yellow colour of the solution.4Thus, we obtained a stock decavana-date concentration of 5 mM V10(i.e. 50 mM total vanadium, ∼50 mM NH4+). A solution of Nb10was prepared in water as a stock concentration of 5 mM (i.e. 50 mM of niobium) by dissol-ving the tetramethylammonium salt. pH meter calibration was performed before each measurement with three standards from Hanna (4.01, 7.01 and 10.01). The solutions were pre-pared in MilliQ water (conductivity <0.055 µS cm−1at 25 °C). The pH was adjusted by the addition of 0.1 M of HCl or 0.1 M NaOH.
2.2 NMR spectroscopy
51V NMR spectroscopy measurements of V
10 and vanadate stock solutions were performed on a Bruker AM-400 MHz (9.4 T; 51V 105.2 MHz) spectrometer equipped with a 5 mm multinuclear inverse probe. The spectra were acquired at 22 °C using 0.5 mL of samples containing 10% D2O using a cali-brated π/2 pulse. 12 000–25 000 scans were acquired with recycling delays of 10 ms and acquisition times of 86 ms at a spectral width of 45.454 kHz. The51V NMR chemical shifts are reported relative to an external reference of VOCl3, as described in previous work.28
2.3 High resolution Raman spectroscopy
The Raman spectra were recorded at room temperature, in a triple monochromator HORIBA Jobin-Yvon T64000 Raman system (focal distance 0.64 m, aperture f/7.5), equipped with
holographic gratings of 1800 grooves per mm. The premono-chromator stage was used in the subtractive mode. The detec-tion system was a liquid-nitrogen-cooled non-intensified 1024 × 256 pixel (1″) Charge Coupled Device (CCD) chip. A 90° geo-metry between the incident radiation and the collecting system was employed. The entrance slit was set to 200 μm, while the slit between the premonochromator and the spectro-graph was set to 3.5 × 104 μm. The 514.5 nm line of an Ar+ laser (Coherent, Innova model 305) was used as the excitation radiation, providing ca. 50 mW at the sample position. Samples were sealed in Kimax glass capillary tubes of 0.8 mm inner diameter. The system was calibrated against the crystal-line silicon 521 cm−1band. Under the above mentioned con-ditions, the error in wavenumbers was estimated to be less than 1 cm−1and the resolution was better than 2 pixels of the CCD, i.e. 2 cm−1.
2.4 Low resolution Raman spectroscopy
Low resolution spectra were recorded on a Bayspec Agility Raman spectrometer equipped with a 785 nm laser working at 300 mW. 10 mM Nb10samples were prepared by adding 25 mg of solid Nb10to the buffer solutions (1.5 ml, 0.1 M) with the pH already pre-adjusted using dropwise addition of [N(CH3)4] OH (1.0 M) in order to avoid pH shock. The pH value was recorded after the Nb10 addition. The following buffers and pH were used: MES ( pH 6.13), PIPES ( pH 7.28), HEPES ( pH 8.18), CHES ( pH 9.05), CAPS ( pH 10.08 and pH∼ 11.12) and [N(CH3)4]OH ( pH ∼ 12.80). The pH was measured with a Sigma-Aldrich micro pH combination electrode calibrated between pH 4.01 and 10.01. The alkaline error is likely to be very significant only for the 0.1 M [N(CH3)4]OH solution ( pH 12.80). The solutions were pressed through 0.2 micrometer membrane filters which diminish, but do not eliminate, the Tyndall effect, as is typical. Spectra were collected after ca. four hours at 293 K. The speciation diagram in Fig. 3 was con-structed assuming that the signal intensity of 10 mM Nb10was ca. 70 cps.
2.5 Computational details
All calculations were performed with Gaussian 09 rev B.37All structures were optimised using the PBE0 (PBE1PBE) exchange correlation functional and the def2-tzvp basis set, using an ultrafine grid and implicit water solvation using the polari-zable continuum model.38Basis sets were obtained from the Basis Set Exchange.39Raman calculations were carried out at the same level of theory as the optimisations.
3.
Results and discussion
3.1 NMR spectroscopy
Decavanadate and Nb10 are isostructural and isoelectronic nanometre-sized polyoxometalate anions (Fig. 1). These relatively inflexible and structurally compact anions contain three types of metal sites: one site with four equivalent niobium (or vanadium) atoms above and below the major
equatorial plane (metal site A), one site with four equivalents in that plane (metal site B), and one site with two equivalents in both the major and minor equatorial planes (metal site C) (Fig. 1).
51V-NMR spectroscopic studies demonstrated that, after acidification of the metavanadate solution from pH 6.7 to pH 4.0, we obtain a V10solution containing decameric vanadate species (Fig. 2). The identity was confirmed by the presence of
Fig. 1 Structure of the V10and the Nb10ions. The grey (light color) and
red (dark color) spheres represent vanadium/niobium and oxygen atoms, respectively. The <Nb–O> bond lengths are 0.05–0.2 Å longer than the corresponding <V–O> bond lengths, making Nb10 slightly
larger than V10.
Fig. 2 51V NMR (105.2 MHz, 9.4 T) spectra, at ambient temperature of
50 mM (total vanadium) concentration of decavanadate ( pH 4.0) (A) and metavanadate solutions ( pH 6.7) (B). All spectra were acquired in the presence of 10% D2O. V10A, V10Band V10Crepresent signals of vanadium
sites in V10. The 51V NMR V1signals correspond to the orthovanadate
species namely, monomeric vanadate (VO43−, HVO42− and H2VO4−),
whereas the metavanadate species includes dimeric V2(HV2O73−and
H2V2O72−), regardless of the state of protonation, V4and V5, that
corres-ponds to cyclic tetrameric ([V4O12]4−) and pentameric vanadate
([V5O15]5−), respectively.
three NMR signals at−517, −501 and −426 ppm, respectively, corresponding to the three metal sites: V10A, V10B and V10C (Fig. 2), in the expected intensity ratios. As can be observed by 51V NMR, the solutions of 5 mM V
10(50 mM total vanadium, pH 4.0) contain mainly V10species (Fig. 2). Conversely, in the NMR spectrum of a 50 mM metavanadate solution ( pH 6.7), signals attributed to mono- (V1), di- (V2), tetra- (V4) and penta-meric (V5) species of vanadate can be observed, respectively, at −561 ppm, −575 ppm, −579 ppm and −587 ppm (Fig. 2), as previously described.4 As expected, we observe that acidifica-tion of a colorless metavanadate soluacidifica-tion turns the soluacidifica-tion yellow/orange due to pH shock and metastable formation of the V10ion, which dissociates slowly even at a pH where it is not ultimately stable. By‘pH shock’ we mean that metastable species form upon addition of a drop of a base or acid, and these species are kinetically persistent. Upon acidification of 50 mM and higher vanadate concentrations it is possible to observe the solution becoming dark for a while at pH 5. This indicates that the species that forms are not thermo-dynamically stable at pH 5. Most likely it is due to pH shock. To the best of our knowledge, only VO2+and HxV10O28(6−x)−are coloured, so one of these species would be suggested to be formed. The latter would be formed at the pH near the pH of the acid added to the vanadate solutions and that would imply the reduction of vanadate species whereas the former due to vanadate oligomerization. The observation of the formation of these species would not be feasible or possible by NMR and/or Raman spectroscopy. However, kinetic studies using UV-Vis spectroscopy would be suitable to follow the formation and disappearance of these species.
The speciation diagram for aqueous solutions of vanadate shows that the V10ion dominates between 2.5 and 5.8, to the point where it represents all of the total vanadate species at pH 3.0–5.0 (Fig. 3a). Similarly, the Nb10ion is the dominant signal at 5.5 < pH < 9.90 and is detectable up to pH∼ 10.8, whereas V10 slowly dissociates at most pH values and Nb10 converts quantitatively to the hexaniobate product at pH∼ 11 (Fig. 3b). To date, there is no comprehensive speciation model for niobate aqueous solutions, as opposed to vanadate. However, 17O NMR experiments have shown that the Nb10 species is stable for weeks between pH 5.5 and 7.5. Under higher pH conditions, the dissociation is detectable as a slow loss of signal from an internal oxygen in 17O-enriched com-pounds.30 The authors found the dissociation products to include the Nb6Lindqvist ion.40This dissociation is suspected to be reversible, based in part on isotope-transfer between the Nb10 and Nb6 although the thermodynamics of the equili-brium remains unexplored.40 Direct acidification of Nb10 in aqueous solution leads to the precipitation of a white powder referred to as ‘niobic acid’ in the literature. A dimer of the decaniobate ion, [Nb20O54]8−, can be formed in dichloro-methane at low pH.30Little is known about the behaviour at very high pH (>14) but as salts of [NbO4]3−are only known as insoluble solids, and K7H[Nb6O19] is synthesised in molten KOH,36it is unlikely that there is any polyoxoniobate chemistry beyond the Nb6ion in the alkaline direction.
3.2 Raman spectroscopy
We presently examine the stability of V10 species by Raman spectroscopy. A pH 4–12 range was chosen because it covers the biologically interesting range. On the other hand, the nio-bates condense by proton-induced charge neutralization under lower pH conditions whereas decavanadate persists under slightly lower pH conditions. Nevertheless, our focus was on the rich speciation chemistry at neutral pH and above. Fig. 4 depicts the Raman spectra of a 5 mM V10 solution in the 900–1100 cm−1 region, for pH values ranging from 7.47 to 6.45. In this pH range, the signals are assignable to the VO symmetric stretching vibration of different oligomeric species. In particular, the band at 995 cm−1is due to the V10species. This prevalence of V10 is in contrast with what is expected taking in consideration the speciation diagram for thermo-dynamically equilibrated solutions in this pH range, which predicts that the solution should not contain any appreciable
Fig. 3 (A) Speciation diagram based on 51V-NMR, for an aqueous
50 millimolal (50 mmol kg−1) solution of vanadium(V) at pH 0–14,
showing the atomic concentration of vanadiumi.e. the molecular con-centration of each species is multiplied by the number of vanadium atoms incorporated into it. The speciation at each pH was computed using Visual MINTEQ v3.0 [http://vminteq.lwr.kth.se/] in the presence of 1.0 M NaCl with afixed 1.0 M ionic strength using the SIT model.44(B)
Speciation diagram of niobates at 293 K atca. 0.1 M ionic strength based on the current Raman spectrometric work. See the text for details as well as the ESI.†
amount of V10, but mainly V4, with some V5, V2and V1. In fact, the spectra undergo a sequence of changes with pH: at pH 6.95 an additional band at 947 cm−1 begins to emerge and becomes completely distinguishable at pH 7.47 (Fig. 4). This signal clearly corresponds to another species, probably a tetra-meric vanadate resulting from some V10decomposition. This disparity is due to the solution being pH shocked and still under kinetic control.
The51V NMR studies showed that on acidification of vana-date solutions ( pH 6.6), V10appears together with the V1, V2 and V4which were already present in the vanadate solution at pH 6.8.4Raman bands ascribed to V
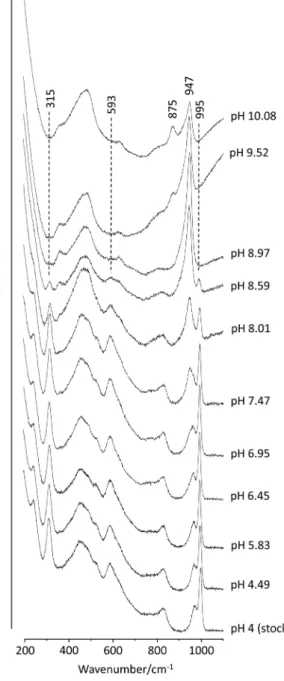
10are also observed at 315 and 593 cm−1, in addition to the ones at 967 and around 995 cm−1(Fig. 5). These V10former bands are clearly visible in the Raman spectrum from 4.0 to pH 8.59 (Fig. 5). Conversely, at pH 8.97 V10is no longer detectable, whereas the band at 947 cm−1that began to emerge at pH 6.95 increasingly domi-nates the spectrum for higher pH values (Fig. 5). This signal was assigned in a previous study,26to the symmetric stretching vibration mode from V4and V5species, which agrees with the predicted speciation diagram in Fig. 1. At pH 9.52 a band, allo-cated to V2and HV1species, arises at 875 cm−1. The band at 820 cm−1 assigned to the unprotonated V1 species is only observed at a pH value close to 12.29Furthermore, after two weeks of incubation at 40 °C, similar spectra were obtained (not shown) for all the solutions described in Fig. 5.
In the Raman spectrum of decaniobate the bands at 936 and 270 cm−1arise from the Nb10ion (Fig. 6), with the band at 953 cm−1 ascribed to [N(CH3)4]+. The 936 cm−1 signal, assigned to the NbO symmetric stretching vibration, appears
at a lower wavenumber than the corresponding one observed for the decavanadate, as expected assuming a similar force constant since niobium is a heavier element than vanadium. These bands are clearly observed up to pH 10.80 (Fig. 6), indi-cating the presence of Nb10in the solution. No changes were observed on the spectra of the above solutions after two weeks of incubation at 40 °C, pointing out that the Nb10solutions were stable even at higher alkaline pH values (Fig. 7).
The literature evidence for dissociation of the Nb10at pH > 7.6 is from clear 17O-NMR signal loss from oxygens in the center of the molecule.40 The 17O-NMR signal loss is quite slow and the authors suspected that there may be an
equili-Fig. 4 Raman spectra of decavanadate solutions (50 mM total vanadium) from pH 6.45 to 7.47.
Fig. 5 Raman spectra (200 to 1100 cm−1) of decavanadate solutions (50 mM total vanadium) from pH 4.00 to 10.08. The band between 400 and 500 cm−1is due to the glass.
brium between the Nb10 and the Nb6 dissociation product. The Raman spectra are consistent with Nb10being present in solution up to pH 10.80 [Fig. 3b]. Thus, at pH 10.49, a slight separation of bands is observed, and at pH 10.80 the for-mation of a band at 889 cm−1is attributed to the presence of Nb6(Fig. 6). Also there is no difference in the Raman spectra at pH 11.22 and 12.51 (Fig. 6). Furthermore, Nb10species are kinetically stable and present in solution up to pH 9.90 for at least two weeks at 40 °C, even for the higher pH values ana-lysed (Fig. S1†). In fact, there is no description in the literature of species in solution smaller than Nb6, suggesting that this species is stable at very high pH, as we discussed above.
In an attempt to obtain a more quantitative view of the solution compositions, we collected additional data on a low-power, low-resolution instrument on samples prepared using
0.1 M biological buffers to avoid the influence of pH shock that might result from the addition of an acid or base to solu-tions of the niobates. As can be seen in Fig. 7, the results show that it is possible to collect quantitative solution composition data for niobates even in the presence of stabilising buffers.
The results broadly agree with previous data by Villa et al. based on the17O NMR spectra of17O-enriched Nb10acquired at 35 °C which showed that Nb10, at concentrations of 0.6 M (total Nb), slowly dissociates to Nb6at and above pH 7.5, with the dissociation occurring increasingly rapidly with increasing pH and can be affected by solution composition.30The reaction has been observed to be at least partially reversible by the dis-solution of Nb6 in a borate buffer and subsequent analysis by ESI-MS after 24 hours at room temperature, a result that was confirmed by Klemperer et al., who noted that the formation of Nb10from Nb6was favoured by increasing temperature.41
In either case, Raman spectra may here present a unique opportunity for the thermodynamic resolution of the equilibrium between Nb6and Nb10, which would constitute the first example of quantitative speciation data for any polyoxoniobate species. It also does not escape our attention that a similar approach could be used to detail the relationship between [Ta6O19]8− and [Ta10O28]6−, the latter being isolated only recently.42
3.3 Comparison between computed and observed spectra The electronic-structure calculations predict features of the Raman spectra well, with a systematic over-estimation of the reciprocal wavenumber (Fig. 8). Experimentally, V10exhibits a strong band at 995 cm−1, which is predicted computationally (Fig. 8d) to manifest at 1059 cm−1, together with bands between 614 and 627 cm−1 and at 334 cm−1 which are experimentally found at 593 and 315 cm−1, respectively. This tendency to over-estimate the wavenumber of the signal is persistent and well-known43with the signal from V4showing up at 947 cm−1, but being predicted to occur at 1002 cm−1 (Fig. 8c). The most important point, however, is that the calculations capture the general trend of the signals shifting to a lower frequency with decreasing chain length, as well as the decavanadate species having two pronounced signals around 1000 cm−1(Fig. 8d).
The qualitative and quantitative agreement is much better for the niobate species, with a predicted signal maximum at 957 cm−1(Fig. 8f ) for Nb10which was observed at 936 cm−1. However, as the main signal for the Nb6 occurs at 889 cm−1 but is expected at 858 cm−1, the good numerical agreement for Nb10may be entirely fortuitous, which is unsurprising as the computations do not accurately account for hydrogen bonding and other factors that are known to influence the spectra (Fig. 8e and f ).
The [N(CH3)4]+ signals are expected at 817 and 1020 cm−1, but exhibit at 755 and 953 cm−1. The shapes and number of predicted signals agree well with experiment, lending some con-fidence in assignments for the observed signals. The main signal from the Nb10at 957 cm−1(computed shift) is due to a symmetric concerted stretch of the terminal oxygen sites away from the molecular centre, as is the main signal from the Nb6 ion at 858 cm−1. The Nb6signals between 520 and 530 cm−1are
Fig. 6 Raman spectra (200 to 1100 cm−1) of decaniobate solutions (50 mM total niobium) from pH 5.49 to 12.51.
due to movements of the central oxygen along an axis, and to the sets ofμ2-oxygens moving towards the molecular centre.
4.
Conclusions
Raman spectra indicate that the V10ion dominates in solution up to pH 6.45 and that this species remains detectable in
solu-tion until pH ∼ 8.6. On the other hand, the Nb10ion is the dominant signal at 5.5 < pH < 9.90 and is detectable up to pH ∼ 10.8. Whereas V10slowly dissociates at most pH values Nb10 converts quantitatively to the hexaniobate product at pH∼ 11 (Fig. 9). Nevertheless, Raman spectra point out that both V10 and Nb10solutions are stable in solution for at least two weeks and moderate heat, in the sense that they do not precipitate a solid and that V10and Nb10are still detectable over a wide pH
Fig. 8 Computed Raman spectra for select vanadate and niobate species. See the ESI† for numerical data.
Fig. 7 Raman spectra of buffered solutions of Nb10as a function of pH. Note that the [N(CH3)4]+concentration varies between solutions as
[N(CH3)4]OH was used to adjust the pH of the buffers.
range. Thus, Raman spectroscopy may be a potentially useful tool to characterize Nb10and V10species and their equilibrium with lower oligomers, which is extraordinarily difficult for niobate species because NMR is very difficult in the system. The vibrational properties, in contrast, can be established using electronic-structure methods a priori and used to assign the signals from putative minor aqueous species. These find-ings have important consequences for understanding the differences between decavanadate and decaniobate solution chemistry as well as its biological activities and pharmacologi-cal applications whenever a particular vanadate or niobate oligomer maybe desired and higher pH values are used.
Abbreviations
BMOV Bis(maltolato)oxovanadium(IV)
CAPS N-Cyclohexyl-3-aminopropanesulfonic acid CHES N-Cyclohexyl-2-aminoethanesulfonic acid HEPES
4-(2-Hydroxyethyl)-1-piperazineethanesulfo-nic acid
MES 2-(N-Morpholino)ethanesulfonic acid PIPES Piperazine-N,N′-bis(2-ethanesulfonic acid) Nb10 Decaniobate ion [Nb10O28]6−
Nb6 Hexaniobate Lindqvist ion, [Nb6O19]8− SR Sarcoplasmic reticulum
SR Ca2+-ATPase Calcium pump from sarcoplasmic reticulum 51V-NMR Vanadium-51 NMR
V1 Monomeric vanadate, [VO4]3− V2 Dimeric vanadate, [V2O7]4−
V4 Tetrameric vanadate, [V4O12]4−and [V4O13]6− V5 Pentameric vanadate, [V5O15]5−
V10 Decavanadate ion, [V10O28]6−
Acknowledgements
MA, LAEBC and MPMM thanks the National Funds through FCT – Foundation for Science and Technology (UID/Multi/ 04326/2013 and UID/Multi/00070/2013). CAO is grateful for a QEII fellowship and Discovery Project grant (DP110105530) from the Australian Research Council. Some materials were provided by Prof. William Casey of U. C. Davis who prepared them with support from an NSF CCI grant through the Center for Sustainable Materials Chemistry, number CHE-1102637.
References
1 J. T. Rhule, C. L. Hill and D. A. Judd, Chem. Rev., 1998, 98, 327–357.
2 T. Yamase, J. Mater. Chem., 2005, 15, 4773–4782.
3 M. Aureliano, Oxid. Med. Cell. Longevity, 2016, 2016, 6103457, 8 pages.
4 M. Aureliano and D. C. Crans, J. Inorg. Biochem., 2009, 103, 536–546.
5 M. Aureliano, Dalton Trans., 2009, 9093–9100. 6 M. Aureliano, World J. Biol. Chem., 2011, 2, 215–238. 7 S. Ramos, J. J. G. Moura and M. Aureliano, Metallomics,
2012, 4, 16–22.
8 M. Aureliano, G. Fraqueza and C. A. Ohlin, Dalton Trans., 2013, 42, 11770–11777.
9 M. Aureliano, Inorg. Chim. Acta, 2014, 420, 4–7.
10 M. Aureliano and C. A. Ohlin, J. Inorg. Biochem., 2014, 137, 123–130.
11 N. Samart, J. Saeger, K. J. Haller, M. Aureliano and D. C. Crans, J. Mol. Eng. Mater., 2014, 2, 1440007.
12 L. Yan-Tuan, Z. Chun-Yuan, W. Zhi-Yong, M. Jiang and C.-W. Yan, Transition Met. Chem., 2010, 35, 597–603. 13 F. Zhai, X. Wang, D. Li, H. Zhang, R. Li and L. Song,
Biomed. Pharmacother., 2009, 63, 51–55.
14 X. Niu, R. Xiao, N. Wang, Z. Wang, Y. Zhang, Q. Xia and X. Yang, Curr. Top. Med. Chem., 2016, 16, 811–822.
15 V. Dimitrova, K. Zhetcheva and L. P. Pavlova, J. Chem., 2011, 35, 215–223.
16 R. Raza, A. Matin, S. Sarwar, M. Barsukova-Stuckart, M. Ibrahim, U. Kortz and J. Iqbal, Dalton Trans., 2012, 41, 14329–14336.
17 A. Zorzano, M. Palacin, L. Marti and S. Garcia-Vicente, J. Inorg. Biochem., 2009, 103, 559–566.
18 M. J. Pereira, E. Carvalho, J. W. Eriksson, D. C. Crans and M. Aureliano, J. Inorg. Biochem., 2009, 103, 1687–1692. 19 G. Borges, P. Mendonça, N. Joaquim, M. Aureliano and
J. M. Coucelo, Arch. Environ. Contam. Toxicol., 2003, 45, 415–422.
20 X. Chen, S. Yan, H. Wang, Z. Hu, X. Wang and M. Huo, Carbohydr. Polym., 2015, 117, 673–680.
21 L. Mohapatra and K. M. Parida, Phys. Chem. Chem. Phys., 2014, 16, 16985–16996.
22 A. Bijelic and A. Rompel, Coord. Chem. Rev., 2015, 299, 22–38.
Fig. 9 V10dissociates at most pH values into smaller tetrahedral
vana-date oligomers such as V4and V2, whereas Nb10 dissociates into Nb6
under mildly or highly alkaline conditions.
23 L. Pettersson, I. Andersson and A. Gorzsás, Coord. Chem. Rev., 2003, 237(1–2), 77–87.
24 A. Gorzsás, I. Andersson and L. Pettersson, J. Inorg. Biochem., 2009, 103, 517–526.
25 S. Ramos, M. Manuel, T. Tiago, R. O. Duarte, J. Martins, C. Gutiérrez-Merino, J. J. G. Moura and M. Aureliano, J. Inorg. Biochem., 2006, 100, 1734–1743.
26 T. Tiago, M. Aureliano and C. Gutierrez-Merino, Biochemis-try, 2004, 43, 5551–5561.
27 G. Fraqueza, L. A. E. Batista de Carvalho, M. P. M. Marques, L. Maia, C. A. Ohlin, W. H. Casey and M. Aureliano, Dalton Trans., 2012, 41, 12749–12758. 28 G. Fraqueza, C. A. Ohlin, W. H. Casey and M. Aureliano,
J. Inorg. Biochem., 2012, 107, 82–89.
29 A. Amado, M. Aureliano, P. J. Ribeiro-Claro and J. Teixeira-Dias, J. Raman Spectrosc., 1993, 24, 669–703.
30 E. M. Villa, C. A. Ohlin, E. Balogh, T. M. Anderson, M. D. Nyman and W. H. Casey, Angew. Chem., Int. Ed., 2008, 47, 4844–4846.
31 R. S. Tobias, Can. J. Chem., 1965, 43, 1222–1225.
32 W. P. Griffith and T. D. Wickins, J. Chem. Soc. A, 1966, 1087–1090.
33 A. Goiffon and B. Spinner, Rev. Chim. Miner., 1974, 11, 262–268.
34 J.-M. Jehng and I. E. Wachs, Chem. Mater., 1991, 3, 100–107. 35 C. A. Ohlin, E. M. Villa and W. H. Casey, Inorg. Chim. Acta,
2009, 362, 1391–1392.
36 Y. Liu, S.-X. Guo, L. Ding, C. A. Ohlin, A. M. Bond and J. Zhang, ACS Appl. Mater. Interfaces, 2015, 7, 16632–16644. 37 M. J. Frisch, et al., Gaussian 09, Gaussian, Inc.,
Walling-ford, CT, USA, 2009.
38 J. Tomasi, B. Mennucci and R. Cammi, Chem. Rev., 2005, 105, 2999–3094.
39 K. L. Schuchardt, B. T. Didier, T. Elsethagen, L. Sun, V. Gurumoorthi, J. Chase, J. Li and T. L. Windus, J. Chem. Inf. Model., 2007, 47, 1045–1052.
40 C. A. Ohlin, E. M. Villa, J. C. Fettinger and W. H. Casey, Angew. Chem., Int. Ed., 2008, 47, 8251–8254.
41 W. G. Klemperer and K. A. Marek, Eur. J. Inorg. Chem., 2013, 1762–1771.
42 M. Matsumoto, Y. Ozawa, A. Yagasaki and Y. Zhe, Inorg. Chem., 2013, 52, 7825–7827.
43 M. K. Kershawani, B. Brauer and J. M. L. Martin, J. Phys. Chem., 2015, 119, 1701–1714.
44 I. Grenthe, A. V. Plyasunov and K. Spahiu, in Modelling in aquatic chemistry, ed. I. Grenthe and I. Puigdomenech, OECD Nuclear Energy Agency, Paris, 1997, ch. IX, pp. 325–426.

![Fig. 7 Raman spectra of bu ff ered solutions of Nb 10 as a function of pH. Note that the [N(CH 3 ) 4 ] + concentration varies between solutions as [N(CH 3 ) 4 ]OH was used to adjust the pH of the bu ff ers.](https://thumb-eu.123doks.com/thumbv2/123dok_br/18437245.896462/7.892.190.698.76.420/raman-spectra-solutions-function-concentration-varies-solutions-adjust.webp)

