Vol. 51, n. 3 : pp.465-472, May-June 2008
ISSN 1516-8913 Printed in Brazil BRAZILIAN ARCHIVES OF BIOLOGY AND TECHNOLOGY A N I N T E R N A T I O N A L J O U R N A L
Prediction of Genotypic Values and Estimation of Genetic
Parameters in Common Bean
Alisson Fernando Chiorato1*, Sérgio Augusto Morais Carbonell1, Luiz Antônio dos Santos
Dias2 andMarcos Deon Vilela de Resende3
1
Centro de Análises e Pesquisa Tecnológica do Agronegócio dos Grãos e Fibras; Instituto Agronômico; Campinas - SP -Brazil; afchiorato@iac.sp.gov.br. 2Departamento de Biologia Geral; BIOAGRO; Universidade Federal de Viçosa; Viçosa - MG - Brazil. 3Embrapa Florestas; 83411-000; Colombo - PR - Brazil
ABSTRACT
Eighteen common bean (Phaseolus vulgaris L.) genotypes were evaluated in 25 environments of the state of São Paulo in 2001 and 2002. The estimation of genetic parameters by the Restricted Maximum Likelihood (REML) and the prediction of genotypic values via Best Linear Unbiased Prediction (BLUP) were obtained by software Selegen-REML/BLUP. The estimate of the broad-sense heritability was low for the grain yield (0.03), since it took individual plots into consideration and was free of the effects of interaction with years, cultivation periods and site. Nevertheless, the heritability at the level of line means across the various environments was high (0.75), allowing a high accuracy (0.87) in the selection of lines for planting in the environment mean. Among the 18 genotypes, the predicted genotypic values of nine were higher than the general mean. The genetic gain predicted with the selection of the best line, in this case line Gen 96A31 of the IAC, was 16.25%.
Key words: REML, BLUP, Phaseolus vulgaris, Mixed Models
INTRODUCTION
The common bean is considered one of the main protein sources used by the Brazilian population. On this background, the genetic improvement programs of the common bean aim to identify the genotypes with high production capacity and yield stability. Rigorous selection methods with tillages at various sites and in different harvest periods were, therefore, used for an evaluation of the phenotypic performance of the genotype. Cruz and Carneiro (2003) reported that the observed phenotypic performance was often not an adequate
mixed models in the annual plants is the study of Reis et al. (2005) and that of Bernardo et al. (1996a; 1996b) with maize suggesting the estimation of variance components, prediction of breeding values using REML/BLUP procedures. In this report, we used the Restricted Maximum Likelihood (REML) and the Best Linear Unbiased Prediction (BLUP) to analyze the experiments involving 18 common bean genotypes cultivated at 25 sites in São Paulo state in 2001 and 2002.
MATERIAL AND METHODS
Data gathered from 25 sites in the State of São Paulo (regional trial of common bean - VCU Trials) from 2001/02 biennium was used. The trials were installed considering the three cultivation periods (rainy, dry and winter), recommended for the crop. The trials of the dry cultivation period were conducted in Capão Bonito (48o36’W – 23o50’S), Tietê (49o15’W – 23o35’S), Monte Alegre do Sul (46o45’W – 22o38’S), Mococa (47º16’W – 21º16’S) and Espírito Santo do Pinhal (46º55’W – 22º04’S) in 2001 and
Capão Bonito, Monte Alegre do Sul, Tatuí (48º05’W – 23º13’S) and Espírito Santo do Pinhal in 2002; winter cultivation periods conducted in Monte Alegre do Sul, Votuporanga (50º11’W – 29º09’S), Espírito Santo do Pinhal, Ribeirão Preto (47º59’W – 21º04’S), Mococa and Pindorama (49º01’W – 21o07’S) in 2001 and Ribeirão Preto, Monte Alegre do Sul, Mococa and Pindorama in 2002, and finally the rainy cultivation periods conducted in Capão Bonito, Tatuí and Espírito Santo do Pinhal in 2001 and Capão Bonito, Taquarituba (49º40’W – 23o24’S) and Monte Alegre do Sul in 2002.
The experimental design consisted of randomized complete block design, with four replications. Each plot contained four rows, five meter long, 0.50 m between rows and the two central rows were used for grain yield evaluation. Altogether, 14 advanced lines of the main Brazilian breeding programs and four other recommended cultivars for São Paulo state (IAC-Carioca Eté and Pérola of carioca tegument and IAC-Una and TPS-Nobre with black tegument) were planted in each trial (Table 1).
Table 1 - Common bean cultivars and lines that participated in the VCU trials of 2001 and 2002 analyzed by the REML/BLUP mixed model methodology.
Common beans cultivars and lines Grain Type Holders
CII - 102 Carioca UFLA, Lavras - MG - Brazil
LH-II Carioca UFLA, Lavras - MG - Brazil
CNFC8065 Carioca EMBRAPA, Goiânia - GO - Brazil
CNFC8066 Carioca EMBRAPA, Goiânia - GO - Brazil
CNFP7726 Black EMBRAPA, Goiânia - GO - Brazil
CNFP8100 Black EMBRAPA, Goiânia - GO - Brazil
FT-Nobre Black FT, Ponta Grossa - PR - Brazil
GEN96A10 Carioca IAC, Campinas - SP - Brazil
GEN96A13 Pinto beans IAC, Campinas - SP - Brazil
GEN96A28 Carioca IAC, Campinas - SP - Brazil
GEN96A31 Carioca IAC, Campinas - SP - Brazil
GEN96A58 Black IAC, Campinas - SP - Brazil
IAC-Carioca Eté Carioca IAC, Campinas - SP - Brazil
IAC-Una Black IAC, Campinas - SP - Brazil
LP97-13 Carioca IAPAR, Londrina - PR - Brazil
LP98-19 Carioca IAPAR, Londrina - PR - Brazil
LP98-20 Black IAPAR, Londrina - PR - Brazil
The data were analyzed by the methods REML and BLUP, according to Resende and Dias (2000) and Resende et al. (2001). The analyses were obtained using model 23 of the software SELEGEN REML/BLUP (Resende 2002). A univariate genotypic model was used, where: y = Xb + Zg + Wc + e, where y, b, g, c and e were the vectors of data, of the effects of the blocks and environments (fixed), of the genotypic effects (random), of the effects of the interaction genotypes x environments (random) and of the random errors, respectively; and X, Z and W were the matrixes of incidence for b, g and c, respectively.
Mean and variance distributions and structures y b, V ~ N(Xb, V)
g
σ
ˆ
2g ~ N (0, I 2g
σ
ˆ
)c σˆ2c ~ N (0, I 2 c σˆ )
e σˆ2e ~ N(0, I 2 e σˆ )
that is
Cov (g, c) = 0; Cov (g, e) = 0; Cov (c, e) = 0
E
e
c
g
y
=
0
0
0
Xb
and Var
e
c
g
y
=
R
CW
GZ
V
'
'
0 0 G ZG 0 0 C WC
R R 0 0 where:G = I
σ
ˆ2g, R = I 2 cσˆ , C = I 2 e
σˆ and V = ZI 2 g
σ
ˆ Z’ + WIσˆ2cW’+ I 2e
σˆ = ZGZ’ + WCW’ + R
Mixed model equations
= λ + λ + y ' W y ' Z y ' X cˆ gˆ bˆ I W ' W Z ' W X ' W W ' Z I Z ' Z X ' Z W ' X Z ' X X ' X 2 1 where: 1
λ
= 2 g 2 eσ
ˆ
σ
ˆ
= 2 a 2 2 ahˆ
c
hˆ
1
−
−
;
λ
2 =2 c 2 e
σ
ˆ
σ
ˆ
= 2 2 2 a c c hˆ 1− −2 e 2 c 2 g 2 g 2 a σˆ σˆ σˆ σˆ hˆ + +
= = broad-sense heritability at
the plot level;
2 e 2 c 2 g 2 c 2
σ
ˆσ
ˆσ
ˆσ
ˆ c + += = coefficient of
determination of the effects of interaction genotype x environment;
2 g
σ
ˆ = genotypic variance;2 c
σˆ = variance of the interaction genotypes x environments;
2 e
σˆ = residual variance.
Iterative estimators of the components of variance by REML via algorithm EM (Expectation-Maximization)
2 e
σˆ =
[
]
[
N r(x)]
y W' ' cˆ y Z' ' gˆ y X' ' bˆ y y'
−
−
−
−
2 gσ
ˆ =[
]
q
trC
σ
ˆ
gˆ
'
gˆ
+
2e 222 c
σ
ˆ
=[
]
s trC
σˆ
c '
cˆ + 2e 33
where:
22
C and C33 derived from :
1
−
C = matrix of the coefficient of the Mixed model equations;
tr = trace of a matrix operator; r(x) = rank of the X matrix;
N,q,s = total number of data, number of lines and number of combinations genotypes x environments, respectively.
Based on the individual heritability in the broad sense and component c2, the heritability at the level of the line mean, assuming four replicates in each environment, was given by:
2 am
hˆ
=2 a 2
2 a
2 a
hˆ 1)B (L ) c hˆ 1)( (B 1
hˆ BL
− + + −
+
where B is the number of blocks per local and L the number of sites.
This expression was used to determine the selection accuracy for the lines. In the present case, the accuracy in the prediction of the cultivars’ genotypic values was given by:
gˆ g
rˆ = [ 2 12 am]
hˆ , whit gˆ g
rˆ between 0 and 1.
The variance of the error of prediction of the cultivars’ genotypic effects is given by Var (gˆ)= (1-hˆam2 )σˆ2g and the confidence interval of the
predicted genotypic values by
2 1 2 g 2 am)σˆ ]
hˆ t[(1
gˆ± − , where t is the chart value of the t Student distribution associated to a particular degree of confidence (t=1.96 for an interval constructed with 95% of confidence).
After obtaining the predicted genotypic values (u + g) of thelines and cultivars for grain yield and the confidence intervals (95%), the efficiency of the methodology BLUP was evaluated correlating the predicted genotypic values with the original mean of each genotype obtained for the 25 sites used for the implantation of the trials. The values were analyzed by the Pearson correlation and processed on software GENES (Cruz, 2001).
RESULTS AND DISCUSSION
The estimative of the broad-sense heritability at the level of individual plots, in other words, of the pure genotypic effects for the grain yield was low (0.034) (Table 2) since it was free of the interaction effects with the years, periods and sites. A low genetic variability was observed among the evaluated genotypes because of the low broad-sense heritability and the low coefficient of genetic variation (8.55). The quantitative traits, as for example the grain yield in common bean, generally present heritabilities with low magnitudes, but lead to moderate magnitudes of heritabilities at the level of line means (Resende, 2002). The heritability at the level of line means across the various environments was, therefore, high (0.75) since the environmental effects were minimized, allowing a high accuracy (0.87) in the selection of lines for sowing in the environment mean. The heritability at the level of line means is determined based on the number of replications and the number of evaluated plants. Resende et al. (2001) evaluated the trait stem diameter in the coffee genotypes and obtained higher accuracy values with a higher number of replications and half of the number of the evaluated plants per plot. Likewise, the heritability at the mean level was somewhat higher than in the broad sense, attaining a selection accuracy of about 0.76.
2 a
hˆ : broad-sense heritability at the individual plot level; hˆam2 : heritability at the level of line means;
gˆ g
rˆ : accuracy in the selection of lines; rga: mean
genotypic correlation across the environments.cˆ2: coefficient of determination of the effects of the
interaction genotype x environment; 2 g ˆ σ :
genotypic variance; 2 c ˆ
σ : variance of the
interaction genotype x environment; 2 e ˆ
σ : residual
variance; 2 f ˆ
σ : phenotypic variance; g CV :
Table 2 - Estimates of genetic parameters for grain yield of 18 common bean genotypes evaluated at 25 sites in São Paulo state in 2001 and 2002.
Parameters Estimates
2 a
hˆ
0.0342 am
hˆ
0.750gˆ g
rˆ 0.870
rga 0.783
2
cˆ
0.0602 g ˆ
σ 62274.34
2 c ˆ
σ 17284.74
2 e ˆ
σ 1618046.98
2 f ˆ
σ 1788330.72
g
CV 8.55
Mean (Kg ha-1) 2917.20
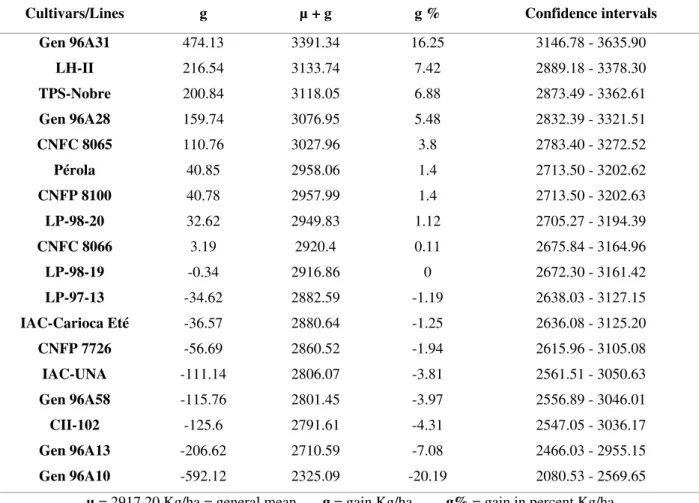
Among the 18 evaluated genotypes, nine presented predicted genotypic values above the general mean (Table 3). The genetic gain predicted with the selection of the best line, in this case, line Gen 96A31 of the IAC, was 16.25%. According to Simeão et al. (2002), the selection of superior genotypes should be based on the components of variance as much as on the mean components. For a considerable genetic gain, the genotypes with high mean and broad genetic variability must be selected. In this concept, the first five genotypes were those that presented the most significant predicted values. Among them, the cultivar TPS-Nobre maintained its superiority in relation to the
bean breeding program of the IAC recommends only productive and stable cultivars, which are anthracnose-resistant and at least tolerant to angular leaf spot.
Table 3 - Predicted genotypic values (u + g) and their confidence intervals (95%) for the grain yield of 18 common bean cultivars/lines evaluated at 25 sites in the state of São Paulo in 2001 and 2002.
Cultivars/Lines g µ + g g % Confidence intervals
Gen 96A31 474.13 3391.34 16.25 3146.78 - 3635.90
LH-II 216.54 3133.74 7.42 2889.18 - 3378.30
TPS-Nobre 200.84 3118.05 6.88 2873.49 - 3362.61
Gen 96A28 159.74 3076.95 5.48 2832.39 - 3321.51
CNFC 8065 110.76 3027.96 3.8 2783.40 - 3272.52
Pérola 40.85 2958.06 1.4 2713.50 - 3202.62
CNFP 8100 40.78 2957.99 1.4 2713.50 - 3202.63
LP-98-20 32.62 2949.83 1.12 2705.27 - 3194.39
CNFC 8066 3.19 2920.4 0.11 2675.84 - 3164.96
LP-98-19 -0.34 2916.86 0 2672.30 - 3161.42
LP-97-13 -34.62 2882.59 -1.19 2638.03 - 3127.15
IAC-Carioca Eté -36.57 2880.64 -1.25 2636.08 - 3125.20
CNFP 7726 -56.69 2860.52 -1.94 2615.96 - 3105.08
IAC-UNA -111.14 2806.07 -3.81 2561.51 - 3050.63
Gen 96A58 -115.76 2801.45 -3.97 2556.89 - 3046.01
CII-102 -125.6 2791.61 -4.31 2547.05 - 3036.17
Gen 96A13 -206.62 2710.59 -7.08 2466.03 - 2955.15
Gen 96A10 -592.12 2325.09 -20.19 2080.53 - 2569.65
µ = 2917.20 Kg/ha = general mean g = gain Kg/ha g% = gain in percent Kg/ha
Although line Gen 96A31 presented the highest predicted genetic value for the grain yield, its Kidney grain type (reniform) disqualified it as a future cultivar. Nevertheless, this line has been widely used in the crossings in the IAC improvement program as allele donor for the anthracnose resistance and mainly for high resistance to grain darkening since the cultivar IAC-Carioca Aruã with high resistance for this trait is part of its genealogy. Line Gen 96A28 with carioca type grains is being evaluated for the resistance to Fusarium wilt and characteristics of the technological qualities owing to the appealing appearance of the grain, aiming at a contribution to future recommendations. Lines LH-II and CNFC 8065, respectively, with the second and the
fifth-highest genetic values should be analyzed by their properties, for a possible recommendation in the state of São Paulo. They could also be used in the crossings with the best IAC lines aiming at the selection of descending transgressive segregating lines.
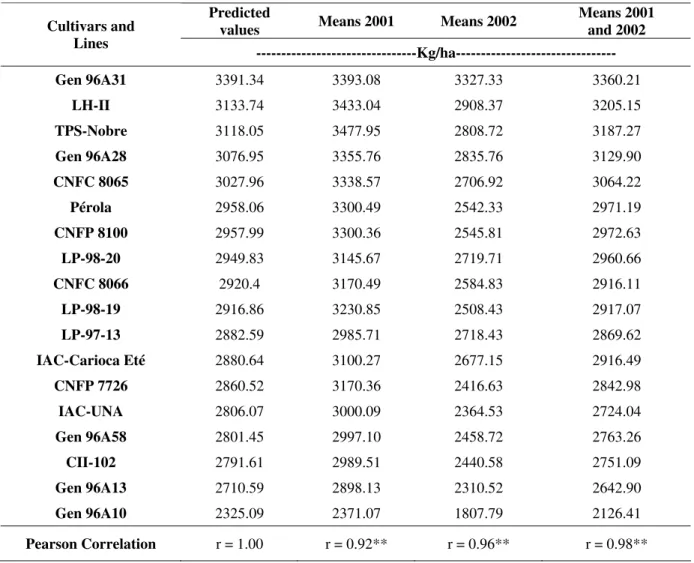
the efficiency of the BLUP methodology (Table 4).
Table 4 - Correlation between the predicted values and the grain yield means (kg/ha) observed in 18 common bean cultivars/lines sown in 2001 and 2002 in the state of São Paulo.
Predicted
values Means 2001 Means 2002
Means 2001 and 2002 Cultivars and
Lines
---Kg/ha---
Gen 96A31 3391.34 3393.08 3327.33 3360.21
LH-II 3133.74 3433.04 2908.37 3205.15
TPS-Nobre 3118.05 3477.95 2808.72 3187.27
Gen 96A28 3076.95 3355.76 2835.76 3129.90
CNFC 8065 3027.96 3338.57 2706.92 3064.22
Pérola 2958.06 3300.49 2542.33 2971.19
CNFP 8100 2957.99 3300.36 2545.81 2972.63
LP-98-20 2949.83 3145.67 2719.71 2960.66
CNFC 8066 2920.4 3170.49 2584.83 2916.11
LP-98-19 2916.86 3230.85 2508.43 2917.07
LP-97-13 2882.59 2985.71 2718.43 2869.62
IAC-Carioca Eté 2880.64 3100.27 2677.15 2916.49
CNFP 7726 2860.52 3170.36 2416.63 2842.98
IAC-UNA 2806.07 3000.09 2364.53 2724.04
Gen 96A58 2801.45 2997.10 2458.72 2763.26
CII-102 2791.61 2989.51 2440.58 2751.09
Gen 96A13 2710.59 2898.13 2310.52 2642.90
Gen 96A10 2325.09 2371.07 1807.79 2126.41
Pearson Correlation r = 1.00 r = 0.92** r = 0.96** r = 0.98**
We must underline the importance of the proximity between the predicted and observed results in 2001. Comparing the results, the means observed in 2001 were similar to those obtained in 2001/2002. According to Table 3, in relation to the means of 2001/2002, the first four lines of the carioca tegument with the first, second, fourth and fifth predicted value can be recommended for cultivation in the state of São Paulo based on the predictive models, due to the gain percentage (g%) which was superior in relation to the control cultivars Pérola and IAC-Carioca Eté. Carbonell et
line Gen 96A31 as statistically superior to the standard cultivars of the group carioca (Pérola and IAC-Carioca Eté) by the Dunnett test (5%). Lines
Gen96A28, CNFC8065 and LH-II were
characterized as promising lines but required an evaluation for more than one year of cultivation, which in this case was the installation of 11 trials in 2002 for the three cultivation periods.
superior lines for sowing in the environment mean. In this regard, the evaluations realized in 2002 could be dismissed, saving costs with the installation of the trials and time for the recommendation of the lines. The proper genetic correlation across the environments (Table 2) was of high magnitude (0.78) and corroborates this statement.
The REML/BLUP methodology of the mixed models proved effective for the estimation of the genetic parameters and the prediction of the genotypic values in this study and can be used routinely in the IAC genetic improvement program for the common bean.
RESUMO
Dezoito genótipos de feijoeiro (Phaseolus vulgaris L.) foram avaliados em 25 ambientes do estado de São Paulo durante os anos de 2001 e 2002. As estimativas de parâmetros genéticos por REML e a predição de valores genotípicos via BLUP foram obtidas por meio do aplicativo computacional Selegen REML/BLUP, seguindo o modelo misto para linhagens. A estimativa da herdabilidade no sentido amplo para produção de grãos foi baixa (0,03), por ser em nível de parcelas individuais e livre dos efeitos da interação com anos, épocas e locais. No entanto, a herdabilidade ao nível de médias de linhagens ao longo dos vários ambientes foi alta (0,75), permitindo alta acurácia (0,87) na seleção de linhagens para plantio no ambiente médio. Dentre os 18 genótipos, nove apresentaram valores genotípicos preditos superiores à média geral. O ganho genético predito com a seleção da melhor linhagem, no caso, a linhagem Gen 96A31 do IAC, foi de 16,25%.
REFERENCES
Bernardo, R. (1996a). Best linear unbiased prediction of maize single-crosses performance. Crop Science 36, 50-56.
Bernardo, R. (1996b). Testcross additive and dominance effects in best linear unbiased prediction of maize single-cross performance. Theoretical And Applied Genetics93, 1098-1102.
Carbonell, S.A.M., Azevedo Filho, J.A., Dias, L.A.S., Garcia, A.A.F., Morais, L.K. (2004), Analyzing common bean environment interactions. Scientia Agrícola62, 169-177.
Carbonell, S.A.M., Azevedo Filho, J.A., Sartori, J.A. (2002), Avaliação preliminar de cultivares e linhagens de feijoeiro para o Estado de São Paulo: 2001. Paper presented at 18th Dia de Campo de Feijão, 23-24 April, Capão Bonito, São Paulo.
Cruz, C.D., Carneiro, P.C.S. (2003), Modelos biométricos aplicados ao melhoramento genético. Editora UFV, Viçosa, 585 pp.
Cruz, C.D. (2001), Programa GENES versão Windows: aplicativo computacional em genética e estatística. EditoraUFV, Viçosa, 648 pp.
Reis, A.J.D., Chaves, L.J., Duarte, J.B., Brasil, E.M. (2005), Prediction of hybrid means from a partial circulant diallel table using the ordinary least square and the mixed model methods. Genetics and Molecular Biology28, 314-320.
Resende, M.D.V. (2002), Genética biométrica e estatística no melhoramento de plantas perenes. Editora Embrapa-SCT, Brasília, 975 pp.
Resende, M.D.V., Dias, L.A.S. (2000), Aplicação da metodologia de modelos mistos (REML/BLUP) na estimação de parâmetros genéticos e predição de valores genéticos aditivos e genotípicos em espécies frutíferas. Revista Brasileira de Fruticultura 22, 44-52.
Resende, M.D.V., Furlani Júnior, E., Moraes, M.L.T., Fazuoli, L.C. (2001). Estimativas de parâmetros genéticos e predição de valores genotípicos no melhoramento do cafeeiro pelo procedimento REML/BLUP. Bragantia60, 185-193.
Simeão, R.M., Sturion, J.A., Resende, M.D.V., Fernandes, J.S.C., Neiverth, D.D., Ulbrich, A.L. (2002), Avaliação genética em erva mate pelo procedimento BLUP individual multivariado sob interação genótipo x ambiente. Pesquisa Agropecuária Brasileira37, 1589-1596.