Prediction of seed-yield potential of common bean populations
Ângela de Fátima Barbosa Abreu
1, Magno Antonio Patto Ramalho
2and João Bosco dos Santos
2 1Embrapa Arroz e Feijão/UFLA, Departamento de Biologia, Lavras, MG, Brazil.
2
Universidade Federal de Lavras (UFLA), Departamento de Biologia, Lavras, MG, Brazil.
Abstract
Earliest possible prediction of seed-yield potential of autogamous crop populations increases breeding program efficiency by saving time and resources. Alternatives for obtaining seed-yield predictions were compared by evaluating four common-bean populations in F1and F2generations together with the parents. Mean components (m
+ a’ and d) and variances were estimated. The potential of each population was predicted by using both these and the Jinks and Pooni (1976) procedure, which allows probability estimation of each population of originating lines surpassing a determined standard. Estimate efficiency was determined by evaluating performances of 62 F5:7
families from each population. Mean component m + a’ estimates obtained for the F1and F2generations proved
efficient in predicting seed yield of F7generation lines as did d for estimate variance among F7generation families. In
addition, the Jinks and Pooni (1976) procedure proved efficient in early prediction of common bean population genetic potentials, especially when using the m + a’ estimate.
Key words:choice of parents, heritability, mean components, common bean,Phaseolus vulgarisL. Received: March 6, 2002; accepted: July 22, 2002.
Introduction
The success of an autogamous-plant breeding gram depends on the choice of populations capable of pro-duce progeny with desired trait combinations. The ideal segregating population makes it possible to select lines with performance superior to that of the parents. Careless choice can cause resource and time loss. Procedures mak-ing possible early discardmak-ing of unpromismak-ing populations have been the objective of several studies (Singh and Urrea,
1995; Oliveiraet al., 1996).
The methodologies used to achieve this goal can be separated into two categories (Baenziger and Peterson, 1991). The first involves procedures using information on
the parents,e.g., average performance, coancestry
coeffi-cient, and multivariate analysis to estimate genetic diver-gence. The second group uses information about progeny behavior from diallel crosses. The methodologies first mentioned rule out simultaneously obtaining information about mean components and variance. The Jinks and Pooni (1976) procedure estimates the probability of obtaining
lines surpassing a given standard in the F∞generation,
con-sidering the average and variance of an earlier generation. This methodology has already been used to evaluate
soy-bean (Triller, 1994) and common soy-bean (Otuboet al., 1996)
populations. However, information confirming its
efficiency is limited.
The aim of this study was to evaluate the efficacy of the Jinks and Pooni (1976) procedure and to find alterna-tives to improve this method in prediction of the seed-yield potential of common bean populations.
Material and Methods
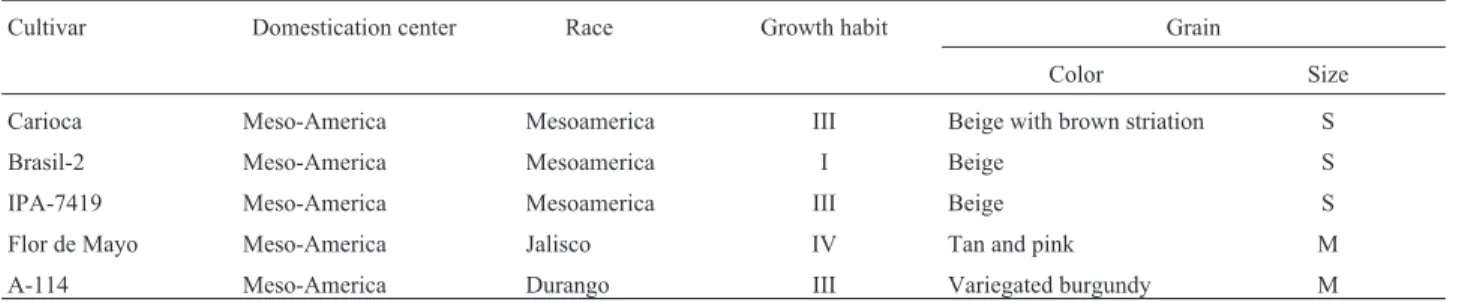
Four segregating populations were chosen from a diallel cross based on divergence among parents and for the purpose of selecting lines with grain type acceptable to con-sumers. The parents are described in Table I.
The F1and F2generations were obtained from
Cari-oca x Brasil-2, CariCari-oca x Flor de Mayo, IPA-7419 x A-114
and Brasil-2 x A-114 crosses. A portion of F2seed was
ad-vanced by the bulk method to F5, from which generation
in-dividual plants were harvested. The F5:6families were again
sown and harvested in bulk to obtain the F5:7families. Two
field experiments were conducted. In the first, the
perfor-mance of the parents, F1and F2generations was evaluated
in field experiments in Lavras, MG, Brazil (21°14’ S lati-tude and 45°00’ W longilati-tude) in July, 1996. The statistical design was randomized complete blocks with five
replica-tions. The five parents (Table I), the four F1generations and
16 F2(four from each cross) were evaluated. The plots
con-sisted of one two-meter row spaced at 0.5 m with 15 seeds sown per meter. The equivalent of 400 kg/ha of the formula
www.sbg.org.br
Send Correspondence to A. de F. B. Abreu. Departamento de Biologia, Universidade Federal de Lavras, C.P. 37, 37200-000 Lavras, MG, Brazil. E-mail: [email protected].
4-14-8 of N, P2O5and K2O fertilizer was used in sowing
and 150 kg/ha ammonia sulphate sidedressing 20 days after emergence. The culture received overhead irrigation. Other cultural practices were those typical for this crop.
The plants were harvested individually and the grain
yield obtained in g/plant. The phenotypic variance (σ2F) of
each plot was estimated and, later, the average phenotypic variance of plots that received identical treatment in the
dif-ferent replications. Genetic variance (σ
G 2
i) of the i
th
popula-tion was estimated byσ σ σ
G 2
F 2
E 2
i 2i i
= − , in which:σ
F 2
2i is
the average phenotypic variance of the F2generation from
ithpopulation, andσ
E 2
i, the average environmental variance
of ithpopulation. Variances of parental cultivars (σ
P 2
1i or
σ
P 2
2i) and F1generation (
σ
F 2
1) were due to environmental
variability. Therefore, the environmental variance (σ
E 2
i)
was estimated as:σ σ σ σ
E 2
P 2
P 2
F 2
i 1i 2i 1i
=( + + ) / 3.
Estimates of mean components m + a’ and d were ob-tained. The term m represents the phenotypic mean of all
possible lines in the F∞generation from crosses between
completely divergent parents. The term a’ is the sum of
ef-fects of fixed loci in the parents,i.e., loci containing
identi-cal alleles; and d is heterozygote deviation in relation to the parents’ mean. The weighted least square method (Rowe and Alexander, 1980) used the following model:
(P1 P2
i + i) / 2 = m + a’i; F1i = m + a’i+ di; F2i = m + a’i+
1/2di, in which P1iand P2i are the means of parents 1 and 2,
respectively, from the ithpopulation, and F
1iand F2iare the
means of F1and F2generations, respectively, from the ith
population. Estimates population m + a’ were compared by
the t test (α= 0.05).
Population seed yield potentials were evaluated using the Jinks and Pooni (1976) procedure. The probability of a population to generate lines surpassing a given standard was estimated; it corresponds to the area to the right of a value in abscissa of the normal distribution. Using the prop-erties of a standardized normal distribution, we calculated this area estimating the variable Z by Z = [x–(m + a’)]/s, in which x is the line mean considered as standard (L), which in this case was the Carioca cultivar; m + a’ is the line mean
seed yield in the F∞generation. In a model without
domi-nance, the mean seed yield of the F2generation (F2i) should
equal line mean in the F∞ generation. Term s is the
phenotypic standard deviation among the lines. Genetic
variance among the lines (σ2L) corresponds to twice the
ad-ditive genetic variance (σ2A) present in the F2generation.
Considering a model without dominance and epistasis, the
phenotypic variance of F2(σF2
2) contains
σ2A+σ2E.
There-fore, 2σ2A= 2σ
F 2
2 - 2
σ2E. Assuming that the environmental
variance among the lines is similar to that of the F2
genera-tion, then s L2 A2 E2 F2 E2
2
= σ = 2σ +σ = 2σ −σ . Thus,
for each ithpopulation, Z L F
i
2
F 2
E 2
i
2i i
= −
−
( )
2σ σ
.
The F5:7families were evaluated in the other field
ex-periment, conducted in Lavras and Patos de Minas, (18°35’ S latitude and 46°31’ W longitude), MG, Brazil at the same time and under the same conditions as the previous one. The statistical design was a 16 x 16 lattice with three repli-cations. Sixty two families from each population, the five parents, and three additional control cultivars were evalu-ated.
Seed yield was measured in g/plot, which was ana-lyzed for variance combined over locations and with a fur-ther joint analysis, considering the following statistical model with all variables random, except the average: Yijks= m + pi+ ls+ plis+ rj(s)+ bk(js)+ eijks; in which Yijks:
pro-duction of i family , in the k block, j replication, s location;
m: general mean; pi: effect of i family, being i = 1, 2, ...,
256; ls: effect of s location, being s = 1, 2; plis: effect of the
interaction of i family with s location; rj(s): effect of j
repli-cation within s lorepli-cation; bk(js): effect of k block, within j
rep-lication and s location; eijks: average effective error.
Based on expected mean squares, the estimates of ge-netic and phenotypic variances among family averages
from the ithcrossing were obtained. Broad sense heritability
(h2
i) was estimated using the Vencovsky and Barriga
(1992) methodology. Upper and lower limits of confidence
intervals at 1 -α= 0.95 probability level were estimated for
heritabilities (Knappet al., 1985).
Table I- Traits of common bean cultivars used in the cross.
Cultivar Domestication center Race Growth habit Grain
Color Size
Carioca Meso-America Mesoamerica III Beige with brown striation S
Brasil-2 Meso-America Mesoamerica I Beige S
IPA-7419 Meso-America Mesoamerica III Beige S
Flor de Mayo Meso-America Jalisco IV Tan and pink M A-114 Meso-America Durango III Variegated burgundy M
Results and Discussion
The estimate of m + a’ corresponds to the mean of all
possible lines of a given cross in the F∞ generation
(Vencovsky, 1987). In this study, m + a’ values varied from 7.72 g/plant, Brasil-2 x A-114 population, to 13.36 g/plant, Carioca x Flor de Mayo population (Table II). All contrasts in these estimates were significant. Therefore, one can infer that the Carioca x Flor de Mayo population will produce
lines with a higher average in the F∞generation.
Contrary to the estimates for m + a’ , largest d esti-mates were obtained in the IPA 7419 x A-114 and Brasil-2 x A-114 populations (Table II). Dominance for seed yield was demonstrated in these populations by the superiority of
the F1generation’s average in relation to the parent and F2
generation averages, in agreement with several studies re-porting heterosis for the common bean grain yield (Ghaderi
et al., 1984; Gutiérrez and Singh, 1985; Nienhuis and Singh, 1986).
Since the d estimate refers to the contribution of het-erozygous loci in relation to the parents’ mean, assuming all loci have equal effects, one can infer that IPA 7419 x A-114 and Brasil-2 x A-114 populations had the greatest number of heterozygous loci. Therefore, more variation in
the F2and later generations would be expected from these
two populations. The estimates of F2genetic variance
esti-mates presented in Table II support this observation. The Carioca x Brasil 2 population d estimate was null, and in
this case the F2generation genetic variance estimate was
negative. Therefore it could be considered null indicating absence of genetic variation, that is, the most loci were fixed and d is null.
Most procedures evaluating the potential of segregat-ing populations only consider average performance, with little or no emphasis on population variability. This
estima-tion requires data on individual plants in the F2generation.
This process can be very laborious and is usually associated with high error. The results here obtained show that, in the presence of dominance, the d estimate could substitute the genetic variance estimate. Since this parameter is a mean component of any trait, it is, thus, estimable with greater precision than variance, without having to obtain data from
individual plants. However, the F1and F2generations must
be evaluated simultaneously, because producing a
suffi-cient number of F1seed for crops such as thecommonbean
where manual crossings are laborious and may be difficult,
an alternative is to evaluate the F2and F3generation
perfor-mances (Oliveiraet al., 1996).
Estimates of m + a’ and d provide plant breeders with information needed to decide which segregating popula-tions will be more promising. As already mentioned, m + a’
corresponds to the mean of n lines in the F∞generation, and
d would be the variation indicator among the lines. The ideal is a segregating population with high m + a’ and d val-ues, because this population should produce lines with high mean yields and great variation, an important goal for plant breeders.
Analysis of variance of F5:7family seed yield is
pre-sented in Table III. Significant difference occurred among the lines for all populations, except Carioca x Brasil-2. Family x location interactions were significant only in Carioca x Flor de Mayo and A-114 x Brasil-2 populations. The broad-sense heritability estimates presented in Table IV varied from 18.5% for the Carioca x Brasil-2 cross, to 52.4% for the Brasil-2 x A-114 cross. In selecting more promising populations, plant breeders usually take heri-tability estimates into consideration. However, the results of this study point out populations having higher heri-tability and populations presenting the lowest average among all families (Table V). Therefore, heritability alone does not guarantee breeding program success, since it could be associated with inferior average yield. Populations with high mean yields and sufficient variability are the most promising.
Correlations between d and h2and between m + a’
and the mean yield of F5:7families were estimated. Between
d and h2, it was positive and high (r = 0.95), indicating
asso-ciation of d with genetic variance. The m + a’ estimate had
0.97 correlation with the mean yield of F5:7families,
sup-porting the theory that this estimate reflects family average in further generations (Vencovsky, 1987).
For the Jinks and Pooni (1976) procedure, ‘Carioca’ was considered as the productive cultivar standard, besides being the most widely cultivated in Brazil. The probability estimates for obtaining lines superior to the Carioca cultivar are presented in Table VI. Probability estimates
were obtained using two procedures: considering the F2
Table II- Mean yield, in g/plant, of the parents, F1iand F2igenerations and estimates of the genetic variance of the F2(σG2
i) generation and mean
compo-nents (m + a’iand di) of each i population.
Crossings (P1+ P2)/2 F1 F2 σG2
i m + a’i di
Carioca x Brasil-2 12.054 12.087 11.439 -7.699 11.552 (0.618)1/ 0.110 (1.080)
Carioca x F.Mayo 13.864 14.144 12.478 4.553 12.997 (1.376) 0.127 (2.394) IPA-7419 x A-114 10.256 13.619 10.700 12.605 9.726 (1.015) 2.918 (1.878) Brasil-2 x A-114 7.904 12.854 9.812 7.472 7.720 (0.418) 4.597 (0.832)
generation mean or the m + a’ estimate as the mean of lines
in the F∞generation. Since dominance in seed yield was
de-tected, the F2generation mean, besides m + a’, will have
half the contribution of loci in heterozygosis (F2= m + a’ +
1/2d). However, the differences in probability estimates were not pronounced, except for the Brasil-2 x A-114 popu-lation, where the highest d estimate was obtained. Use of
the F2generation mean to represent the F∞average was
pro-posed by Jinks and Pooni (1976) and has been used by some
researchers (Triller, 1994; Otuboet al., 1996). Although
dominance for seed yield is reported frequently, most gene action in the common bean is additive (Nienhuis and Singh,
1988; Ramalhoet al., 1988; Abreu, 1989; Takeda, 1990).
Therefore, the F2generation mean can be considered,
be-cause even with an inflated probability estimate, the choice of best populations should not be affected. However, the m + a’ estimate can be easily obtained and does not depend on occurrence of dominance.
The population with the greatest chance of producing lines superior to the Carioca cultivar came from the Carioca
x Flor de Mayo population; the worst was the Brasil-2 x A-114 population (Table VI). These results agree with
esti-mates of specific combining ability obtained by Abreuet al.
(1999) and with the previously reported m + a’ estimates. Mean grain yield varied from 221.9 to 357.9 g/plot in the Carioca x Brasil-2 population; from 177.9 to 344.9 g/plot for the Carioca x Flor de Mayo population; 181.9 to 316.9 g/plot for IPA-7419 x A-114, and from 146.8 to 305.8 g/plot for the Brasil-2 x A-114 population. The high-est mean, considering all lines, was observed in the Carioca x Flor de Mayo population and the lowest in the Brasil-2 x A-114 population (Table V), again agreeing with the m + a’ estimates (Table II).
Twenty-nine percent of the F5:7 families from the
Carioca x Flor de Mayo crossing had mean yields greater Table III- Joint analysis of variance of seed yield, in g/plot, of F5:7
fami-lies from the crossings among common bean cultivars, evaluated in Lavras-MG and Patos de Minas-MG, Brazil.
Source of variance Degrees of freedom
Mean square
p1/
Locations (L) 1 1053156.540 0.000 Families (F) 255 10349.989 0.000 Carioca x Brasil-2 61 4033.602 0.135 Carioca x Flor de Mayo 61 7663.353 0.000 A-114 x IPA-7419 61 6548.079 0.000 A-114 x Brasil-2 61 10103.986 0.000 Parents (P) 4 12301.155 0.005 Checks (C) 2 9015.645 0.068 Between crossings (B) 3 259936.589 0.000 Bvs.P 1 16396.906 0.027 B and Pvs.C 1 46524.390 0.000
F x L 255 4483.613 0.001
(Carioca x Brasil-2) x L 61 3286.569 0.521 (Carioca x Flor de Mayo) x L 61 5668.220 0.000 (A-114 x IPA-7419) x L 61 3253.034 0.543 (A-114 x Brasil-2) x L 61 4806.424 0.017
P x L 4 2182.118 0.627
C x L 2 14948.070 0.012
B x L 3 19525.501 0.000
(Bvs.P) x L 1 6273.792 0.171 (B and Pvs.C) x L 1 1977.285 0.443 Mean effective error 930 3338.104
Mean 264.9
Coefficient of variation (%) 21.8
1/Level of probability used in the F test.
Table IV- Genetic variance (σG2
i) and broad sense heritability (h 2
i) with
their respective confidence intervals, grain yield (g/plot) of F5:7lines from
four common bean populations evaluated in Lavras-MG and Patos de Minas-MG, Brazil.
Crossings σG2
i h
2
i(%) LLi1/ ULi2/
Carioca x Brasil-2 124.506 18.52 -35.23 50.91 Carioca x Flor de Mayo 332.522 26.03 -22.76 55.43 IPA-7419 x A-114 549.174 50.32 17.55 70.07 Brasil-2 x A-114 882.927 52.43 21.05 71.34
1/Lower limit of the heritability estimate;2/Upper limit of the heritability
estimate.
Table V- Mean grain yield (g/plot) of the parents (P1ie P2i) and F5:7
fami-lies from each ithpopulation and percentage of families superior to the
Carioca cultivar (PSC). Lavras-MG and Patos de Minas-MG, Brazil.
Crossings P1i P2i Families PSC Carioca x Brasil-2 246.3 243.3 285.8 16.1 Carioca x Flor de Mayo 246.3 283.9 286.4 29.0 IPA-7419 x A-114 266.4 165.6 254.9 4.8 Brasil-2 x A-114 243.3 165.6 231.8 0.0
Table VI- Mean yield (F2i), in g/plant, and estimates of phenotypic
vari-ance (σ$F2
2 i) of F2generation, environmental variance (σ$E 2
i) and probability
(%) of obtaining lines superior in yield to the Carioca cultivar (PSC).
Crossings F2i σ$F2 2 i σ$E
2
i PSC
1/ PSC2/
Carioca x Brasil-2 11.439 40.152 47.851 21.67 23.81 Carioca x F.Mayo 12.478 58.494 53.941 33.32 37.42 IPA-7419 x A-114 10.700 46.433 33.828 24.92 21.52 Brasil-2 x A-114 9.812 38.531 31.058 18.46 11.37
1/Probability of obtaining lines superior in yield to the Carioca cultivar,
us-ing F2i.
2/Probability of obtaining lines superior in yield to the Carioca cultivar,
than the Carioca average (p≤0.05) (Table V), similar to the estimate previously reported by Jinks and Pooni (1976) (Table VI). In the case of the Brasil-2 x A-114 population,
no F5:7lines had seed yield superior to the Carioca cultivar
(Table V), in agreement with the previous results and show-ing that the probability of obtainshow-ing lines superior to this cultivar would be lower in this population (Table VI).
Comparison of the observed probability of obtaining lines superior in yield to ‘Carioca’ with expected probabil-ity (Tables V and VI) shows agreement in the results obtained, as already mentioned. However, the estimated probability was always superior. For this reason, some fac-tors must be considered. The first is the relatively small 62 lines sample used to represent the population. Although no reports exist in the literature about the number of lines that should represent a segregating population of autogamous plants, Fouilloux and Bannerot (1988) showed that the pop-ulation need not be large for selective success. They then suggested, after evaluating 10,000 families, that the maxi-mum number of favorable alleles accumulated in the best line would be 32 out of 40. This number would not be much lower if only 100 families had been evaluated, which could accumulate, in the best line, 27.9 favorable alleles. The
sec-ond factor is F2generation genetic variance which contains
not only additive variance, but also dominance and epistasis. Therefore, the line phenotypic deviation standard becomes inflated and, consequently, so does the estimated probability. In conclusion, despite the slight discrepancy observed, the Jinks and Pooni (1976) procedure proved an excellent alternative in early selection of autogamous crop segregating populations, especially if used with the m + a’ estimate.
Acknowledgement
Research was supported by Fundação de Amparo à Pesquisa do Estado de Minas Gerais (FAPEMIG), Minas Gerais, Brasil.
References
Abreu A de FB (1989) Avaliação de progênies de feijoeiro do cruzamento “Carioca 80” x “Rio Tibagi” em diferentes den-sidades de plantio. M.S. thesis, Escola Superior de Agri-cultura de Lavras, Lavras.
Abreu A de FB, Ramalho MAP and Santos JB dos (1993) Capa-cidade de combinação de cultivares de feijão de diferentes conjuntos gênicos. In: IV Reunião Nacional de Pesquisa de Feijão, Londrina, PR, Resumos, 120.
Abreu A de FB, Ramalho MAP and Ferreira DF (1999) Selection potential for seed yield from intra- and inter-racial popula-tions in common bean. Euphytica 108:121-127.
Baenziger PS and Peterson CJ (1991) Genetic variation: Its origin and use for breeding self-pollinated species. In: Stalker HT
and Murphy JP (eds.) Plant breeding in the 1990’s. North Carolina State University, Raleigh, pp 69-100.
Fouilloux G and Bannerot H. (1988) Selection methods in the common bean (Phaseolus vulgarisL.). In: Gepts P (ed) Ge-netics resources of Phaseolus beans. Kluwer Academic Pub-lishers, Dordrecht, pp 503-541.
Ghaderi A, Adams MW and Nassib AM (1984) Relationship be-tween genetic distance and heterosis for yield and morpho-logical traits in dry edible bean and faba bean. Crop Sci 24:37-42.
Gutiérrez JA and Singh SP (1985) Heterosis and inbreeding de-pression in dry bush beans,Phaseolus vulgarisL. Can J Pl Sci 65:243-249.
Jinks JL and Pooni HS (1976) Predicting the properties of recom-binant inbred lines derived by single seed descent. Heredity 36:253-266.
Knapp SJ, Stroup WW and Ross WM (1985) Exact confidence in-tervals for heritability on a progeny mean basis. Crop Sci 25:192-194.
Nienhuis J and Singh SP (1986) Combining hability analyses and relationships among yield, yield components and architec-tural traits in dry bean. Crop Sci 26:21-27.
Nienhuis J and Singh SP (1988) Genetics of seed yield and its components in common bean (Phaseolus vulgarisL.) of Middle-American origin. I. General combining ability. Plant Breeding 101:143-154.
Oliveira LB de, Ramalho MAP, Abreu A de FB and Ferreira DF (1996) Alternative procedures for parent choice in a breed-ing program for the common bean (Phaseolus vulgarisL). Braz J Genet 19:611-615.
Otubo ST, Ramalho MAP, Abreu A de FB and Santos JB dos (1996) Genetic control of low temperature tolerance in ger-mination of the common bean (Phaseolus vulgaris L.). Euphytica 89:313-317.
Ramalho MAP, Santos JB dos and Pereira Filho IA (1988) Choice of parents for dry bean (Phaseolus vulgarisL.) breeding. I. Interation of mean components by generation and by loca-tion. Rev Bras Genet 11:391-400.
Rowe KE and Alexander WL (1980) Computations for estimating the genetic parameters in joint-scaling tests. Crop Sci 20:109-110.
Singh SP and Urrea AC (1995) Inter- and intraracial hybridization and selection for seed yield in early generations of common bean,Phaseolus vulgarisL. Euphytica 81:131-137. Takeda C (1990) Avaliação de progênies de feijoeiro do
cruza-mento “ESAL 501” x “A 354 em diferentes densidades de plantio. M.S. thesis, Escola Superior de Agricultura de La-vras, Lavras.
Triller C (1994) Previsão do potencial genético de cruzamentos em soja pela geração F3. M.S. thesis, Universidade Estadual
de Londrina/ Empresa Brasileira de Pesquisa Agropecuária/ Instituto Agronômico do Paraná, Londrina.
Vencovsky R (1987) Herança quantitativa. In: Paterniani E and Viegas G (eds) Melhoramento e produção de milho no Brasil. Fundação Cargill, Campinas, pp 137-209.