Productive performance of soybean cultivars grown in different plant densities
Desempenho produtivo de cultivares de soja cultivadas em diferentes densidades de plantas
Augusto Belchior Marchetti Ribeiro1 Adriano Teodoro Bruzi1 Alan Mario Zuffo2* Everton Vinicius Zambiazzi1 Igor Oliveri Soares1 Nelson Júnior Dias Vilela1 José Luiz de Andrade Rezende Pereira3 Silvino Guimarães Moreira1
ISSNe 1678-4596
INTRODUCTION
Soybean [Glycine max (L.) Merrill] is the main product of Brazilian agribusiness. Brazil is the largest exporter and second largest producer with 96 million tons harvested in the 2015/2016 crop (CONAB, 2016). The expansion of cultivated areas is related to technological advances, among which stand out the phytosanitary management, improvement of physical, chemical and biological qualities of the soil,
transgenic cultivars, high adaptability genotypes, suitable sowing time and population density (ANDRADE et al., 2016).
Currently, some soybean producers, aiming to increase grain yield, opted for dense sowing in soybean cultivation (PETTER et al., 2016). Interaction between plant, production environment and
management will define the culture yield. High yields
are obtained when the genotype presents productive potential and high adaptability, all this combined with
1Departamento de Agricultura, Universidade Federal de Lavras (UFLA), Lavras, Minas Gerais, Brasil.
2Departamento de Produção Vegetal, Universidade Estadual do Mato Grosso do Sul (UEMS), BR 306, Km 6, Cassilândia, MS, Brasil. E-mail: alan_zuffo@hotmail.com. *Corresponding author.
3Instituto Federal de Educação, Ciência e Tecnologia do Sul de Minas Gerais, Campus Inconfidentes, Inconfidentes, MG, Brasil.
ABSTRACT: Plants density in soybean cultivation is an important management practice to achieve high grain yield. In this way, the objective was to evaluate the agronomic traits and grain yield in soybean in different plant densities, in two locations in the south of Minas Gerais. The experimental design was in randomized blocks, arranged in a split plot design, with three replications. Plots were composed of four population densities (300, 400, 500 and 600 thousand plants per hectare) and the subplots were composed of six cultivars (‘BMX Força RR’, ‘CD 250 RR’, ‘FMT 08 – 60.346/1’, ‘NA 5909 RR’, ‘TMG 7161 RR’ and ‘V – TOP RR’) grown in Lavras and Inconfidentes, both in Minas Gerais. At the time of harvest was determined the plant height, lodging, insertion of the first pod, harvest index, number of pods per plant, number of grains, number of grains per pod and yield. Regardless of the soybean cultivar, the plant density of up to 600,000 per ha does not affect grain yield, plant height, lodging, harvest index, and number of grains per pod. The cultivars ‘V-TOP RR’ and ‘BMX FORÇA RR’ showed high grain yield
and good agronomic traits in Lavras and Incofidentes.
Key words: Glycine max(L.)Merrill, environments, plants spatial arrangement, yield.
RESUMO: A densidade de plantas no cultivo de soja é uma prática de manejo relevante para o alcance de alta produtividade de grãos. Dessa forma, objetivou-se avaliar os caracteres agronômicos e produtividade dos grãos na soja em diferentes densidades de plantas. O delineamento experimental utilizado foi o de blocos casualizados, dispostos em esquema de parcelas subdivididas, com três repetições. As parcelas foram compostas por quatro densidades populacionais (300, 400, 500 e 600 mil plantas por hectare) e, as subparcelas foram compostas por seis cultivares (‘BMX Força RR’, ‘CD 250 RR’, ‘FMT 08 – 60.346/1’, ‘NA 5909 RR’, ‘TMG 7161 RR’ e ‘V – TOP RR’) cultivados em Lavras e Incofidentes, ambos em Minas Gerais. Na ocasião da colheita determinou-se a altura de plantas, o acamamento, a inserção do primeiro legume, o índice de colheita, o número de vagens por planta, o número de grãos, o número de grãos por vagem e a produtividade. Independentemente da cultivar de soja, a densidade de plantas de até 600.000 por ha, não afeta o rendimento de grãos, altura da planta, acamamento, índice de colheita e número de grãos por vagem. As cultivares ‘V-TOP RR’ e ‘BMX FORÇA RR’ apresentaram alto rendimento de grãos e boas características agronômicas em Lavras e Incofidentes.
Palavras-chave: Glycine max(L.) Merrill, ambientes, arranjo espacial de plantas, produtividade.
2 Ribeiro et al.
the cultivation and management systems required by the culture (MAUAD et al., 2010).
For BALBINOT JUNIOR et al. (2016),
plant density can significantly affect the closing
speed of interlines, phytomass production, architecture of plants, diseases severity, lodging and
crop yield. Genotype directly influences the response
to different sowing densities, that is, some cultivars have better performance in high populations, while others have better performance at lower densities (DUTRA et al., 2007).
In this context, PROCÓPIO et al. (2013) claimed that the spatial arrangement of plants affects the use of light, water and nutrients, which
can reflect the production of phytomass and grain
yield. LIMA et al. (2012) also commented that the setting of the sowing density is an important tool in the optimization of plant growth, biomass gain and grain production.
SOARES et al. (2015), in research
conducted in Minas Gerais, confirmed that there is
an interaction between the densities of sowing and soybean cultivars and showed that the population of 300 thousand plants per hectare is the most suitable for cultivation in the evaluated sites. Results obtained by LUDWIG et al. (2011) also corroborate the existence of cultivars x population interaction. Evaluating different soybean cultivars in three plant populations (250, 400 and 550 thousand plants ha-1), the authors obtained better
results for the population of 550 thousand plants ha-1. Conversely, PETTER et al. (2016) reported
that densities of 200 and 300 thousand plants m–2 provided higher grain yield and better use of photosynthetically active radiation efficiency.
Therefore, plant density in soybean cultivation is an important management tool in order to maximize grain yield, thereby reducing production costs. In addition, with the increase in area sown with soybean culture in southern Minas Gerais, especially with early maturing soybean cultivars due to the expansion of the corn cultivation of the second crop, the study of soybean cultivars performance is necessary for different population densities in the region. In this way, the objective was to evaluate the agronomic traits and grain yield in soybean cultivars adopting different plant densities in two locations in the south of Minas Gerais.
MATERIALS AND METHODS
The experiment was conducted at two different locations in the state of Minas Gerais,
in the agricultural year of 2014/2015: a) in the
experimental area located in the Scientific and
Technological Development Center in Agriculture – Muquém from the Universidade Federal de Lavras (UFLA), located in the city of Lavras at a latitude of 21°14’S, longitude 45°00’W and altitude of 918m. The chemical and physical composition of the typical Dystroferric Red Latosol (0-0.20
m) presented pH (H2O): 5.7; Y (Mehlich method):
24.6mg dm–3; K+: 116mg dm–3; Ca2+: 3.3cmolc dm– 3; Mg2+: 0.6cmolc dm–3; Al3+: 0cmolc dm–3; H++Al3+
: 2.8cmolc dm–3; V: 58%; O.M.: 3.4g kg–1.; Clay:
64dag kg-1; Silt: 12dag kg-1; Sand: 24dag kg-1. b)
in the experimental area of the Instituto Federal de Educação, Ciência e Tecnologia (Ifsuldeminas) –
South of Minas Gerais) in Inconfidentes, located
at a latitude of 22°19’S, longitude 46°19’W an altitude of 864m. The chemical and physical composition of the typical Dystroferric Red Latosol
(0-0.20m) presented pH (H2O): pH (H2O): 5.9; Y
(Mehlich method): 41.8mg dm–3; K+: 121.6mg dm– 3; Ca2+: 2.9cmolc dm–3; Mg2+: 0.6cmolc dm–3; Al3+:
0,2cmolc dm–3; H++Al3+: 4.0cmolc dm–3; V: 83.5%;
O.M.: 2.2g kg–1; Clay: 64dag kg-1; Silt: 20dag kg-1;
Sand: 16dag kg-1. Results of the climatic data are shown in figure 1.
The no-tillage system was adopted and sowing was carried out manually in November. The fertilization consisted of 350kg ha-1 of the
formulation of N-P2O5-K2O (02-30-20) according to the recommendations of the COMISSÃO DE FERTILIDADE DO SOLO DO ESTADO
DE MINAS GERAIS (1999). Bradyrhizobium
japonicum bacteria were inoculated via furrow
after soybean sowing. The dose of Bradyrhizobium japonicum was 18mL p. c. kg-1 of seed - strains
SEMIA 5079 and 5080, containing 10.8 x 10⁶UFC inoculant-1 seeds Nitragin Cell Tech HC®
(3x10⁹UFC mL-1).
The application of microorganisms was performed using a motor-driven knapsack sprayer, coupled to the bar with four XR 110.02 spray nozzles, applying a spray volume equivalent to 150L ha-1. Each plot consisted of 4 sowing rows of
5m in length, spaced 0.50m, the area of each plot being 10m2 (5m x 2m). As a useful area, the two
central rows with 0.50m clearance were considered at the ends.
of six cultivars from different sources (Table 1). The cultivars were selected because they showed similarity in the maturity and growth habit group.
Cultural treatments (weeds, pests and diseases control), before and after sowing, were the recommended for the region and according to the crop needs.
At harvest, the following characteristics
were evaluated: a) insertion of the first legume - measured by the distance from the soil to the first legume (cm), assessing five random plants per plot;
b) plant height - obtained by the distance from the
soil to the apex of the plant (cm), assessing five
random plants per plot; c) plant lodging - lodging
index was estimated according to the scale proposed by BERNARD et al. (1965), assigning scores from 1
to 5 according to the following classification: 1 = all the erect plants, 2 = some inclined plants or slightly lodged, 3 = all plants moderately inclined or 25 to 50% lodged, 4 = all plants severely inclined or 50 to 80% lodged and 5= all lodged plants; d) harvest index (HI) - determined by the ICG formula = grain yield/
grain yield + straw; e) number of pods and f) number
of grains per pod – manual counting of five plants
per plot; g) grain yield - standardized for the grain humidity of 13% in kg ha-1.
Analyses of individual and joint variances were carried out adopting the statistical model and the analysis procedure similar to that presented by
RAMALHO et al. (2012). Analyses of variances
were performed using the SISVAR® (FERREIRA, 2014) statistical program. For significant qualitative
factors, the study of average values was carried out using the Scott-Knott test (1974) at 5% of
significance, while the quantitative factors were
submitted to polynomial regression analysis using the SigmaPlot® computer program.
RESULTS AND DISCUSSION
For the density factor it was observed no difference in yield, plant height, lodging, harvest
Figure 1 - Monthly averages of rainfall and air temperature in the studied sites during the experiments in the agricultural year of 2014/2015. Source: Instituto Nacional de Meteorologia (INMET).
Table 1 -Cultivars and their respective characteristics.
Cultivar Maturity Group Growth Habit
‘BMX FORÇA’ 6.2 Indefinite
‘CD 250 RR’ 5.5 Indefinite
‘FMT 08-60.346/1’ 5.8 Indefinite
‘NA 5909 RR’ 5.9 Indefinite
‘TMG 7161 RR’ 5.9 Indefinite
4 Ribeiro et al.
index and number of grains per pod. This fact was not expected, since the sowing density is directly related to these factors. LIMA et al. (2012), claimed that the adjustment in plant density is an important tool in grain yield. According to TOURINO et al. (2002), there is a direct relationship between plant density and lodging, it is expected that an increase in the population will increase lodging.
In literature, other studies showed low response of soybean grain yield to plant density
variations (DE LUCA & HUNGRIA, 2014;
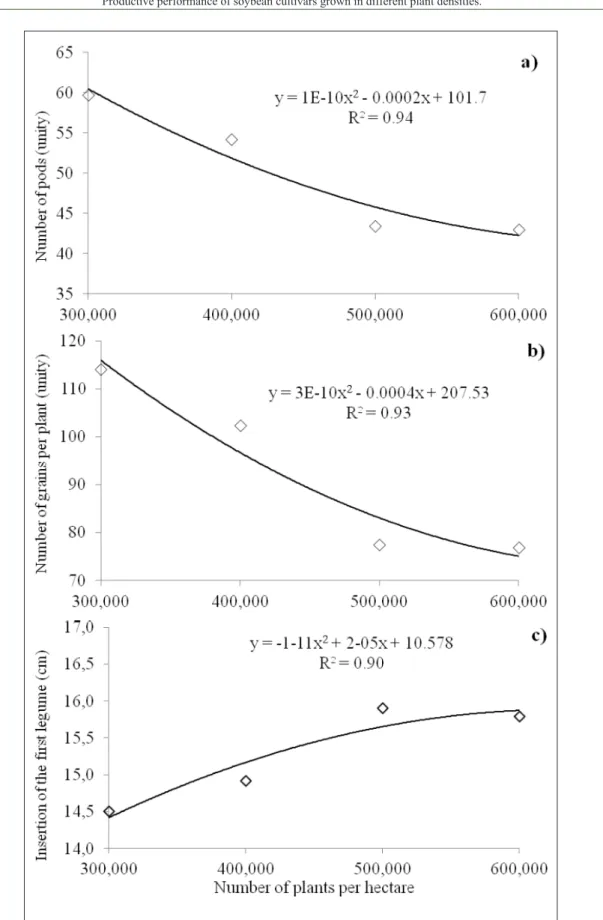
BALBINOT JUNIOR et al., 2015). These results may be related to the high phenotypic plasticity of soybean. According to COOPERATIVE EXTENSION SERVICE AMES (1994), plasticity is the capacity of plants and, change their morphology and grains yield depending on the plant density, promoting the maintenance of grain yield in a wide density range. Thus, at low densities, soybean plants tend to produce more branches and; consequently, increase the number of pods per plant and the number of grains per pod
as evidenced in figures 2a and 2b, respectively.
Therefore, there was compensation of the smaller number of plants per area, which resulted in greater production per individual.
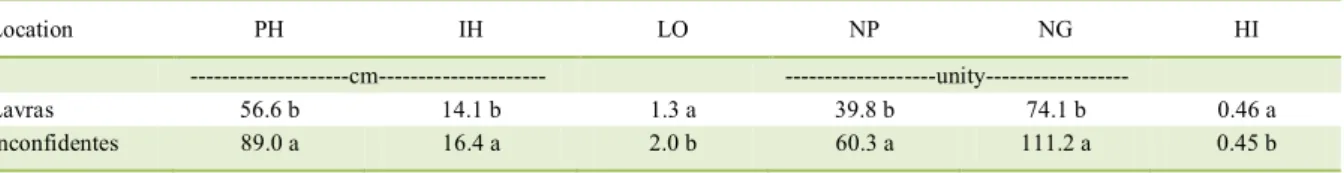
For the local variation source, there was an effect on plant height, height of the first pod insertion, lodging, harvest index, number of pods and number of grains (Table 2). In this way, it can be affirmed that environmental factors such as soil fertility, rainfall occurrence and even temperature fluctuations influenced the manifestation of these characters.
The location x density interaction was
significant only for number of pods and number of
grains (Table 2). This fact was reported by SOARES
et al. (2015), in which sowing density influences
competition for soil resources such as water and nutrients and light absorption.
Regarding cultivars, no differences on the
lodging, the insertion height of the first pod and the
harvest index were observed. The evaluated cultivars are from different sources but present similarity in the group of maturity and growth habit, yet, there are differences in the genetic background and other attributes, ensuring the existence of variability in the present study.
The cultivar x density interaction was
not significant for any character. Thus, it can be
considered that the agronomic characters and the productive performance of the early-cycle soybean cultivars used in this study are independent of the
plant density that was used. Conversely, the C x H interaction was significant for yield, height insertion of the first pod and number of grains per pod. Results
reinforce the need to evaluate tests in different locations, to capitalize on the effects propitiated by cultivation sites.
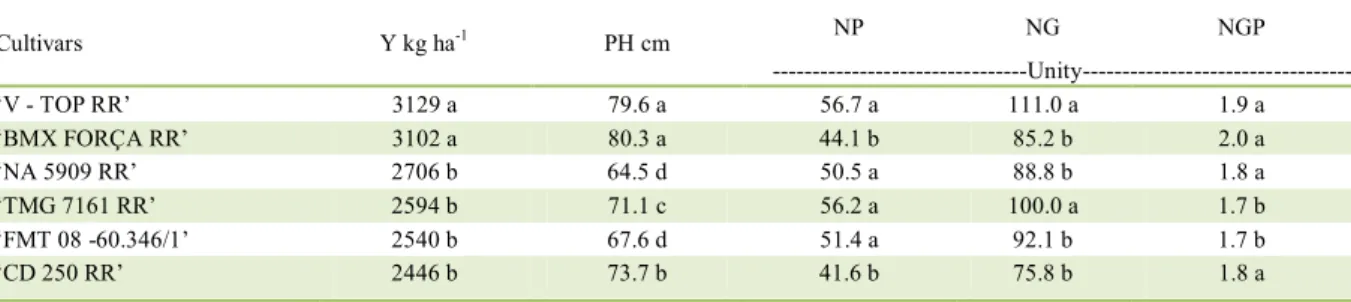
Average yield of grains showed a wide variation for cultivars and reported the lowest average (2446kg ha-1) in the ‘CD 250 RR’ cultivar
and the largest estimation (3129kg ha-1) in the ‘V –
TOP RR’ cultivar. For the characteristic of plants height, reported to be satisfactory in mechanical harvesting for all cultivars, causing a variation of 64.50 and 80.38 cm in cultivars ‘NA 5909 RR’ and ‘BMX FORÇA RR’, respectively (Table 2). Depending on the photoperiodic response of the cultivar, the plant can have reduced height and legumes formation very close to the ground. Therefore, it is considered, plant heights between 60 and 120 as suitable for mechanized harvesting. Among the cultivars, number of pods per plant ranged between 41.6 and 56.7 units for cultivars ‘CD 250 RR’ and ‘V – TOP RR’, respectively. For the number of grains per pod, there was a variation between 75.85 and 111 for cultivars ‘CD 250 RR’ and ‘V – TOP RR’, respectively. As for the number of grains per legumes, fit was reported average values between 1.74 and 2.01 for cultivars ‘TMG 7161 RR’ and ‘BMX FORÇA RR’, respectively (Table 3).
For different locations and cultivars, there was a wide variation of grain yield. The location with greater emphasis was Lavras and the ‘V-TOP RR’ cultivar obtained an average yield of 3,204kg ha-1. Referring to insertion height of the first pod,
all cultivars and locations analyzed were favorable to mechanized harvesting. For the number of grains per legume, the cultivars ‘BMX FORÇA RR’ and ‘V – TOP RR’ reported better performance.
Regarding the locations, Lavras reported better values in relation to plant height, the height
insertion of the first pod, number of pods per plant
and number of grains. This fact may be related to weather conditions during the experiment (Table 4). Regarding the lodging of plants and the harvest index, satisfactory results were obtained in both locations (Table 4). According to literature, these characteristic are dependent on the genotype, environment, climate, agricultural year, humidity, among others (LAMBERT et al., 2007).
Figure 2 - Number of pods (a), number of grains per pod (b) and insertion height of the first pod (c) four population densities (300, 400, 500 and 600 thousand plants per hectare), in the locations
6 Ribeiro et al.
number of plants per hectare inhibited the development of pods and consequently the number of grains. According to (PIRES et al., 2000) a better distribution of plant arrangement in the area is an environmental factor crucial for high yields, the decrease in the number of pods may have been caused by the fact that there is increased competition for water, nutrients and sunlight.
For the insertion height of the first pod
(Figure 2c), it can be observed that that the increase in the number of plants per hectare provides an increase in insertion height. This occurred since soybean plants tend to etiolate with the presence of more plants per area due to increased competition. It
should be stressed that the first pod insert increment is
disadvantageous; therefore, promotes the formation of soybean plants with low stem exploration, that is, stems with no pods and, consequently, a reduction in the culture’s yield potential.
The south of Minas Gerais, an important region in coffee production and an important dairy basin, presents an increasing interest in soybean cultivation, with maize as a perfect ally in crop
rotation (CARVALHO et al., 2010) aiming the
second cropping season. Therefore, the early ‘V-TOP RR’ and ‘BMX FORÇA RR’ cultivars are indicated
for Lavras and Incofidentes, because they are more
productive. Regardless of the cultivars, productive performance of soybean cultivars does not depend on the used plant density.
CONCLUSION
Regardless of the soybean cultivar, the plant density of up to 600,000 per ha, did not affect grain yield, plant height, lodging, harvest index, and number of grains per pod. The ‘V-TOP RR’ and
Table 2 -Joint averages table for characters yield (Y), plant height (PH), number of pods (NP), number of grains (NG) and number of grains per pod (NGP) to six cultivars (‘BMX Força RR’, ‘CD 250 RR’, ‘FMT 08 – 60.346/1’, ‘NA 5909 RR’, ‘TMG 7161 RR’ and ‘V – TOP RR’) in different locations, in the agricultural year 2014/2015.
Cultivars Y kg ha-1 PH cm NP NG NGP
---Unity---
‘V - TOP RR’ 3129 a 79.6 a 56.7 a 111.0 a 1.9 a
‘BMX FORÇA RR’ 3102 a 80.3 a 44.1 b 85.2 b 2.0 a
‘NA 5909 RR’ 2706 b 64.5 d 50.5 a 88.8 b 1.8 a
‘TMG 7161 RR’ 2594 b 71.1 c 56.2 a 100.0 a 1.7 b
‘FMT 08 -60.346/1’ 2540 b 67.6 d 51.4 a 92.1 b 1.7 b
‘CD 250 RR’ 2446 b 73.7 b 41.6 b 75.8 b 1.8 a
Averages followed by the same letter belong to the same group by the Scott-Knott test at 95% reliability.
Table 3 - Joint averages table for characters yield (Y), insertion height of the first pod (IH) and number of grains per pod (NGP) for six cultivars (‘BMX Força RR’, ‘CD 250 RR’, ‘FMT 08 – 60.346/1’, ‘NA 5909 RR’, ‘TMG 7161 RR’ and ‘V – TOP RR’) and two locations (Lavras and Incofidentes), during the agricultural year of 2014/2015.
Cultivars ---Lavras--- ---Inconfidentes---
Y kg.ha-1 IH cm NGP unity Y kg ha-1 IH cm NGP unity
‘V – TOP RR’ 3204 a 15.5 a 1.8 b 3054 a 15.5 a 2.0 a
‘BMX FORÇA RR’ 3069 a 15.1 a 2.0 a 3134 a 18.0 a 1.9 a
‘NA 5909 RR’ 2686 b 13.3 a 1.8 b 2726 b 17.2 a 1.7 a
‘TMG 7161 RR’ 2545 b 12.8 b 1.7 b 2642 b 15.9 a 1.7 a
‘FMT 08 -60.346/1’ 2442 b 12.8 b 1.7 b 2639 b 16.6 a 1.8 a
‘CD 250 RR’ 2100 c 14.9 b 2.0 a 2792 b 15.1 a 1.7 a
‘BMX FORÇA RR’ cultivars showed high grain yield
and good agronomic traits in Lavras and Incofidentes.
REFERENCES
ANDRADE, F.R. et al. Características agronômicas e produtivas da soja cultivada em plantio convencional e cruzado. Revista de Agricultura, v.91, n.1, p.81-91, 2016. Available from: <http:// www.fealq.org.br/ojs/index.php/revistadeagricultura/article/vie w/181>. Accessed: May 13, 2016.
BALBINOT JUNIOR, A.A. et al. Semeadura cruzada em cultivares de soja com tipo de crescimento determinado. Semina: Ciências Agrárias, v.36, p.1215-1226, 2015. Available from: <http://dx.doi. org/10.5433/1679-0359.2015v36n3p1215>. Accessed: May 09, 2016. doi: 10.5433/1679-0359.2015v36n3p1215.
BERNARD, R.L. et al. Results of the cooperative uniform soybeans tests. Washington: USDA, 1965. 134p.
CARVALHO, E.R. et al. Desempenho de cultivares de soja
[Glycine max (L.) Merrill] em cultivo de verão no sul de
Minas Gerais. Ciência e Agrotecnologia, v.34, n.4, p.892-899, 2010. Available from: <https://doi.org/10.1590/s1413-70542010000400014>. Accessed: Jan. 25, 2017. doi: 10.1590/ s1413-70542010000400014.
COMISSÃO DE FERTILIDADE DO SOLO DO ESTADO DE MINAS GERAIS. Recomendações para o uso de corretivos e fertilizantes em Minas Gerais: 5ª Aproximação. Viçosa, MG, 1999. 359p.
CONAB. COMPANHIA NACIONAL DE ABASTECIMENTO.
Safra grãos. Brasília, 2016. Available from: <http://www.conab. gov.br>. Accessed: Sept. 06, 2016.
COOPERATIVE EXTENSION SERVICE AMES. How a soybean plant develops. Ames: Iowa State University of Science and Technology, 1994. 20p.
DE LUCA, M.J.; HUNGRIA, M. Plant densities and modulation of symbiotic nitrogen fixation in soybean. Scientia Agricola, v.71, p.181-187, 2014. Available from: <http://dx.doi.org/10.1590/ s0103-90162014000300002>. Accessed: May 13, 2016. doi: 10.1590/s0103-90162014000300002.
DUTRA, L.M.C. et al. População de plantas em soja. In. REUNIÃO DE PESQUISA DE SOJA DA REGIÃO SUL, 35., 2007, Santa
Table 4 - Joint averages table for plants height (cm), insertion height of the first vegetable in (cm), lodging, number of pods, number of grains and harvest index and two locations (Lavras and Incofidentes) in the agricultural year of 2014/2015.
Location PH IH LO NP NG HI
---cm--- ---unity---
Lavras 56.6 b 14.1 b 1.3 a 39.8 b 74.1 b 0.46 a
Inconfidentes 89.0 a 16.4 a 2.0 b 60.3 a 111.2 a 0.45 b
Averages followed by the same letter belong to the same group by the Scott-Knott test at 95% reliability.
Maria, RS. Anais... Santa Maria: Universidade Federal de Santa Maria, 2007. p.95.
FERREIRA, D.F. Sisvar: a computer statistical analysis system. Ciência e Agrotecnologia, v.35, n.6, p.1039-1042, 2014. Available from: <http://dx.doi.org/10.1590/s1413-70542014000200001>. Accessed: May 13, 2016. doi: 10.1590/ s1413-70542014000200001.
LAMBERT, E.S. et al. Cultivares de soja 2007/2008 região Norte e Nordeste. Cidade sede: Londrina, Embrapa Soja, 2007. 36p. (Documento 284).
LIMA, S.F. et al. Efeito da semeadura em linhas cruzadas sobre a produtividade de grãos e a severidade da ferrugem asiática da soja. Bioscience Journal, v. 28, n. 6, p. 954-962, 2012. Available from: <http://www.seer.ufu.br/index.php/biosciencejournal/article/ view/13960/11106>. Accessed: May 13, 2016.
LUDWIG, M.P. et al. Populações de plantas na cultura da soja em cultivares convencionais e Roundup Ready TM. Revista Ceres, v.58, p.305-313, 2011. Available from: <http://dx.doi.org/10.1590/ s0034-737x2011000300010>. Accessed: May 15, 2016. doi: 10.1590/s0034-737x2011000300010.
MAUAD, M. et al. Influência da densidade de semeadura sobre
características agronômicas na cultura da soja. Agrarian, v.3, p.175-181, 2010. Available from: <http://ojs.ws.ufgd.edu.br/
index.php?journal=agrarian&page=article&op=view&path%5B %5D=75&path%5B%5D=649>. Accessed: May 13, 2016.
PETTER, F.A. et al. Elevada densidade de semeadura aumenta a produtividade da soja? Respostas da radiação fotossinteticamente ativa. Bragantia, v.75, n.2, p.173-183, 2016. Available from: <http://dx.doi.org/10.1590/1678-4499.447>. Accessed: May 13, 2016. doi: 10.1590/1678-4499.447.
PIRES, J.L.F. et al. Efeito de populações e espaçamentos sobre o potencial de rendimento da soja durante a ontogenia. Pesquisa Agropecuária Brasileira, v.35, n.8, p.1541-1547, 2000. Available from: <http://dx.doi.org/10.1590/s0100-204x2000000800006>. Accessed: May 13, 2016. doi: 10.1590/ s0100-204x2000000800006.
8 Ribeiro et al.
SCOTT, A.J.; KNOTT, M. A cluster analysis method for grouping means in the analysis of variance. Biometrics, v.31, n.4, p.507-512, 1974. Available from: <http://dx.doi. org/10.2307/2529204>. Accessed: May 05, 2016. doi: 10.2307/2529204.
SOARES, I.O. et al. Interaction between Soybean Cultivars and Seed Density. American Journal Plant Science, v.6, n.9, p.1425-1434, 2015. Available from: <http://dx.doi.org/10.4236/
ajps.2015.69142>. Accessed: May 10, 2016. doi: 10.4236/ ajps.2015.69142.