1 Recebido para publicação em 21.11.2009 e na forma revisada em 15.6.2010.
2 Agronomist, Ph.D., Professor, Universidade Federal do Semi-Árido – UFERSA, Caixa Postal 137, 59625-900 Mossoró-RN, CNPq fellow, <paulosergio@ufersa.edu.br>; 3 Agronomist, M.Sc., program student, UFERSA, <alinne_danny@yahoo.com.br>; 4 Agronomist, M.Sc., program student, UFERSA, <vericiafernanda@hotmail.com>; 5 Agronomist, Ph.D., Professor, UFERSA, CNPq fellow, <fhtoliveira@hotmail.com>; 6 Agronomist, Ph.D., Professor, Biological Sciences Dept., Universidade do Estado do Rio Grande do Norte – UERN, 59610-090 Mossoró-RN, <kmbsbarbosa@yahoo.com.br>.
INFLUENCE OF CORN SOWING DENSITY AND GLIRICIDIA INTERCROPPING
ON
W
EEDC
ONTROL1Influências da Densidade de Semeadura do Milho e da Consorciação com Gliricídia sobre o
Controle de Plantas Daninhas
SILVA, P.S.L.2, SOUZA, A.D.3, PAULA, V.F.S.4, OLIVEIRA, F.H.T.5 and SILVA, K.M.B.6
ABSTRACT - There is interest in the identification of the best seeding density for new corn hybrids and on reduced use of herbicides for weed control. The objective of this study was to evaluate the effects of seeding density (30, 50, 70, and 90 thousand plants ha-1) and weed
control on green ear yield and grain yield in corn cultivar AG 1051. A completely randomized block design was adopted with split-plots (seeding densities assigned to plots) and ten replicates. Weed control was achieved by means of two hoeings and by planting corn intercropped with gliricidia (between corn rows, in pits spaced 0.3 m apart). A “no weeding” treatment was included as well. Increased seeding density increased the total number and weight of marketable green ears and decreased the biomass of both weeds and gliricidia. In non-weeded, intercropped and hoed plots, the maximum grain yield values achieved as seeding density increased were 7,881, 7,021, and 9,213 kg ha-1, respectively, obtained with populations of 67 thousand, 74 thousand,
and 67 thousand plants per hectare, respectively. Intercropping did not control weeds (26 species) and provided weed growth, green ear yield, and grain yield (at the lowest densities) similar to those obtained without hoeing, except for total number of green ears, in which no influence of weed control was observed.At densities of 70 thousand and 90 thousand plants per hectare, grain yield with two hoeings was not different from yield values obtained without weeding or in the treatment intercropped with gliricidia, respectively, indicating that increased corn seeding density as well as gliricidiamay help to control weeds.
Keywords: Zea mays, Gliricidiasepium, green corn, grain yield, hoeing.
RESUMO - Existe interesse na identificação da densidade de semeadura ideal para os novos híbridos de milho e na redução do uso de herbicidas no controle de plantas daninhas. O objetivo deste trabalho foi avaliar os efeitos da densidade de semeadura (30, 50, 70 e 90 mil plantas ha-1) e do controle de
plantas daninhas sobre os rendimentos de espigas verdes e de grãos da cultivar de milho AG 1051. Utilizou-se o delineamento de blocos completos casualizados com parcelas subdivididas (densidades de semeadura atribuídas às parcelas) e dez repetições. O controle de plantas daninhas foi obtido por duas capinas e pela consorciação do milho com gliricídia (entre as fileiras do milho em covas espaçadas por 0,3 m). Um tratamento “sem capinas” foi incluído como controle. O aumento da densidade de semeadura aumentou o número total de espigas e o peso de espigas verdes comercializáveis e diminuiu a biomassa das plantas daninhas e da gliricídia. Nas parcelas não-capinadas, consorciadas e capinadas foram obtidos rendimentos máximos de 7.881 kg ha-1, 7021 kg ha-1 e 9.231 kg ha-1, respectivamente,
com as populações de 67, 74 e 67 mil plantas ha-1, respectivamente. A consorciação não controlou as
plantas daninhas. Nas densidades de 70 e 90 mil plantas ha-1, os rendimentos de grãos obtidos com
duas capinas não diferiram dos rendimentos obtidos com a ausência de capinas e com a consorciação, respectivamente, indicando que o aumento da densidade de semeadura, bem como a consorciação com a gliricídia podem auxiliar a controlar as plantas daninhas.
Palavras-chave: Zea mays, Gliricidiasepium milho verde, rendimento de grãos, capinas.
INTRODUCTION
Corn exploitation is aimed at obtaining two main products: green ears and grain. The grain in the green ears is milky, having a moisture content between 70 and 80%. Dry grain is mature grain used as human and animal food as well as for industrial use.
Three aspects justify the conduction of studies on corn seeding densities in the Northeast region of Brazil. First, one of the characteristics of corn cultivation in the region is the great diversity of production systems. The activity comprises from large companies, which adopt advanced technologies, including relatively high seeding densities, to small agricultural properties, where family agriculture is practiced, with not very efficient technologies, including the use of low seeding densities. Second, although many studies have been conducted on corn seeding density, such studies are still of interest as new hybrids are constantly developed. Recently developed hybrids can tolerate higher seeding densities than older hybrids (Silva et al., 2007). Current hybrids are less subject to lodging at high seeding densities and can withstand better the stress conditions caused by high seeding densities, producing smaller numbers of sterile plants (Widdicombe & Thelen, 2002). Finally, it should be mentioned that the effects of seeding density vary with other environmental factors (Farnham, 2001). Increased planting densities result in increased green ear yield (Silva et al., 2007) and corn grain yield (Widd icombe & Thelen, 2002). On the other hand, weed management is facilitated as row spacing values are reduced in corn seeding, with the goal of achieving agricultural sustainability (Balbinot Junior & Fleck, 2004; Begna et al., 2001).
The idea of using intercrops as a weed control method in corn is not new, but has received greater attention in recent years not
only in corn (Aladesanwa & Adigun 2008; Fujiyoshi et al., 2007; Gomes et al., 2007). This renewed interest for intercrops and other cultural weed control methods stems from the problems caused by the use of herbicides: soil and water pollution and the appearance of weed genotypes resistant to them.
Gliricidia (Gliricidiasepium) is a fast-growing arboreal legume with deep roots. It easily withstands periodical pruning, due to its high regrowth capacity (Drumond and Carvalho Filho, 2005). For this reason, gliricidia and other species have been extensively tested in agroforestry technologies, in which trees, when pruned, contribute their branches, which are used as soil mulch in associated crops (Kamara et al., 2000). In addition to improving the soil, these branches provide material that serves as soil mulching and suppresses weed growth (Budelman, 1988). Besides the physical suppression exerted on weeds, the decomposition of the material used as soil mulch may also release phytotoxic compounds that inhibit weed growth (Tian & Kang, 1994). The use of G. sepium branches as soil mulch did not have an allelopathic effect on corn and bean, but significantly decreased the population of some weed species (Obando, 1987). There have been some recent indications that gliricidia intercropped with cotton (Silva et al., 2009a) or corn (Silva et al., 2009b) can control weeds.
The objective of this work was to evaluate the effects of corn seeding density and weed control via intercropping with gliricidia on green ear yield and grain yield and other traits of corn cultivar AG 1051.
MATERIAL AND METHODS
July to November 2007. The study was carried out under dryland conditions, but received supplemental sprinkling irrigation when needed.
A completely randomized block design with split-plots and ten replicates was adopted. Each subplot consisted of four 6.0 m long rows. The usable area was considered as the central 5.2 m from the two central rows. The plots received different planting densities (30, 50,
70, and 90 thousand plants ha-1
). These densities were achieved by maintaining a constant spacing between rows (1.0 m) and varying the spacing between pits within the same row. The following “weed control treatments” were evaluated: no weeding; two hoeings (at 20 and 40 days after seeding), and intercropping with gliricidia. In the intercropping treatment, gliricidia was sowed at corn planting, between the corn rows, using two seeds per pit, in pits spaced 0.30 m apart.
The soil in the experimental area was classified as Eutrophic Red-Yellow Argisol according to the Brazilian Soil Classification System (Embrapa, 1999a), and as Ferric Lixisol according to the Soil Map of the World (FAO, 1988), was tilled with a tractor by means of two harrowings, and was fertilized with 30 kg ha-1
N (ammonium sulfate), 60 kg ha-1
P2O5 (single superphosphate), and 30 kg ha -1
K2O (potassium chloride). The fertilizers were
applied in furrows located alongside and below the sowing furrows. The analysis of a soil sample (Embrapa, 1999b) from the experiment area indicated: pH = 6.5; Ca2+
= 1.70 cmolcdm -3
; Mg2+ = 0.50 cmol
c dm
-3; K+ = 0.15 cmol
c dm
-3;
Na+ = 0.03 cmol
c dm
-3; Al+3 = 0.00 cmol
c dm
-3;
P = 35 mg dm-3
; Org. Matter = 1.20 g kg-1
.
The corn was sown on the day gliricidia was transplanted, using four seeds per pit of cultivar AG 1051. A thinning operation was performed 15 days after planting, leaving two plants per pit. Two deltamethrin sprays (250 mL ha-1
) were performed at 7 and 14 days after planting, respectively, in order to control the fall armyworm (Spodoptera frugiperda), the main pest of corn in the region. A sidedressing application with 30 kg ha-1
N (ammonium sulfate) was made at 20 and 40 days after planting.
Evaluations in corn included plant height and ear height, measured on ten plants selected at random in the usable area of each plot, as well as green ear yield and grain yield. The distance from ground level to the insertion point of the highest leaf blade was considered as plant height. Ear height was considered as the distance from ground level to the first ear’s insertion point. One of the two usable rows was selected to evaluate green ear yield, while the other was used to assess grain yield. The green ears were harvested several times as they would reach the “green corn stage”. Green corn yield was evaluated by the total number and weight of unhusked green ears, and by the number and weight of both unhusked and husked marketable ears. The marketable unhusked ears were considered as those with a length equal to or above 22 cm without blemishes or evident markings of attack by diseases or pests. The marketable husked ears were considered as those with a length equal to or above 17 cm that showed health and grain set suitable for commercialization. Evaluations were made in mature corn for grain yield and its components. The ears produced in the usable area of each subplot were harvested when the grain achieved a water content of about 20%, and were then placed to dry and subsequently threshed out. The numbers of ears thus obtained and their grain allowed to estimate the number of ears per hectare and grain yield. Number of kernels per ear was estimated based on the kernels counted in ten of those ears. 100-grain weight was obtained from five samples.
After harvesting the dry corn, the weeds found in a 1.0 x 0.8 m area, established at random in the central part of the plot, were cut even with the ground, identified, and weighed. The dry biomass of the plants was determined after a sample of the material was ground and placed in a forced air circulation oven adjusted to 70 o
C until constant weight was reached. Gliricidia green biomass was evaluated based on five plants, harvested between the two usable corn rows.
analyses. The data were submitted to the variance homogeneity test before conducting the statistical analyses (Bartlett, 1937). Before conducting the analysis of variance, because weed counts had a tendency to follow the Poisson distribution, the corresponding data were transformed to square root (Bartlett,
1947). A regression equation was selected
based on the following criteria: biological explanation of the phenomenon observed, simplicity of the equation, significance of the coefficients at 5% probability by Student’s t test, and coefficient of determination value.
RESULTS AND DISCUSSION
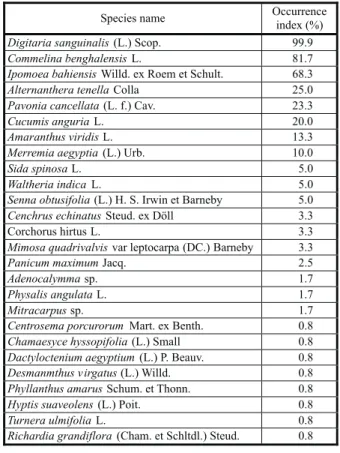
Twenty-six weed species occurred in the experiment (Table 1). This number is higher than those observed by other authors, in similar studies performed in the same region (Gomes et al., 2007). The species Digitaria sanguinalis, which occurred in all experimental units, was the most frequent, while 31% of the species occurred in less than 1% of the experimental units. The weed population that occurs in a given area depends on several factors (soil, cultural practices, seed stocks, etc.) and although the population comprises several species, only a small number of them are predominant, corresponding from 70 to 90% of the species total (Buhler, 1999).
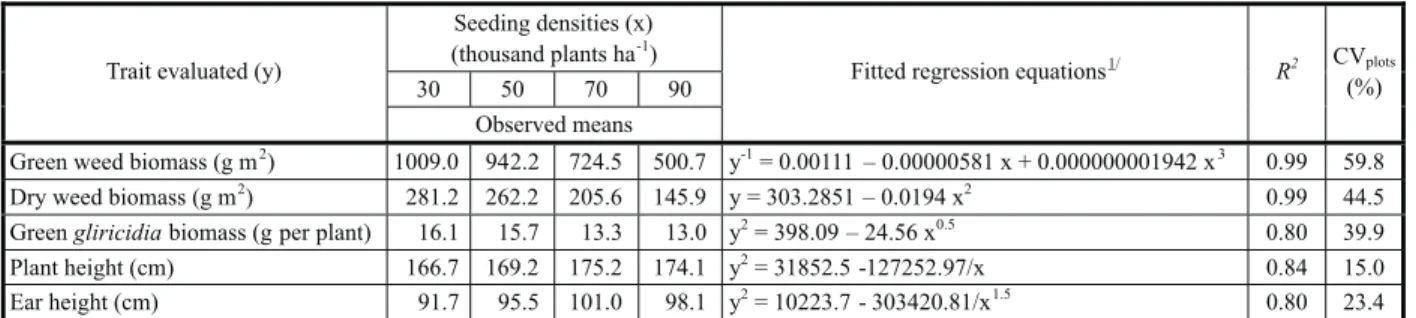
Increased seeding densities reduced weed and gliricidia biomasses, as well as corn plant height and ear height (Table 2). The greater competition of corn for water, nutrients, and light as seeding density increased may have been responsible for the growth reduction observed in weeds and gliricidia. In spite of the greater intraspecific competition between corn plants as seeding density increased, there were increases in plant height and ear height. Some etiolation of corn plants at the higher seeding densities may explain the greater plant and ear heights at the higher densities. The evaluation results for the effects of increased seeding density on corn plant height and ear height obtained by other authors are contradictory. Negative, null, or positive effects have been observed (Bangarwa et al., 1992; Silva et al., 2003), suggesting that genotypic and environmental factors must have an impact on those effects.
When two hoeings were performed, the weed biomass of the above-ground part was smaller than the values observed in non-weeded or intercropped plots, which were not different from one another (Table 3). Therefore, intercropped gliricidia did not reduce weed growth. No effect of weed control was observed on corn plant height and ear height (Table 3); the same was also observed by other authors (Silva et al., 2008). Because weeds compete with crops for water, light, and nutrients, smaller corn plants are expected in plots where no weed control is performed. It is expected that when no differences in plant height and ear height are observed in hoed and non-hoed corn in competition with weeds, corn plants will show etiolation, at least in their initial growth stages. At those stages, corn competition with weeds for light should be higher. Be it as it may, several researchers (Gomes et al., 2007; Silva et al., 2004a) have observed reductions in corn plant height caused by weeds.
Table 1 - Occurrence index (number of plots where a certain
weed species occurred/total number of experimental plots) for weed species identified in the experiment dealing with seeding densities and weed control in corn
Species name Occurrence
index (%)
Digitaria sanguinalis(L.) Scop. 99.9
Commelina benghalensisL. 81.7
Ipomoea bahiensisWilld. ex Roem et Schult. 68.3
Alternanthera tenellaColla 25.0
Pavonia cancellata(L. f.) Cav. 23.3
Cucumis anguriaL. 20.0
Amaranthus viridisL. 13.3
Merremia aegyptia(L.) Urb. 10.0
Sida spinosaL. 5.0
Waltheria indicaL. 5.0
Senna obtusifolia(L.) H. S. Irwin et Barneby 5.0
Cenchrus echinatusSteud. ex Döll 3.3
Corchorus hirtus L. 3.3
Mimosa quadrivalvisvar leptocarpa (DC.) Barneby 3.3
Panicum maximumJacq. 2.5
Adenocalymmasp. 1.7
Physalis angulataL. 1.7
Mitracarpussp. 1.7
Centrosema porcurorum Mart. ex Benth. 0.8
Chamaesyce hyssopifolia(L.) Small 0.8
Dactyloctenium aegyptium(L.) P. Beauv. 0.8
Desmanmthus v irgatus(L.) Willd. 0.8
Phyllanthus amarusSchum. et Thonn. 0.8
Hyptis suaveolens(L.) Poit. 0.8
Turnera ulmifoliaL. 0.8
With respect to all traits employed to evaluate green corn yield, values increased as seeding density increased; however, increases were linear with regard to total number of green ears, while a plateau was observed in the curves fitted for all other traits (Table 4). As to total ear weight, number and weight of marketable unhusked ears, and number and weight of marketable husked ears, maximum yields were observed with populations of 74 thousand plants ha-1
, 75 thousand plants ha-1
, 67 thousand plants ha-1
, 66 thousand plants ha-1
,
and 61 thousand plants ha-1
, respectively. These populations were, of course, obtained from the fitted equations (Table 4). Therefore, depending on the type of green ear that is sold, the ideal population to be adopted may vary.
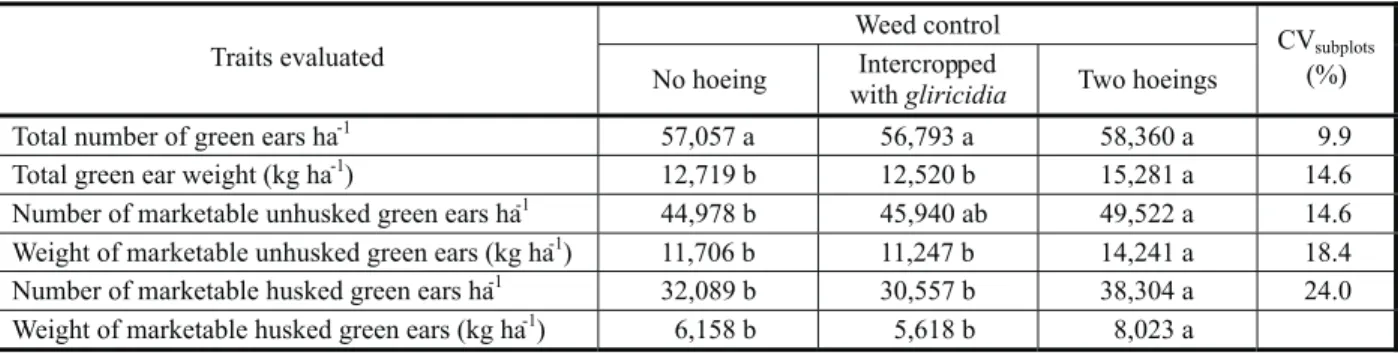
There was an effect of weed control methods on all traits employed to evaluate green ear yield, except for total number of green ears (Table 5). As to total weight and number and weight of marketable ears, either unhusked or husked, the two-hoeing treatment
provided higher yields than the two other weed control treatments, which did not differ from one another (Table 5). Similarly to what was observed in the present study, some authors (Silva et al., 2008) found a lack of weed control effect on total number of green ears (Table 2). However, other authors (Silva et al., 2004a) verified that total number of green ears in hoed plots was higher than in non-weeded plots, depending on the degree of interference. Such disagreement probably relates to the fact that those authors conducted three or four hoeings, which may have provided a much more effective weed control than in the present work and in other studies (Silva et al., 2008), in which only two hoeings were performed. It is important to point out that conducting three or four hoeings has proved uneconomical (Silva et al., 2004a).
Increased seeding densities linearly increased the number of mature ears ha-1, but
reduced the number of kernels ear-1
and 100-kernel weight (Table 6). The effects of Table 2 - Mean weed biomass values (three weed control methods and ten replicates) for the above-ground part of weeds and gliricidia and mean plant height and corn ear height, evaluated after harvesting mature ears of corn cultivar AG 1051, as a response to increased seeding densities, and corresponding regression equations, coefficients of determination, and coefficients of experimental variation
1/ All coefficients were significant at 5% probability by Student’s t test.
Seeding densities (x) (thousand plants ha-1)
30 50 70 90
Trait evaluated (y)
Observed means
Fitted regression equations1/ R2 CVplots
(%)
Green weed biomass (g m2) 1009.0 942.2 724.5 500.7 y-1= 0.00111 – 0.00000581 x + 0.000000001942 x3 0.99 59.8
Dry weed biomass (g m2) 281.2 262.2 205.6 145.9 y = 303.2851 – 0.0194 x2 0.99 44.5 Greengliricidiabiomass (g per plant) 16.1 15.7 13.3 13.0 y2= 398.09 – 24.56 x0.5 0.80 39.9
Plant height (cm) 166.7 169.2 175.2 174.1 y2= 31852.5 -127252.97/x 0.84 15.0 Ear height (cm) 91.7 95.5 101.0 98.1 y2= 10223.7 - 303420.81/x1.5 0.80 23.4
Table 3 - Mean biomass values (means of four seeding densities and ten replicates) for the above-ground part of weeds, corn plant
height and ear height, evaluated after harvesting mature ears of corn cultivar AG 1051, as a function of weed control methods)1/
Weed control methods Traits evaluated
No hoeing Intercropped withgliricidia Two hoeings
CVsubplots
(%)
Green weed biomass (g m-2) 1022.3 a 998.6 a 361.4 b 36.2
Dry weed biomass (g m-2) 291.8 a 279.3 a 100.0 b 36.5
Plant height (cm) 170 a 170 a 175 a 7.6
Ear height (cm) 96 a 96 a 98 a 9.9
increased seeding density on grain yield were different for different weed control methods (Table 7). In each type of weed control yield increased as seeding density increased, until a maximum was reached; beyond that point, yield decreased as higher densities were used. In non-weeded, intercropped, and hoed plots the maximum grain yield values attained were 7881, 7021, and 9213 (kg ha-1
), respectively. These yield values would be obtained with populations of 67 thousand, 74 thousand, and 67 thousand plants per hectare, respectively. Among corn grain yield components, only number of kernels per ear increased with the adoption of two hoeings (Table 8).
At lower densities, green ear yield and grain yield become limited because, as competition decreases, there are more growth factors available that could be transformed into grain, while at higher densities yield
decreases mainly due to aborted grain and/or sterile plants (Hashemi et al., 2005) resulting from the competition among plants. In the present work, decreased grain yield was caused by decreases in the number of kernels ear-1
and 100-kernel weight (Table 3). This may have occurred due to poor pollination or a limited supply of carbohydrates. The stress caused by high seeding densities results in an extended period between male and female corn flowering (Hashemi et al., 2005), which may cause poor pollination. It is interesting to note that at densities of 70 thousand and 90 thousand plants per hectare, grain yield with two hoeings was not different from yield values obtained without weeding or in the treatment intercropped with gliricidia (Table 7), indicating that increased corn seeding density (Table 2) as well as gliricidia may help control weeds.
Table 4 - Mean green ear yield values (three weed control methods and ten replicates) of corn cultivar AG 1051, as a response to increased seeding densities, and corresponding regression equations, coefficients of determination, and coefficients of experimental variation
1/ All coefficients were significant at 5% probability by Student’s t test.
Seeding densities (x) (thousand plants ha-1)
30 50 70 90
Traits evaluated (y)
Observed means
Fitted regression equations1/ R2 CVplots
(%)
Total number of ears ha-1 32,131 49,552 66,225 81,736 y = 7748.1+827.6 x 1.00 12.7 Total ear weight (kg ha-1) 11,062 13,247 15,673 14,046 y-1= 0.00011– 0.0000000237 x2+ 0.000000000214x3 0.99 22.6
No. of marketable unhusked ears ha-1 30,855 45,249 58,096 53,054 y-1= 0.0000604– 0.00000116 x + 0.00000077 x2 1.00 20.7 Marketable unhusked ears (kg ha-1) 10,781 12,599 14,896 11,317 y-1= 0.000115– 0.000000031x2+ 0.000000000303x3 0.95 23.1
No. of marketable husked ears ha-1 28,144 36,143 43,045 26,907 y-1= 0.000044– 0.000000036x2.5+ 0.00000000037x3 0.99 26.8 Marketable husked ears (kg ha-1) 6,547 7,186 7,707 4,959 y = 5467.1 + 0.4630 x2.5– 0.0494 x3 0.97 25.7
Table 5 - Green ear yield means (four seeding densities and ten replicates) for corn cultivar AG 1051 as a function of weed control methods1/
Weed control Traits evaluated
No hoeing Intercropped
withgliricidia Two hoeings
CVsubplots
(%)
Total number of green ears ha-1 57,057 a 56,793 a 58,360 a 9.9
Total green ear weight (kg ha-1) 12,719 b 12,520 b 15,281 a 14.6
Number of marketable unhusked green ears ha-1 44,978 b 45,940 ab 49,522 a 14.6
Weight of marketable unhusked green ears (kg ha-1) 11,706 b 11,247 b 14,241 a 18.4
Number of marketable husked green ears ha-1 32,089 b 30,557 b 38,304 a 24.0
Weight of marketable husked green ears (kg ha-1) 6,158 b 5,618 b 8,023 a
Table 6 - Mean grain yield component values (three weed control methods and ten replicates) of corn cultivar AG 1051, as a response to increased seeding densities, and corresponding regression equations, coefficients of determination, and coefficients of experimental variation
1/All coefficients were significant at 5% probability by Student’s t test.
Table 7 - Grain yield means for corn cultivar AG 1051 as a function of seeding density and weed control1/
1/ Means followed by the same letter on the row are not different at 5% probability, by Tukey’s test. All equation coefficients are significant
at 5% probability by Student’s t test.
Table 8 - Grain yield component means (four seeding densities and ten replicates) for corn cultivar AG 1051 as a function of weed control methods1/
1/ For each trait, means followed by the same letter do not differ from each other at 5% probability by Tukey’s test.
Seeding densities (x) (thousand plants ha-1)
30 50 70 90
Traits evaluated (y)
Observed means
Fitted regression equations1/ R2 CVplots
(%)
Number of ears ha-1 29,960 47,888 64,224 72,383 y2= - 1351000000 + 74738200 x 0.99 11.3
Number of kernels ear-1 508.7 457.4 420.7 368.0 y = 576.4 -2.30 x 0.99 16.7
100-kernel weight (g) 36.2 33.5 33.7 30.2 y2= 1312.86 -0.0480 x2 0.87 11.9
Weed control method
No hoeing Intercropped withgliricidia Two hoeings Seeding densities (x)
(thousand plants ha-1)
Grain yield (y) (kg ha-1)
30 4,875 b 4,334 b 6,853 a
50 6,196 b 6,245 b 8,555 a
70 7,941 ab 6,976 b 9,184 a
90 4,743 b 6,708 a 7,564 a
Fitted equations y = 0.00026 – 0.000000022 x
2.5
+ 0.0000000023 x3
R2= 0.97
y = -511.96 + 202.69 x – 1.36 x2
R2= 0.99
y = 5173.7 + 2.66 x2– 0.026 x3
R2= 0.99
CVplots, % 22.7
CVsubplots, % 16.6
Weed control methods Traits evaluated
No hoeing Intercropped withgliricidia Two hoeings
CVsubplots
(%)
Number of mature ears ha-1 53,671 a 53,555 a 53,615 a 13.7
Number of kernels ear-1 426.9 b 410.9 b 478.2 a 13.1
100-kernel weight (g) 32.8 a 33.0 a 34.4 a 10.6
Therefore, intercropping with gliricidia was not beneficial to increase corn green ear yield and grain yield via weed control. A similar fact occurred in cowpea intercropped with corn (Gomes et al., 2007). It is interesting to note, however, that the number of unhusked marketable green ears in the intercrop treatment (Table 5) was intermediate in relation to the numbers observed in other treatments. In addition, grain yield in plots intercropped with gliricidia at the population
of 90 thousand plants ha-1
did not differ from the values obtained in hoed plots (Table 7). These results suggest that intercropping with gliricidia deserves to be studied in further detail with respect to its role in weed control. Incidentally, a similar observation was made by other author (Silva et al., 2009a; Silva et al., 2009b).
them for water, nutrients and light. But another aspect must be involved. Corn root system is less developed with weed presence (Thomas & Allison, 1975). Thus, a smaller corn root system due to weed presence would be less efficient in nutrient absorption. Water content in corn plots with weeds was greater than in the crop plots without weeds (Thomas & Allison, 1975). Development of water stress symptoms with the presence of weeds may not be caused by water availability, but by the reduced ability to absorb water through the root system. Therefore, despite the fact that the experiment on which this study was based used irrigation, the reduction in the corn root system caused by the weeds would reduce water absorption capacity. Water deficiency induces the closing of stomata thus paralyzing photosynthesis and drastically reducing production in corn competing with weeds (Silva et al., 2004b). This problem is aggravated if there are C4 weeds in the area, such as the
Cenchrus echinatus (Table 1) that like corn, have high efficiency in water use (Silva et al., 2004b). Another possibility would be the invader root exudates that could inhibit corn root growth (Rajcan & Swanton, 2001).
Two components are involved in the competition for light: the quantity and quality of light. The quantitative component of light determines photosynthetic activity, whereas the quality of light influences plant morphology. An important characteristic of corn is that most of the light is intercepted by the younger, more efficient leaves above the ear and less than 10% of the photon flux density (PFD) reaches the leaves below 1 m. Thus, direct competition for PFD between corn and weeds is relatively small. The leaf area index (LAI) defines the ability of a plant to intercept PFD and it is an important determining factor for the accumulation of dry matter. A high degree of competition with weeds was seen (Tollenaar et al., 1994) to reduce corn LAI at blooming by 15%. Thus, grain yield loss resulting from competition for light is best explained through the reduction in LAI than in lower photosynthetic rates of shaded leaves (Rajcan & Swanton, 2001).
The lower leaves are not only exposed to a reduced amount of PFD, but they also receive a quality of light that differs from the total
sunlight received by the upper leaves. The light within the crown is rich in far red radiation, FR (730 at 740 nm). This is caused by the selective absorption of red light, R (660-670 nm) by photosynthetic pigments and the reflection of FR light by green leaves. This makes the far-red/red (FR/R) ratio greater in the lower part of the crown than on the upper part of the crown. Although weeds generally do not shade corn, there are indications that corn grown in the presence of weeds receives a greater FR/R ratio than the weed free crop (Rajcan & Swanton, 2001).
It can be concluded that increased seeding density increased the total number and weight of marketable green ears and decreased the biomass of both weeds and gliricidia. In non-weeded, intercropped and hoed plots, the maximum grain yield values achieved as seeding density increased were 7881, 7021, and 9213 kg ha-1
, respectively, obtained with populations of 67 thousand, 74 thousand, and 67 thousand plants per hectare, respectively. Intercropping did not control weeds (26 species) and provided weed growth, green ear yield, and grain yield (at the lowest densities) similar to those obtained without hoeing, except for total number of green ears, in which no influence of weed control was observed. At densities of 70 thousand and 90 thousand plants per hectare, grain yield with two hoeings was not different from yield values obtained without weeding or in the treatment intercropped with gliricidia, respectively, indicating that increased corn seeding density as well as gliricidia may help control weeds.
LITERATURE CITED
ALADESANWA, R. D.; ADIGUN, A. W. Evaluation of sweet potato (Ipomoea batatas) live mulch at different spacings for weed suppression and yield response of maize (Zea mays L.) in Southwestern Nigeria. Crop Prot., v. 27, p. 968-975, 2008.
BALBINOT JUNIOR, A. A.; FLECK, N. G. Manejo de plantas daninhas na cultura do milho em função do arranjo espacial de plantas e características dos genótipos. Ciencia Rural, v. 34, n. 6, p. 245-252, 2004.
BARTLETT, M. S. Some examples of statistical methods of research in agriculture and applied biology. J. Roy Stat. Soc., v. 4, n. 1, p. 137-183, 1937.
BARTLETT, M. S. The use of transformations. Biometrics, v. 3, n. 1, p. 39-52, 1947.
BEGNA, S. H. et al. Weed biomass production response to plant spacing and corn (Zea mays) hybrids differing in canopy architecture. Leed Tech., v. 15, p. 647-653, 2001.
BUDELMAN, A. The performance of leaf mulches of Leucaena leucocephala, Flemigia macrophylla, and Gliricidiasepium in weed control. Agrof. Syst., v. 6, n. 1, p. 137-145, 1988.
BUHLER, D. D. Weed population responses to weed control practices. I. Seed bank, weed populations, and crop yields. Weed Sci., v. 47, n. 4, p. 416-422, 1999.
DRUMOND, M. A.; CARVALHO FILHO, O. M. Espécies vegetais exóticas com potencialidades para o semi-árido brasileiro. Brasília, Embrapa informação tecnológica, 2005. 340 p.
FARNHAM, D. E. Row spacing, plant density, and hybrids effects on corn grain yield and moisture. Agron. J., v. 93, p. 1049-1053, 2001.
EMBRAPA. Centro Nacional de Pesquisa do Solo. Sistema brasileiro de classificação de solos. Brasília: Serviço de Produção de Informação, 1999a. 412 p.
EMBRAPA. Manual de análises químicas de solos, plantas e fertilizantes. Brasília, Embrapa, 1999b. 370 p.
FAO. Soil map of the world; revised legend. Rome: UNESCO, 1988. 119 p.
FUJIYOSHI, P. T.; GLIESSMAN, S. R.; LANGENHEIM, J. H. Factors in the suppression of weeds by squash interplanted in corn. Weed Biol. Manag., v. 7, p. 105-114, 2007.
GOMES, J. K. O. et al. Effects of weed control through cowpea intercropping on maize morphology and yield. Planta Daninha, v. 25, n. 3, p. 433-441, 2007.
HASHEMI, A. M.; HERBERT, S. J.; PUTNAM, D. H. Yield response of corn to crowding stress. Agron. J., v. 97, p. 839-846, 2005.
JANDEL. Jandel TBLCURVE. Table Curve 3.0. Curve fitting software. Corte Madera, Jandel Scientific, 1992. 280 p.
KAMARA, A. Y. et al. Selective control of weeds in an arable crop by mulches from some multipurpose trees in
Southwestern Nigeria. Agrof. Syst., v. 50, n. 1, p. 17-26, 2000.
OBANDO, L. Potencial alelopático de Gliricidiasepium (jacq.) Walp. Sobre los cultivos de maiz y frijol y las malezas predominantes (abstract) In: WASHINGTON, D.; GLOVER, N.; BREWBAKER, J. L.(Eds.). Gliricidiasepium (Jacq.) Walp., Management and improvement, Turrialba: Nitrogen Fixing Tree Association (NFTA). [s.l; s.n]:1987. p. 59-60. (Special Publication 87-01).
RAJCAN, J.; SWANTON, C. J. Understanding maize-weed competition: resource competition, light quality and the whole plant. Field Crops Res., v. 71, p. 139-150, 2001.
SAEG. Sistemas para análises estatísticas, 7.0. Viçosa: Fundação Arthur Bernardes, UFV/DBG, 1997.
SILVA, P. S. L.; OLIVEIRA, F. H. T.; SILVA, P. I. B. Efeitos da aplicação de doses de nitrogênio e densidades de plantio sobre os rendimentos de espigas verdes e de grãos de milho. Hortic. Bras., v. 21, n. 3, p. 452-455, 2003.
SILVA, P. S. L.; SILVA, E. S.; MESQUITA, S. S. X. Weed control and green ear yield in maize. Planta Daninha, v. 22, n. 1, p. 137-144, 2004a.
SILVA, P. S. L. et al. Effect of planting density on green ear yield of maize cultivars bred in different periods. Hortic. Bras., v. 25, n. 2, p. 154-158, 2007.
SILVA, P. I. B. et al. Planting times of cowpea intercropped with corn in the weed control. Caatinga, v. 21, n. 1, p. 113-119, 2008.
SILVA, A.A.; VARGAS, L.; WERLANG, R. C. Manejo de plantas daninhas na cultura do milho. In: GALVÃO, J. C. C.; MIRANDA, G. V. Tecnologias de produção do milho. Viçosa, UFV, 2004b. 366 p. cap.8, p. 269-310.
SILVA, P. S. L. et al. Weed control via intercropping with gliricídia. I. Cotton crop. Planta Daninha, v. 27, p. 97-104, 2009a.
SILVA, P. S. L. et al. Weed control via intercropping with gliricídia. II. Corn crop. Planta Daninha, v. 27, p. 105-112, 2009b.
THOMAS, P. E. L.; ALLISON, J. C. S. Competition between maize and Rottboellia exaltata. J. Agric. Sci., v. 84, n. 1, p. 305-312, 1975.
TIAN, G.; KANG, B. T. Evaluation of Gliricidiasepium prunings for phytotoxicity on maize and cowpea seedlings. Agrof. Syst., v. 26, n. 2, p. 249-254, 1994.
TOLLENAAR, M. et al. Effects of weed interference and soil nitrogen on four maize hybrids. Agron. J., v. 86, p. 596-601, 1994.