Mixed Electrical Conduction of Calcium Aluminates Synthesized by Polymeric Precursors
Faili Cintia Tomsen Veigaa,b* , Ricardo Fernández Gonzálezc,d , José Jurado Egeaa,
Sergio da Silva Cavab , Vânia Caldas de Sousaa
Received: April 19, 2018; Revised: September 05, 2018; Accepted: October 04, 2018
A study of the electrical transport properties of calcium aluminate (CA) with coexisting C3A and C12A7 phases was carried out. In this work, powders resulting from synthesis based on the polymer precursor method. The resulting product was characterized by means of XRD, Raman, and UV-visible analysis to obtain the optical BG and by EIS. From the XRD and Raman analyses, the presence and coexistence of the two self-modified phases were confirmed. In this biphasic composition, celite phase was estimated to be the major phase. An optical BG of 5.69 eV at room temperature was calculated, and under the condition of a reducing atmosphere in the temperature range of 750-950 ºC, an activation energy for conduction of 2.98 eV was determined by EIS measurements. Further, in this biphasic sample, the electronic conduction transport might be governed by the mayenite minor phase due to its large defect nature and concentration compared to celite. In oxidizing conditions, the activation energy for electrical conduction was 1.42 eV, which is somewhat higher than that observed by other authors in mayenite single phase; this result was explained by taking into account the coexistence of biphasic material and an actual chemical defect scenario in SMCM is discussed.
Keywords: Calcium aluminate, Polymer precursor, Chemical defect, Electrochemical Impedance
Spectroscopy, Self-modified celite and mayenite biphasic composition.
*e-mail: [email protected].
1. Introduction
Calcium aluminate compounds consist of a wide range of combinations of calcium oxide and aluminum oxide, and many of these materials are found in cement technology as hydraulic materials.1 This system is also attractive as ceramic
materials for high-temperature refractory applications.2 These
compounds play important roles in the steel industry as metallurgical slag.1) Calcium aluminates have a wide range
of potential technological applications due to their unusual optical, electrical, thermal, and mechanical properties.3
The calcium aluminate phase diagram shows a low melting point, the eutectic point, located at 1400 and 1395 ºC, where C12A7 (mayenite), and C3A (celite) are the main coexisting phases. They have similar cubic structures, and therefore some studies4 reported that the best sintering temperature to
attain that biphasic material is about 1350 ºC. That eutectic point composition of 50% calcium oxide and 50% aluminium oxide shows the existence of two main phases that emerge simultaneously: celite and mayenite; these two phases coexist,
and thus different heat treatments and synthesis procedures can modify the proportion of each phase in the final material.
Tricalcium aluminate C3A (Ca3Al2O6), or celite, is used for Portland cement, primarily in the starting process of hydration, and is responsible for the clinker phase. It reacts with water and produces large amounts of heat, promoting cement hardening.5 Celite is generally produced by solid
state reactions between calcium (CaO) or calcium carbonate (CaCO3) and alumina (Al2O3) or aluminum hydroxide powder (Al(OH)3).6 However, it is quite difficult to synthesize as a
pure phase and is often accompanied by small amounts of CaO and Ca12Al14O33.7
The arrangement of C3A, according to McMurdie,8
has a Ca atom without surrounding O atoms, a group of six O atoms without a central cation, and AlO4 planar groups and interatomic distances that seem unusual, which seems improbable, and consequently several researchers suggested changes in its structure.8 C3A is known to melt incongruently
at 1455 ºC, and melting makes it difficult to prepare large single crystals from which the determination of the crystal class can be done by means of diffraction patterns, and a cubic unit cell of a = 15.24 nm is observed.8 Brady and Davey9
aLaboratório de Materiais Cerâmicos, Universidade Federal do Rio Grande do Sul - UFRGS, Avenida
Bento Gonçalves, 9500, 90040-060, Porto Alegre, RS, Brasil
bPrograma em Ciência e Engenharia de Materiais, Universidade Federal de Pelotas - UFPel, Rua
Gomes Carneiro, 96010-610, Pelotas, RS, Brasil
cLuxembourg Institute of Science and Technology, 5 Avenue de Hauts-Fourneaux, L4362
Esch-Sur-Alzette, Luxembourg
dDepartamento de Química Inorgánica, Universidad de La Laguna, 38206, La Laguna, Tenerife,
confirmed that Ca3Al2O6 had a cubic cell with a = 15.22Å,
which would give 24 molecules in a unit cell.
Nowadays, there is major interest in the compound C12A7 (Ca12Al14O33), a material that occurs rarely in nature10; it is
also regarded as an aluminous cement phase component and is an intermediate compound in the manufacture of Portland cement.11,12 C12A7 has attracted attention in material science
due to its unique structure and related properties.13 Mayenite
has recently achieved the status of an advanced material of unusual potential for technological applications.14 Mayenite
is formed by sub-nanometer-sized cages, which promote a three-dimensional cubic lattice phase12 and have been found
to have a body-centered cubic structure with an I-43d space group with the cell parameter 11.99 Å.10 Eufinger et al.15
indicated that the 12CaO.7Al2O3 network characteristic contains two molecules. One presents a positive cation (Ca24Al28O64)4+ located in the 12 sub-nanometer-sized cages
that form the positive charge network frame. The other has two negatively charged O2- ions, to compensate for the 12
cages 15-17 refer to extra-structural species that occupy some
of the structure cages. Thus, these two extra-structural O2
-ions were connected to the weaker lattice, so they are often called "free" ions.17 Thus, these species might be partially or
completely replaced by various anions and give the material a novel functionality, such as having strong oxidizing and/ or reducing power.17,18
The C12A7 phase is the main structural material, since it has a huge potential for many applications and is a candidate material for many possible uses, such as catalysis,19,20 organic
light-emitting diodes,21 and as a substrate for nano-scale
circuits.17 In addition, there is the possibility of developing
new types of anion electrolytes19,22 as a potential functional
material for sensors,23 fuel cells, electronic devices,24 or
ion emitters.25 Concerning the methods of synthesis used
to obtain calcium aluminates, different manufacturing processes (sintering time, temperature, and heat treatments carried out in different atmospheres, including H2, H2/N2, O2,
and vacuum) could lead to several different results15,18,21,26
and promote excellent effects with regard to the resulting performances and properties characteristic of these oxides.
The synthesis and preparation of calcium aluminate materials has been achieved by several kinds of synthesis techniques.27 The conventional ceramic route is the most
popular, and chemical techniques have also been used to obtain different kinds of compounds, namely pure, secondary, or coexisting phase materials, which is one of the most relevant challenges for this type of compound. Therefore, various synthesis techniques have been used, such as solid state reaction,14,28 combustion reaction,29,30 sol gel,31 and
the polymeric precursor method.5 Actually, among these,
the polymeric precursor technique is known to be simple, cost-effective, and versatile.2,13 The synthesis of polymeric
precursors comprises mixing metals with citric acid cations,
after which ethylene glycol is added and the solution is concentrated by heating under stirring.2,5,13
The eutectic point composition can promote self-modified celite and mayenite biphasic composition (SMCM) with a variable range of phase proportions. One of these biphasic products was obtained, and a detailed experimental synthesis based on the polymer precursor method was reported elsewhere.2,13 According to the phase diagram,32 during the
sintering stage at 1350 ºC, the eutectic point composition produces two coexisting and reproducible phases (celite and mayenite).
They interact with each other and it was observed that the biphasic formation is self-modified during the densification step. Mayenite, as a peculiar structure, has a high defect concentration compared to celite, and a more compact lattice phase. Celite, for example, does not have non-bridged oxygen ions and thus does not have a low amount of free interstitial oxygen ions. Information on the electrical behavior of celite is scarce. Medvedeva et al.33 and Miyakawa et al.34 reported
a low value of 4.50 eV for the band gap using first principle calculations, whereas the electrical properties of mayenite have been widely explored.15,33,35,36 No paper reporting the
electrical transport properties of self-modified compounds of celite plus mayenite was found.
In this work, electrical conductivity measurements as a function of temperature were conducted by EIS and treatments in oxidizing and reducing atmospheres were performed. The contributions of the electronic and ionic conductivities of calcium aluminate (biphasic celite and mayenite) will be elucidated. To deduce the calcium aluminate defect chemistry in this SMCM biphasic composition, the electrical transport mechanism was also investigated and discussed.
2. Experimental Section
All the chemicals used as starting materials, including citric acid, ethylene glycol, and salts of aluminum nitrate nonahydrate (Al(NO3)3.9H2O) and calcium nitrate tetrahydrate (Ca(NO3)2.4H2O), were obtained from Synth and applied without any further purification. The synthesis was based on mixing citric acid solutions and aluminum and calcium nitrates using the molar ratio of 3 to 1 metal acid. It was magnetically stirred until a clear solution was obtained and then ethylene glycol was added as a complexing agent. The weight ratio of citric acid to ethylene glycol was adjusted to 60:40.37 The final solution was stirred at 70 to 85 ºC
for 2 h until formation of a solid polymer resin or viscous clear gel. This gel was subjected to thermal treatment in an oxidizing atmosphere at 400 ºC for 3 hours with a heating rate of 0.5 ºC/min for total removal of water and organic materials2,13,37, resulting in solid black mass. After grinding and
In order to verify the relative density of the calcium aluminate the powder resulting from the synthesis process was uniaxially pressed at 125 MPa into discs 10.0 mm in diameter with a thickness of 1 mm. These samples were sintered in a MAITEC furnace at 1350 ºC for 2 h with a heating rate of 10 ºC/min, after which they were cooled to room temperature at cooling rates ranging from 5 ºC/min. The investigated composition is the eutectic situated at 1400 and 1395 ºC, and therefore 1350 ºC was chosen as the sintering temperature, as it was sufficient to control the densification, minimizing the grain boundary strength.4
The apparent density and relative density was calculated according to Archimedes method38, and distilled water was
used. The relative density was obtained by the ratio of the apparent density to the pycnometric density of the solids (Equation 1).
(1)
This method was used as the pellet shaped sample, with a sampling of 10 units at the temperature of 1350 ºC.
The identification of the phases of the investigated calcium aluminate powders at a temperature of 1350 ºC and pellets calcined at 1350 ºC was carried out by X-ray diffraction (XRD) before treatment in an air-controlled atmosphere using a Philips model X’Pert MPD diffractometer. The XRD patterns were solved by Rietveld analysis using the General Structure Analysis System (GSAS) software with the help of the EXPGUI database.39,40 For the refinement analysis, the
based and the function profile chosen was the pseudo-Voigt one,41 which allows a good fitting in order to accentuate the
asymmetries of the profile at low angles.
Micro-Raman spectroscopy was performed to obtain structural information on the material, using a laser with a 532 nm excitation line, an output of 10 mW, and a beam located through a 50× objective lens for the acquisition of the 200-1115cm-1 region, with 5 cycles of 10 seconds per
cycle for each measurement. Optical measurements using ultraviolet (UV)-visible spectroscopy were in investigated calcium aluminate powders at a temperature of 1350 ºC, with a Varian Cary 5000 device having a wavelength range of 200 to 800 nm. The spectra obtained from the reflectance (R%) versus wavelength (200-800 nm range) and energy (eV) allow us to calculate the optical bandTo determine the electrical conductivity of the samples, Electrochemical Impedance Spectroscopy (EIS) was applied. A Solartron 1260 FRA (AMETEK, Hampshire, UK) in AC mode was utilized. The AC voltage was 50 mV, the frequency range was from 0.1 Hz to 1 MHz over a temperature interval of 750-950 ºC, and a gold paste was used as the electrode on disc pellet surfaces. The gold paste was used as electrode
in order to achieve blocking behavior at the interface of the electrode / aluminate material. The gold (Au) was used to perform the measurements, since the electrodes showed the electric behavior and there was no degradation of the Au paste. The measurements were made in an isothermal manner, ie at constant temperature, the experimental method consisted of starting with an atmosphere rich in H2, very reductive (-15 to -20 atm) and as a function of time, the atmosphere gradually changes to pressures oxygen, up to 0.21 atm, which is the air pressure.42 Conductivity data as a function
of oxygen partial pressure are recorded automatically and simultaneously. Data were analyzed by nonlinear least squares fitting using equivalent circuits with the software ZView version 2.8. Scanning electron microscopy, combined with energy dispersive spectroscopy (SEM/EDS), observations were performed using a Jeol LTD, mod. JSM-6300 (Tokyo, Japan). All samples were covered with a thin layer of sputtered silver to avoid electrostatic charging problems.
3. Results and Discussion
3.1 Relative density of the biphasic composition
of SMCM
The apparent density and relative density to the pellet samples sintered at 1350 ºC was x ± standard deviation: 92% and ± 2.59(g/cm3) respectively.
3.2 XRD of SMCM biphasic composition
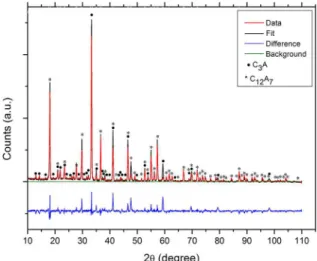
Figure 1 shows the XRD patterns of the powders obtained at a temperature of 1350 ºC. A first observation of the XRD patterns reveals the typical mayenite diagram, but in order to identify and quantify the possible existence of secondary phases, a careful examination by the Rietveld refining method was carried out, and the same pattern was also detected for pellets calcined at 1350 ºC. For all the
Relactive Density
Apparent Density Theoretical Density
=
samples investigated, two phases coexisted: 70,157 % celite and 29,843 % mayenite. Furthermore, the Inorganic Crystal Structure Database (ICSD) card nos. 10000394043
and 2412434144 were used.
As mentioned above, for the data set analyzed via the Rietveld method, the GSAS program and its EXPGUI database were applied40. The quality of the Rietveld refinement is
monitored according to the number of refinement indicators obtained for each cycle. The convergence checking of the refining takes place by a weighted R-factor profile (wRp), which should diminish with each cycle to achieve a successful refinement. WRp values are desired equal to or less than 15%.39
In this refinement, a wRp value of 0.2578 % was obtained. Values of other indicators, the refinement analysis was based on the linear combination of Gaussian and Lorentzine functions, called the pseudo-Voigt function, which adjusted the diffracted peaks, generating more precise results that are physically significant than other functions. Table 1 summarizes the refinement data using the Rietveld method.
Such as the Bragg index (Rb), which measures the quality of fit between the observed and integrated intensities calculated, were determined. In addition, the quality of the collected intensities factor (Re) was also determined. The close wRp and Re values indicate that the refinement is appropriate.
According to the Ca-Al-O phase diagram and the thermodynamic data of both phases, we can assume that this scenario is more likely than that of the purity character of celite and of mayenite phases. Strandbakke et al.45 indicated
and discussed this situation in their own paper on mayenite. Eufinger et al.15 pointed out that mayenite is not stable in
the range of 1050 and 1200 ºC in a dry atmosphere (at less than 10 ppm water, mayenite decomposes).
In this work, the resultant material essentially has a cubic lattice with controlled disorder, and the possible interfaces among them are diffused. So mayenite and celite promote a dynamic microstructure, where there is a mutual coexistence between them, with one phase helping the other to be bi-stable even when there is water uptake. This is called Celite Mayenite Self Modified (SMCM).
3.3 Raman Spectra of SMCM biphasic
composition
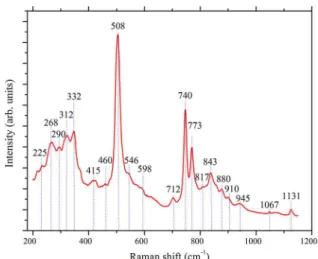
In addition to the XRD calculation, Raman spectroscopy was also realized in order to complement the XRD results on the phase identity of the calcium aluminates (Figure 2). The Raman spectra of the polycrystalline calcium aluminate sample showing the 200-1115cm-1 bands the bands were
assigned to the component phases C3A and C12A7, as shown in Table 2.
The Raman spectrum of the samples in the form of powder calcined at the temperature of 1350 ºC is displayed in Figure 2. It was analysed according to the celite Raman pattern, since it has an intense and huge band, which is strongest (see spectrum) at 508 cm-1 and may be associated
to the symmetrical movement about the bridging oxygen in Al-O-Al.15,26,46 It has an imperceptible peak at 817 cm-1 and
a band with a vibration at 843 cm-1, which corresponds to
the local vibration of the oxygen structure.
Celite has other weaker bands in the spectrum that can be associated with a group of bands at 415, 332, 290, and 225 cm-1.15,26,46,47 As mentioned in the reviewed literature,
the accepted structure of C3A is based on the separate six-membered rings of AlO4 tetrahedra.26 These rings are
formed by the division of two oxygen atoms per tetrahedron to give a structure with two oxygens without bridges per AlO4 tetrahedron, defined as units of AlO2.26
If we analyze the spectrum according to the mayenite phase, it has a larger number of bands; however the peaks with the strongest vibration of the spectrum are due to the celite phase. The most intense band of the mayenite phase is located at 740 cm-1.26,47 The intensity medium band at 773 cm-1
and this vibration is wide and asymmetric of the O2-2 structure
and does not occur in the CA or celite phases, as soon as the mayenite phase has been assigned.15,26,47 A group of bands
with weak intensity occurring at in the range of 880, 910,
Table 1. Summarizes the refinement data using the Rietveld method.
Factor Pattern Pattern Temperature
1350°C
Quantity of
phases 100% 100%
70,157 % C3A
29,843 % C12A7
Phase name C3A C12A7 SMCM
ICSD 1000039 241243
-a = b = c 15.283 12.048
-Space group Pa-3 I-43d
χ2 - - 9.944%
wRp 0.2074 0.2998 0.2578
and 945 cm-1 was assigned to the O and Al structure of the
mayenite phase.15,26,47
With regard to the mayenite phase, some authors26,47
indicated that it has a structure based on tetrahedral units of AlO4. Moreover, according to the molecular formula, there are twelve tetrahedra within the unit cell, which are completely polymerized by corner sharing with other AlO4 groups, while the rest of the sixteen AlO4 tetrahedra have non-oxygen bridges.26 In the high frequency part, the bands
at 1067 and 1131 cm-1 may be due to the O-2 structure may be
due and the low frequency bands at 268, 312, and 332 cm-1
form a vibrational group in the Ca and O structure.47 In
the spectrum there are three bands at 460, 546, and 598 cm-1 which are practically imperceptible, as they are only
a small vibration; some authors call this a type of shoulder of the great band at 508 cm-1, whose peak is ascribed to the
celite phase.26
3.4 UV-visible spectra of SMCM material
The room-temperature optical reflectance diffuse spectrum of the sample in powders heat-treated at 1350 ºC is depicted in Figure 3. From the optical absorption edge slopes and by using the Tauc method,48 a direct electronic transition BG
value of 5.69 eV was determined.
The BG shown here is lower than that reported by Feldbach et al.36 from their luminescence measurements. They found
a band gap of 6.3 eV for C12A7, while other authors found one of 5.89 eV,15,36 which is also a reasonable value for the
mayenite compound, whose theoretical BG is situated at up to 6.80 eV. In the same way, another work reported a value of 6.30 eV for C12A7.35 The large amount of major celite phase
means a new review of the literature is required to seek the electronic properties of tricalcium aluminates. Medvedeva et al.33 and Miyakawa et al.34 reported a low value of 4.50
eV for the band gap using first principle calculations.
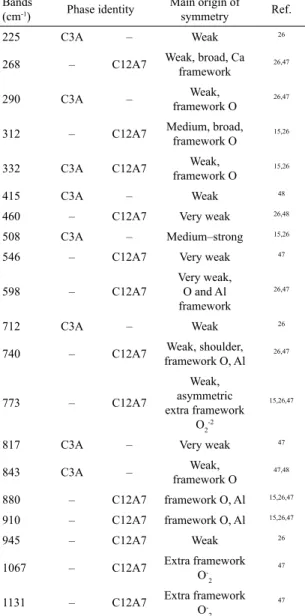
Table 2. The main absorption bands and their identified phases
Bands
(cm-1) Phase identity
Main origin of
symmetry Ref.
225 C3A – Weak 26
268 – C12A7 Weak, broad, Ca
framework
26,47
290 C3A – Weak,
framework O
26,47
312 – C12A7 Medium, broad,
framework O
15,26
332 C3A C12A7 Weak,
framework O
15,26
415 C3A – Weak 48
460 – C12A7 Very weak 26,48
508 C3A – Medium–strong 15,26
546 – C12A7 Very weak 47
598 – C12A7
Very weak, O and Al framework
26,47
712 C3A – Weak 26
740 – C12A7 Weak, shoulder,
framework O, Al
26,47
773 – C12A7
Weak, asymmetric extra framework
O2-2
15,26,47
817 C3A – Very weak 47
843 C3A – Weak,
framework O
47,48
880 – C12A7 framework O, Al 15,26,47
910 – C12A7 framework O, Al 15,26,47
945 – C12A7 Weak 26
1067 – C12A7 Extra framework
O -2
47
1131 – C12A7 Extra framework
O -2
47
Figure 3. UV-vis spectra with Tauc extrapolations for a sample of calcium aluminates at 1350ºC.
3.5 EIS spectra of SMCM biphasic composition
in a reducing atmosphere
EIS plots in the temperature range of 750-950 ºC at pO2 = 10-18 atm or 10-13 Pa are depicted in Figure 4, which
shows the Nyquist diagram for the calcium aluminate samples under that reducing condition. The EIS spectrum shows a group of semicircles as a function of temperature, which can be associated with an equivalent circuit consisting of a resistor and a pure capacitor in parallel, since a depression angle of near 90º is calculated after fitting the EIS spectrum, following an actual dielectric Debye model, represented by a single relaxation time.
This indicates that this sample behaves as a typical calcium aluminate phase material, as reported by other authors.5,28 The
presence of a single semicircle at all temperatures and under a reducing atmosphere is a relevant EIS feature of many mixed oxides where aluminum oxide is the main component.35,49
The main explanation for this is that the grains and grain boundaries have the same chemical composition and phase distribution and the aluminum and calcium cations are well dispersed along the overall celite and mayenite polycrystals. All of the investigations of electrolytes and electrides in calcium aluminates have focused on mayenite, while little attention has been given to celite. Janek and Lee16 reported
that the conductivity of mayenite at 900 ºC is 2.89 × 10⁻³ S/cm
Strandbakke et al.45 indicated a conductivity of 4.48 × 10⁻³ S/cm
at the same temperature; in this work we found a value of 6.35 × 10⁻³ S/cm in a reducing atmosphere at 900 ºC.
At 800 ºC, Janek and Lee 16 reported a value of
7.94 × 10⁻⁴S/cm, lower than that of our 1.43 × 10⁻³ S/cm;
their value of conductivity is six times higher at the same temperature. In their paper, Janek and Lee16 do not indicate
the atmosphere in which they carried out their electrical measurements. So, our electronic conductivity data obtained in a reducing atmosphere are comparable with the results of other authors.5,28 Conclusively, the electrical behavior of our
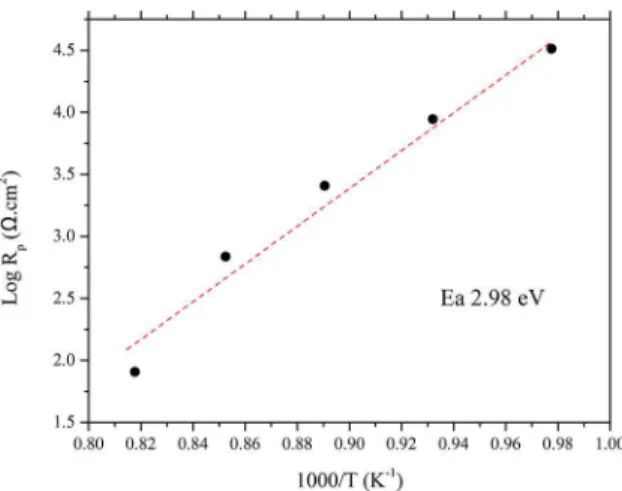
biphasic composite be governed by the mayenite component. From the EIS data shown in Figure 4, an Arrhenius plot of log total resistance versus 1/T of the C3A-C12A7 biphasic SMCM is depicted in Figure 5. The total resistance per unit area decreases significantly as the temperature increases.
This effect is shown in Figure 5, which represents the total resistance RT versus 1∕T. As almost an Arrhenius is plotted and follows Equation (2):
(2)
Where Eac is the activation energy of the conduction process, and Eac = ½ Energy band gap.15,16 In this case,
the value of the activation energy Eg for this electronic conduction is 2.98 eV; the value produces an electronic BG of 5.96 eV, which is similar to that attained by Feldbach (5.89
eV).50 Since that value is somewhat greater than that of the
optical BG, which is 5.69 eV. Note that 2.98 eV (electronic BG = 5.96 eV) is determined in the temperature range of 750-950 ºC and the optical BG of 5.69 eV was calculated at room temperature; besides, these measurements are completely different.
The nature of both determinations may depend on temperature, especially at very high temperatures > 1000 ºC.16
The electronic energy bands show the intrinsic electronic energy, Eg = 2.98 eV, which is half of the bandwidth for intrinsic semiconductors. A state of energy band conduction of electron BG is situated at 5.96 eV. Therefore, the electronic band process is operating in our SMCM, and celite can act as a matrix phase within a real biphasic material, where mayenite phase might be percolated.
Figure 6 shows the electronic BG schedule of various materials; this figure is designed taking into account the optical and theoretical data from the literature. It can be seen that our SMCM material is situated between the celite and mayenite band gap values. Note that celite has an alumina/calcia ratio of 0.33, while that of mayenite is 0.58. Thus, the major proportion of alumina can indicate that the concentrations of oxygen vacancies and interstitial and electron defects increase as the alumina content increases. Therefore, mayenite has a higher defect concentration than celite.
Conclusively, under the condition of a reducing atmosphere, the conduction mechanism is n-type and it seems that the electron conductivity is governed by minor mayenite phase. Note that mayenite has a conductivity band gap of 6.30 eV, while celite has a BG of 4.50 eV. Our SMCM material exhibits an optical BG of 5.69 eV, but in reducing conditions the conductivity BG is 5.96 eV. According to the structural features, the mayenite phase has more available non-bridged oxygen sites, and in reducing conditions, the concentration of electron and oxygen vacancy defects in mayenite increases as the aluminum oxide component is augmented.
exp
RT
=
RT
0R
-
Eac KT
W
Figure 5. Resistance versus 1∕T of the calcium aluminate sample
3.6 Morphological analysis of the biphasic
composition of SMCM
The EIS spectra of SMCM biphasic composition realized in a reducing atmosphere showed (Figura 4) a semicircle with a single relaxation time with a pure equivalent circuit (RC): a resistance R in parallel with capacitor C. This equivalent circuit is usually associated in most EIS material studies as a single crystal, as a homogeneous phase, such as a compound with few or no impurities and as phases having a single relaxation time and these phases overlap and an equivalent circuit (RC) is obtained, as discussed in the previous section.
In this sense, EIS gives us a very clear idea of the type of microstructure that emits an impedance spectrum Figure 4. In this case, the aluminates of calcium, alumina and other similar systems show a microstructure where grains and grain boundaries have similar electrical resistance. The method of preparing these aluminate phases to allow the compounds to have no impurities (such as SiO2), such impurities may be able to generate at the grain boundaries, another compound having different electrical properties generating a second semicircle.
The microstructures of calcium aluminates are fairly homogeneous. Therefore, changes in the impedance graphics are not expected. A single-semicircle, under reducing conditions, where the conducting species are electrons, indicate that both celite and mayenite compounds, under reducing conditions, have the same electronic behavior. Thus an SEM-EDS analysis would only be complementary but not conclusive.
The Figure 7 ( a and b) shows the SEM images after treatment in reducing conditions of 95% Ar and 5% H2 (pO2 = 10-18 atm or 10-13 Pa). The sample presented a fresh
fracture of the pellet after treatment in the atmosphere of reduction and homogeneous grain morphology, furthermore, it looks like grain rice, with an average grain size of 3.4 µm (Figure 7 b), and has a three dimensional appearance. It also exhibits necks in order to note the coalescence of grains in the sample indicating the densification, the calculated relative density was 92%, already shown in section 3.1.
With the EDS analysis, it was not possible to verify the content of the phase’s present, since the SEM images showed the very homogeneous grains. When the EDS analysis was carried out, the sample was carbon coated, presenting 1.34%, values of the chemical elements as: aluminum with 17.42%, calcium with 27.86%, oxygen with 53.37%. Since it is not possible to show with certainty the exact amounts of the percentages of the phases C3A and C12A7, once the two phases have the same chemical elements, allowed to make the analysis that there was good synthesis via polymer precursors.
3.7 EIS spectra of SMCM biphasic composition
in an oxidizing atmosphere
The Nyquist diagrams obtained by EIS for calcium aluminate SMCM samples under pure oxygen atmosphere are described here. The EIS plots in the temperature range of 750-950 ºC are shown in Figure 8, which shows the Nyquist diagram for the calcium aluminate sample in pO2 = 1 atm or 105 Pa oxidant atmosphere. Under oxidizing conditions
(Figure 8), the electric transport of calcium aluminate in this work changes substantially, the impedance spectrum shows two semicircles:
First semicircle, a high-frequency, slightly wide arc with a depression angle lower than 90º, the high frequency is slightly flattened, can be associated with an equivalent subcircuit consisting of a resistor (R) in parallel with a constant phase element (CPE = Q) ascribed to the bulk contribution. 15 Ie it is possible that this semicircle, a (RQ)
can be expressed the presence of the two phases of celite + mayenite that the EIS expectro are slightly separated but still superimposed (overlap). There are two components for the electrical conductivity that, as will be discussed later in this article, (Log conductivity versus partial oxygen pressure), shows a mixed (electronic + ionic) conductivity. According to the literature, especially dedicated to the mayenite, to the conductive expression of Figure 9, an ionic component due to the presence of free oxygen ions at interstitial network sites and an electronic component are very low partial
the equilibrium diagram of the mayenite. About celite, there is little information on defects diagram, but its structure does not appear to favor the presence of free oxygen ions of interstitial reticular sites, makes celite here as a blocking phase free oxygen ions.
The second semicircle is located in a very short measuring frequency range, that is, from 50 Hz to 0.1 Hz. The values obtained are very random (scattered). This second semicircle is a (RQ), that is, in the "small extended phase semicircle". This second semicircle is not exactly a semicircle, but a network of subcircuits that is associated with a classic example correspond to a physical transmission line behaviour51.
As the second subcircuit is associated with the physical behavior of the transmission line, the transmission line studies will be presented in another article in progress, therefore, the values of the resistances and capacitance of the subcircuit were not calculated. This transmission lines expresses the presence of multiple phases produced by changing, with the temperature, of the interface between gold and platinum electrodes and calcium aluminate, at low frequencies. This behavior also appears under oxidizing conditions.
On the other hand, the gold contact at temperature 950 ºC can suffer a slowed down and can react strongly with the surface of calcium aluminate particles, promoting a significant diffusion and oxygen adsorption effect, which may lead to electrode degradation. It is the moment when the electrode of gold and also the one of Pt begin to degrade. Gold or platinum electrodes are no longer adequate. In other words, it's time to start using Oxidic Metalic Composites and the work of is perovskitas and Mn that is currently underway.15,51
Figure 9 describes the log RT versus 1/T Arrhenius plot, which is almost a straight line and follows Equation (3). Since the resistance is determined by Equations (2) and (3), Equation (3) encompassing and being the same Equations. Given that in the Equation R is the total resistance that is equal to internal grain resistance plus grain boundary resistance.
Figure 7. Shows the SEM images after treatment in reducing conditions of 95% Ar and 5% H2 (pO2 = 10-18 atm or 10-13 Pa).
Figure 8. Nyquist diagram of the calcium aluminate pellets at pO2 = 1 atm or 105 Pa, pure oxygen.
Figure 9. Resistance × 1/T of the calcium aluminate samples as a function of temperature in a controlled atmosphere that had been O2 wetted in H2O oxygen.
The activation energy was determined after treatment in pO2 = 1 atm or 105 Pa (pure oxygen).
(3)
In this case, it can be seen that Ea is 1.42 eV, which can be associated with ionic conductivity, and this conductivity is most likely due to free ionic species such as Ox
o, Oi '', Vx
i,
or OH'' or even proton conductivity, H+.15,28,35.
Given the probably pure ionic conduction in the oxidizing condition, the bulk phase is basically intrinsic and is again governed by the minor mayenite phase, which is an interstitial oxygen ion conductor. Presumably this free lattice oxygen Oi'' is the framework compensated electrically for the oxygen
vacancy Vö framework.15,28,35 The activation energy for the
ionic conduction obtained is 1.42 eV. According to Eufinger et al.,15 the theoretical activation energy calculated is > 2.00 eV,
a value that is larger than our result.
Lacerda et al.28 and Janek and Lee16 reported an activation
energy of 0.87 eV for the mayenite framework for the interstitial oxygen jump into the vacancy Vxi lodged in the interior of the sub-nanometer cage located in the mayenite material. In our samples, there is a C12A7 concentration of 29.85 wt %. Therefore, the presence of an important amount of mayenite and consequently the incorporation of extra interstitial oxygen in the total conductivity could reduce the theoretical activation energy of 2.00 eV15 to the value
of 1.42 eV obtained by us in our SMCM material. Celite is a matrix phase and therefore blocks the ion oxygen free conduction path, so the activation energy for ionic conduction increases to the value of 1.42 eV. Apparently, celite is a phase with low intrinsic and extrinsic defect concentrations according to its compact structural features. Therefore, celite behaves as a matrix insulator component, playing the role of blocking defect conduction.
The conductivity versus pO2 in isothermal plots was carried out. Every point of the isothermal plot is EIS mounting spectra and we selected only some of the spectra, since the experiment had a duration of 145 h and several spectra were obtained. In parallel, every equivalent circuit was determined and all of the electrical component resistance (CPE) parameters were calculated.
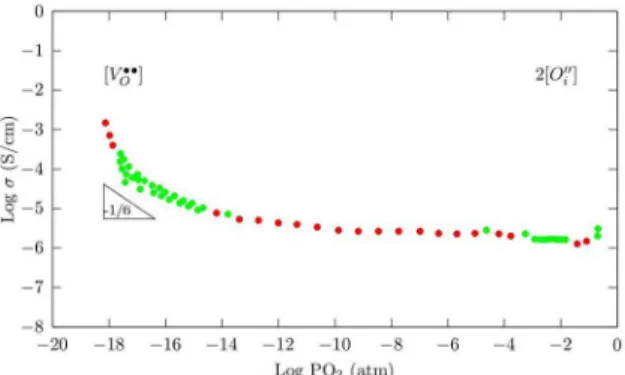
The isothermal plot of log conductivity versus pO2 at 850 ºC is depicted in Figure 10 to obtain the parameters of the studied phenomena. Figure can clarify the diagram of calcium aluminate defects in SMCM. It can be seen that the conductivity behavior in the region of low pO2 follows a -1∕4 slope in Equation (4):
(4)
That Equation means that in the range of low oxygen partial pressure, an electronic n-type process is observed (-1/4 slope). As pO2 is augmented, various conduction mechanisms
take place (-1/6 slope); presumably, a variable range of electronic-oxygen-vacancy interactions would explain that part of that isothermal plot; thus, near to the oxygen partial pressure of 10-14, Equation (5) is also deduced:
(5)
Herein the conduction can be due to the presence of free oxygen vacancy defects as well. In oxidizing conditions, the variable range of electronic-ionic interactions could be explained by the isothermal plot of log conductivity versus pO2 at 850 ºC. From PO2 = -10 to-4 atm to 0.21 atm, calcium
aluminate still confirms that the ionic interstitial oxygen is the main ionic charge moving species, which is free to make hops over the equivalent site in the mayenite lattice, and our SMCM material actually behaves as an electrolyte in that oxygen partial pressure region.
In pO2 = - 10 to - 4 atm, it is noted that the ionic domain in
Figure 10 decreases slowly as a function of oxygen partial pressure. This could be due to any charge compensation (proton or oxy-hydride cations and also holes) or charge saturation during the experiments. Note that gases are wetted with water.
Thus, the electrical transport properties and their dependence on the oxygen partial pressures (i.e., the degree of reduction and oxidation) of our calcium aluminate can be described well within the scope of the thermodynamics of the mayenite point defects, electrons, oxygen vacancies, interstitial oxygen, and protons. Presumably, there are holes at high oxygen partial pressures as well.15,16,23,28,35,52
The reduction of the crystallographic structure of mayenite with atmospheric treatments can result in different intrinsic defects, with the electronic conductivity occurring due to the variation of the diameter of the cage, which is about 0.4nm, where free oxygen is present. by other ions, resulting in the occupation of these cages occurring the distortion of the lattice and thus altering the band gap of the material. Impedance measurements under partial pressure of oxygen showed in Figure 10, that at low oxygen partial pressure, an electronic-type n-process is observed due to the electronic-oxygen vacancy interaction. When free oxygen
Figure 10. Log σ as a function of pO2 sample of calcium aluminate
at 850 ºC.
exp
RT
=
RT
0R
-
Ea KT
W
k
1
pO
1 4v a
Q V
-k
2
pO
1 6-ions are removed from the cages by a reduction process, electrons are introduced into the cages to maintain charge neutrality of the crystal. These interactions can be proposed from the defect equation. Equations (5) and (6) express the reduction reactions53.
(5)
(6)
The reduced mayenite structure can now be represented in the Equation (7)53:
(7)
Conclusively, the conductivity of the calcium aluminate described here will allow us to interpret the transport mechanisms and interstitial oxygen defects as free charge according to the defect diagram of mayenite described in the literature. Generally, in the total oxygen partial pressure range just tested, our celite-mayenite modified material is a mixed electronic-electrolyte material.16
4. Conclusions
The electrical transport properties and their dependence on the oxygen partial pressure in SMCM were determined. Through a careful examination by the Rietveld refining method, the structure and composition of SMCM were elucidated. For the sample investigated, two phases, celite and mayenite, were observed. That refining calculation gives us the phase quantification of 70.15% celite phase (ICSD card no. 1000039)43 and 29.85% mayenite (ICSD
card no. 241243).44
The calcium aluminate studied in this work was named biphasic SMCM. The Raman spectroscopy analysis was important to confirm the existence of the bands correlated with the literature on calcium aluminates.15,26,46,47 Since the celite
phase has an intense and acute band which is the strongest of the spectrum at 508 cm-1, it may be associated with the
symmetrical motion of or on the bridge oxygen in Al-O-Al.15,26,46 Therefore, the second phase with strong vibration
of the spectrum was the mayenite phase corresponding to the location of 740 cm-1.26,47
In the reducing condition, the conduction mechanism is of n-type and its electron conductivity is governed by the percolated mayenite minor phase. Mayenite, as a peculiar structure, has a high defect concentration compared to the more compact lattice phase of celite. Celite, for example, does not have non-bridged oxygen ions and produces a low amount of free interstitial oxygen ions.
Thus, celite could play the role of a compact insulating matrix which blocks the free interstitial oxygen in the conducting
path. Defects are mainly created by mayenite phase. From the EIS analysis, just one semicircle is determined, and the equivalent circuit is a resistor associated in parallel with a capacitor. This behavior is attributed to a classical dielectric Debye model represented by a single relaxation time. This indicates that this sample behaves as a mayenite calcium aluminate phase, as other authors have reported.15,16,23
The calculation of the electronic energy bands shows the intrinsic electronic energy of electron activation energy for conduction Eg = 2.98 eV, which is half of the band gap for intrinsic conductors. A band gap conducting energy state of the electron is situated at 5.96 eV. So, it has an intrinsic electronic band conduction mechanism. Taking into account this information, our BG of 5.69 eV obtained from optical measurements has a comparable agreement with the BG data of mayenite obtained by other authors.14,15,26,46,47
In oxidizing conditions, the variable range of electronic-ionic interactions could be explained by the isothermal plot of log conductivity versus pO2. Figure 9 From pO2 = -10 to -4
atm to 0.21 atm, calcium aluminate still confirms that the interstitial ionic oxygen is the main ionic charge moving species, which is free to make hops over the equivalent site lattice and our SMCM material and behaves as an actual electrolyte in that region.
The electrical transport properties and their dependence on the oxygen partial pressures (i.e., the degree of reduction and oxidation) of our calcium aluminate can be described well within the scope of the thermodynamics of the mayenite point defects, electrons, oxygen vacancies, interstitial oxygen, protons, and presumably holes at high oxygen partial pressures as well. Generally, in the total range of oxygen partial pressures tested, our modified celite-mayenite is a mixed electronic-electrolyte material.
5. Acknowledgements
The authors thank the PROGRAM SCIENCE WITHOUT BORDERS - SCHOLARSHIPS IN COUNTRY TYPE RESEARCHER SPECIAL VISITOR - PVE, MEC/MCTI/ CAPES/CNPq/FAPs Nº 71/2013 for the financial support. Thanks measurements taken at CEME-SUL. We wish to thank financial support from Luxembourgish Government via FNR (project OMIDEF Grant FNR/786 643). We also thank to the Spanish Research Program through grants MAT2013-42407 and ENE2013-47826-C4-1-R (co-financed by FEDER funds).
6. References
1. Yuan X, Xu YB, He Y. Synthesis of Ca3Al2O6 via citric acid
precursor. Materials Science and Engineering A. 2007;447:142-5. 2. Veiga FCT, Gaier M, Ratmann CR, Moreira ML, Jurado J,
Longo E, et al. Chemical synthesis and sintering behaviour of Ca3Al2O6 obtained by polymeric precursor method. Materials
Science Forum. 2015;820:143-8.
Oi
1O g
5
Vi
x2
e
2 2
"
+
+
m
R W
l
Vo
Oi
1O g
Vi
2
e
2 2
"
+
+
+
r
m
R W
rl
DFW
1O g
5
Vi
x2
e
2 2
+
+
+
3. Altay A, Carter CB, Rulis P, Ching W-Y, Arslan I, Gülgün MA. Characterizing CA2 and CA6 using ELNES. Journal of Solid State Chemistry. 2010;183:1776-84.
4. Irvlne J, West A. Ca12Al14O33 Solid electrolytes doped with zinc
and phosphorus. Solid State Ionic. 1990;40-41:896-9. 5. GakiI A, Chrysafi R, Kakali G. Chemical synthesis of hydraulic
calcium aluminate compounds using the pechini technique.
Journal of the European Ceramic Society. 2007:1781-4.
6. Singh VK, Ali MM, Mandal UK. Formation Kinetics of Calcium Aluminates. Journal of the American Ceramic Society. 1990;73:872-6.
7. Williamson J, Glasser FP. Reactions in heated lime-alumina mixtures. Journal of Applied Chemistry. 1962;J. appl. Chem., 12, December,:535-8.
8. McMurdie HF. Structure of tricalcium aluminate. Jornal of Research
of the National Bureau of Standards. 1941;27:499-505. 9. Brady LJB, Davey WP. X-ray diffraction pattern of tricalcium:
aluminate. The Journal of Chemical Physics. 1941;9:663-6. 10. Tsvetkov DS, Steparuk AS, Zuev AY. Defect structure and
related properties of mayenite Ca12Al14O33. Solid State Ionics. 2015;276:142-8.
11. Hewlett P. Lea's Chemistry of Cement and Concrete: Butterworth-Heinemann; 2018.
12. Lee D-K, Kogel L, Ebbinghaus SG, Valov I, Wiemhoefer H-D, Lerch M, et al. Defect chemistry of the cage compound, Ca12Al14O33 Àd -understanding the route from a solid electrolyte to a semiconductor and electride. Physical Chemistry Chemical Physics. 2009:3105-14.
13. Veiga FCT, Veiga FJT, Moreira ML, Jurado J, Sousa VC, Cava S. Study of the evolution of phase calcium aluminate through the method for polymeric precursors C12A7. Materials Science
Forum. 2015:257-65.
14. Ruszak M, Witkowski S, Pietrzyk P, Kotarba A, Sojka Z. The role of intermediate calcium aluminate phases in solid state synthesis of mayenite (Ca12Al14O33). Functional Materials
Letters. 2011;4:183-6.
15. Eufinger J-P, Schmidt A, Lerchb M, Janek J. Novel anion conductors - conductivity, thermodynamic stability and hydration of anion-substituted mayenite-type cage compounds C12A7:X (X = O, OH, Cl, F, CN, S, N). Phys Chem Chem Phys. 2015:6844-57.
16. Janek J, Lee D. Defect chemistry of the mixed conducting cage compound Ca12Al14O33. J of the Korean Ceramic Soc. 2010;47:99-105.
17. McLeod JA, Buling A, Kurmaev EZ, Sushko PV, Neumann M, Finkelstein LD, et al. Spectroscopic characterization of a multiband complex oxide: Insulating and conducting cement 12CaO·7Al2O3. Physical Review B. 2012;85:045204.
18. Hosono H, Kim S-W, Matsuishi S, Tanaka S, Miyak A, Kagayama T, et al. Superconductivity in room-temperature stable electride and high-pressure phases of alkali metals.
Philosophical. 2015;373:1-11.
19. Buchammagari H, Toda Y, Hirano M, Hosono H, Takeuchi D, Osakada K. Room temperature-stable electride as a synthetic organic reagent: application to pinacol coupling reaction in aqueous media. Organic Letter. 2007;9:4287-9.
20. Ruszak M, Inger M, Witkowski S, Wilk M, Kotarba A, Sojka Z. Selective N2O removal from the process gas of nitric acid
plants over ceramic 12CaO·7Al2O3 catalyst. Catalysis Lett. 2008;126:72-7.
21. Kim K-B, Kikuchi M, Miyakawa M, Yanagi H, Kamiya T, Hirano M, et al. Photoelectron spectroscopic study of C12A7:e- and alq3 interface: the formation of a low electron-injection barrier. The Journal of Physical Chemistry C. 2007;111:8403-6.
22. Goodenouch JB. Oxide-ion electrolytes. Annual Review of
Materials Research. 2003:91-128.
23. Lacerda M, West AR, Irvine JTS. Electrical properties of Ca12Al14O33: Effect of hydrogen reduction. Solid State Ionics. 1993;59:257-62.
24. Hosono H, Ogo Y, Yanagi H, Kamiya T. Bipolar conduction in SnO thin films. Electrochemical and Solid-State Letters. 2011;14: H13-H6
25. Li QX, Hayashi K, Nishioka M, Kashiwagi H, Hirano M, Torimoto Y, et al. Absolute emission current density of OÀ from 12CaO·7Al2O3 crystal. Applied Physics Letters. 2002;80:4259.
26. McMillan P, Piriou B. Raman spectroscopy of CaAl2O4 glasses
ane crytals. Journal of Non-Crystalline Solids. 1983;55:221-42
27. Douy A, Gervais M. Crystallization of amorphous precursors in the calcia-alumina system: a differential scanning calorimetry study. Journal of the American Ceramic Society. 2000;83:70-6. 28. Lacerda M, Irvine JTS, Glasser FP, West AR. High oxide ion conductivity in Ca12Al14O33. Letters to nature. 1988;322:525-6.
29. Gong L, Lin Z, Ning S, Sun J, Shen J, Torimoto Y, et al. Synthesis and characteristics of the C12A7-O- nanoparticles by citric acid sol-gel combustion method. Materials Letters. 2010;64:1322-4.
30. Fumo D, Morelli M, Segadães A. Combustion synthesis of calcium aluminates. Materials Research Bulletin. 1996;31:1243-55.
31. Sun J-Q, Gong L, Shen J, Lin Z, Li Q-X. Sol-gel preparation of porous C12A7-Cl-Crystals. Acta physico-chimica Sinica. 2010;26: 795-8.
32. MacLaren DC, White MA. Cement: its chemistry and properties.
Journal of Chemical Education. 2003;80:623-35.
33. Medvedeva JE, Teasley EN, Hoffman MD. Electronic band structure and carrier effective mass in calcium aluminates. Physical Review B. 2007;76:155107.
35. Hayashi K, Sushko PV, Shluger AL, Hirano M, Hosono H. Hydride ion as a two-electron donor in a nanoporous crystalline semiconductor 12CaO·7Al2O3. The Journal of Physical Chemistry
B. 2005;109:23836-42.
36. Feldbach E, Denks VP, Kirm M, Liblik P, Maaroos A, Mändar H, et al. VUV and cathodoluminescence spectroscopy of 12CaO· 7Al2O3. Journal of Materials Science: Materials in Electronics. 2009;20:260-3.
37. Pechini MP, inventorMethod of preparing lead and alkaline earth
titanates and noibates and coating method using the same to form
a capacitor. USA1967.
38. Domínguez JC C, Torrecillas R, Fantozzia G. Microstructure development in calcium hexaluminate. Journal of the European Ceramic Society. 2001 21:381-7.
39. McCusker L, Dreele RV, Cox D, Louër D, Scardi P. Rietveld refinement guidelines. Journal of Applied Crystallography. 1999;32:36-50.
40. Toby BH. EXPGUI, a graphical user interface for GSAS. Journal
of Applied Crystallography. 2001;34:210-3.
41. Thompson P, Cox DE, Hastings JB. Rietveld refinement of debyescherrer synchrotron X-ray data from Al2O3. Journal Applied
Crystallography. 1987;20:79-83.
42. J.C. Ruiz-Morales JC-V, D. Marrero-López, J. Peña-Martínez, D. Pérez-Coll, P. Núñez, J.C. Rodríguez-Placeres, B. Ballesteros-Pérez, V.I. Dorta-Martín Ruiz-Morales, C. Savaniu. Pilas de combustible
de óxidos sólidos (SOFC). 2 ed. Santa Cruz de Tenerife: Centro de la Cultura Popular Canaria; 2008.
43. Mondal P, Jeffery YJ. The crystal structure of tricalcium aluminate, Ca3Al2O6. Acta Crystallographica Section B: Structural
Crystallography and Crystal. 1975:689-97.
44. Palacios L, Torre AGdl, Bruque S, García-Muñoz JL, García-Granda S, Sheptyakov D, et al. Crystalstructures and in-situ formation study of mayenita electrices. Inorganic Chemistry. 2007;46: 4167-76.
45. Strandbakke R, Kongshaug C, Hausgsrud R, Norby T. High-temperature hydration and conductivity of mayenite, Ca12Al14O33. The J of Physical Chemistry C. 2009;113:8938-44.
46. Torréns-Martín D, Fernández-Carrasco L, Martínez-Ramírez S. Hydration of calcium aluminates and calcium sulfoaluminate studied by raman spectroscopy. Cement and
Concrete Research. 2013;47:43-50.
47. Kajihara K, Matsuishi S, Hayashi K, Hirano M, Hosono H. Vibrational dynamics and oxygen diffusion in a nanoporous oxide ion conductor 12CaO·7Al2O3 studied by 180 labeling and micro-raman spectroscopy. The Journal of Physical
Chemistry C. 2007;111:14855-61.
48. Wood DL, Tauc J. Weak absorption tails in amosrphous semiconductores. Physical review B. 1971;5:3144-51. 49. Feizi E, Ray AK. High temperature optical absorption
investigation into the electronic transitions in sol-gel derived C12A7 thin films. Journal of Materials Science: Materials
in Electronics. 2015;26:4691-7.
50. Feldbach E, Denks VP, Kirm M, Liblik A, Maaroos H, Mändar T, et al. VUV and cathodoluminescence spectroscopy of 12CaO⋅7Al2O3. Journal of Materials Science: Materials in
Electronics. 2009;J20:260-3.
51. Shkerin SNS, Tolkacheva AS, Nikonov AV, Pavzderin NB. Impedance spectroscopy of cell with Pt electrodes on oxygen-conducting material with mayenite-related structure. Ionics. 2017;49(doi:10.1007/s11581-017-2043-8):1-8.
52. Irvlne J, West A. Ca12Al14O33 A possible high-temperature
moisture sensor. Journal of Applied Electrochemistry. 1989;19:410-2.