Studies of the temperature coefficient of capacitance (TCC)
of a new electroceramic composite: Pb(Fe
0.5Nb
0.5)O
3(PFN)–Cr
0.75Fe
1.25O
3(CRFO)
F. N. A. FreireÆM. R. P. SantosÆ F. M. M. PereiraÆR. S. T. M. Sohn Æ J. S. AlmeidaÆA. M. L. MedeirosÆE. O. SanchoÆM. M. Costa Æ A. S. B. Sombra
Received: 12 November 2007 / Accepted: 21 February 2008 / Published online: 12 March 2008
ÓSpringer Science+Business Media, LLC 2008
Abstract In this paper we did a study of the dielectric properties: capacitance (C), dielectric permittivity(e),
elec-tric modulus(M) and dielecelec-tric loss(tanga)) in the
radio-frequency(RF) and microwave (MW) frequency range as a function of temperature and the temperature coefficient of capacitance (TCC) of the composites [Pb(Fe1/2Nb1/2)O3 (PFN)]Z–[CrYFe2-YO3(CRFO)]100-Zwhere Z=0, 10, 50, 90 and 100%. The compounds were prepared by the powder-sintering and the X-ray diffraction (XRD) was used in this study using the Rietveld procedure. The X-ray analysis shows that PFN phase is tetragonal where the CRFO phase
belongs to a trigonal structure. The capacitance, dielectric permittivity, electric modulus and loss were studied in the frequency range of 100 Hz to 1GHz and temperature range of 25–100°C. The values of TCC for all the samples are presenting positive values. The study of the electric modulus (M) as a function of frequency and temperature lead to the measurement of the activation energy (Eac), which is direc-ted linked to the relaxation process associadirec-ted to the interfacial polarization effect in the samples. The study of the electrical properties in the RF and MW range of frequencies is important in view of possible applications of these com-posites as future components in RF and MW circuits.
1 Introduction
The current tendency in the electronic industry has been in the direction of miniaturization in size and weight, and high functionalization. In the case of the capacitor as component for an electronic device, a multilayer ceramic capacitor (MLCC) with high volume efficiency, low fab-rication cost and high reliability is in demand [1].
Perovskite compounds can be treated as model material because of the richness in physical properties and relatively simple structure. These materials have found many appli-cations, e.g.: computer memories, pyroelectric sensors, piezoelectric transducers and mutilayered capacitors [2]. The use of composites objective to get new materials that can substitute the effect of an electric circuit, thus being able to be used as an antenna or another device in the radio-fre-quency (RF) or microwave (MW) region of the spectra. With the progress of mobile wireless communication the com-pactness, power efficiency and affordability each time more becomes requisite basic for new products that can be used in the telecommunication [3].
F. N. A. FreireF. M. M. Pereira
Departamento de Quı´mica Orgaˆnica e Inorgaˆnica, Universidade Federal do Ceara´, CEP 60455-760 Fortaleza, Ceara, Brasil
F. N. A. FreireM. R. P. SantosF. M. M. Pereira
R. S. T. M. SohnJ. S. AlmeidaA. M. L. Medeiros
E. O. SanchoA. S. B. Sombra (&)
Laborato´rio de Telecomunicac¸o˜es e Cieˆncia e Engenharia dos Materiais (LOCEM), Departamento de Fı´sica, Universidade Federal do Ceara´, Caixa Postal 6030, CEP 60455-760 Fortaleza, Ceara, Brasil
e-mail: [email protected] URL: www.locem.ufc.br
F. N. A. Freire Faculdade de Educac¸a˜o,
Cieˆncias e Letras do Serta˜o Central – Curso de Quı´mica, Universidade Estadual do Ceara´, CEP 63900-000 Quixada, Ceara, Brasil
A. M. L. Medeiros
Departamento de Engenharia de Teleinforma´tica, Universidade Federal do Ceara´, CEP 60455-970 Fortaleza, Ceara, Brasil
M. M. Costa
Departamento de Fı´sica, Universidade Federal de Matogrosso, Cuiaba´, Brasil
The new phase CRFO100 [4] and the perovskite PFN100 was proposed as a new eletroceraˆmic with potential use in devices in the RF and MW region of operation [5].
A combined study of both structures and the electro-physical properties of new compounds and solid solutions are necessary for the development of new ceramic mate-rials [6].
The overall properties of composites, materials that consist of two or more phases are of great interest in the literature [7].
Various mechanisms were proposed to explain the dielectric properties of PFN and PFN based ceramics. Ananta and Thomas [8] proposed that co-existence of Fe2+ and Fe3+ions on equivalent crystallographic sites leads to electron hopping type of conduction at lower frequencies. Saha and Sinha [5,9] explained the dielectric dispersion on the basis of the characteristic relaxor type ferroelectric and their Mo¨ssbauer studies indicated the presence of Fe3+ only.
There have been few papers concerning the stability of the dielectric permittivity (eR) with temperature, although
the temperature coefficient of capacitance (TCC) is a very important parameter for RF components [10]. Some devi-ation in component specificdevi-ations with temperature can adversely affect the channel/frequency selection charac-teristics of filter/resonator circuits in a RF module.
The study of it influences of the temperature in the dielectric properties of the composites can serve as a parameter that indicates if the material is adjusted to be used in conditions where it has a temperature variation. Measuring the capacitance as a function of the temperature is possible to calculate the TCC. The TCC parameter can be calculated through the angular coefficient obtained from straight line graph obtained from the capacitance versus temperature variation.
In view of the potential technological importance of magneto-dielectric (CRFO100) and ferroelectric (PFN100) composites, the present studies were undertaken to under-stand the electrical properties: capacitance (C), dielectric permittivity (e), dielectric loss (tana) and electrical
modu-lus (M), of the substitutional solid solutions PFN100, CRFO100 and their composites as a function of frequency and temperature. By means of the impedance spectroscopy, the frequency response of the material under an alternating current was studied [11].
This work has the objective to study the dielectric behavior of the electrical properties of phases PFN100, CRFO100 and the composites PFN10, PFN50, PFN90 as a function of the temperature in a defined frequency, showing the influence of temperature in this property and evaluating its possible applications in electronic devices.
2 Experimental
2.1 Solid-state reaction synthesis
Polycrystalline samples of PFN1000 and CRFO100 whose chemical composition is specified in the formulae Cr0.75Fe1.25O3 and Pb(F.0.5Nb0.5)O3, respectively, were synthesized by conventional solid-state reaction method, detailed in our previous work [4]. The reactions are rep-resented in the equations below:
Y3Fe5O12Cr3Fe5O12¼Cr0:75Fe1:25O3!CrYFe2YO3 CRFO, Y¼0.75
ð Þ ð1Þ
PbTiO3Pb Feð 0:5Nb0:5ÞO3!Pb Feð xNbxÞO3 PFN, X¼0.5
ð Þ ð2Þ
2.2 Rietveld analysis
The XRD patterns of PFN100, PFN90, PFN50, PFN10, CRFO100 composite samples are shown in Fig.1. The results of the refinement of the phases and intermediaries using the Rietveld method had been argued [5] and are summarized in Table 1.
The CRFO presents at room temperature a trigonal structure belonging to group R3c (#167), with six mole-cules in the unity cell (Z=6). In this structure the iron and chromium are localized in the Wyckoff Positions 12c, where the oxygen ion occupies the site 18e (Table1).
The PFN phase present a tetragonal perovskite type structure, space group P4mm (JCPDS file #88-356) with cell parameter a=b=4.0116 A˚ , c=4.007 A˚ . The additional reflection (marked by *) is correlated with a pyrochlore phase of lead niobium oxide, Pb2(Nb0.5Fe1.5)O6.5(JCPDS file # 39-888). This phase has a cubic structure with cell parameter a=10.5486 A˚ .
2.3 Dielectric properties
In this study the applied voltage on the investigated sam-ples, in the form of two terminal devices, consisting of two metallic or otherwise conducting plates with the dielectric medium filling the space between these plates, is an alternating signal at a frequencyx. The measured
capaci-tance, C(x), is a complex quantity whose real and
imaginary parts correspond directly to the real and imagi-nary components of the complex permittivity:
Cð Þ ¼x C0ð Þ x jC00ð Þx A
t
e0ð Þ x je00ð Þx
½ ð3Þ
C0(x) corresponds to the ordinary capacitance, while the
imaginary component C’’ (x) is proportional to the
dielectric loss component, ‘‘A’’ and ‘‘t’’ are, respectively, area and thickness of the samples. In many engineering applications it is customary to define the loss angle d by which the phase of the electric flux density D(x) lags
behind the driving voltage E(x). The tangent of this loss
angle is given by the relation:
tana¼C0ðxÞ=C0ðxÞ ¼ e0ð Þx =e0ðxÞ; ð4Þ
The practical significance of tanais that it represents the
ratio of the energy dissipated per radian in the dielectric to the energy stored at the peak of the polarization.
One practical advantage of tanaas a figure of merit of a
dielectric material consists in its independence of the geometry of the sample—it is the ratio of two parameters which both contain the same geometrical factor.
It is convenient, for some applications, to define the geometrical capacitance of a capacitor in terms of the value of capacitance that would be obtained with the same geometry but with the dielectric medium being replaced by free space (vacuum):
C0¼e0A=t ð5Þ
where e0 represents the permittivity of free space
(8.854910-12F/m).
The ratio of the measured capacitance to the geometrical capacitance gives the ratio of the true complex permittivity to the permittivity of the free space, known as the relative dielectric permittivity:
eR¼Cð Þx =C0¼e xð Þ=e0 ð6Þ
the real part of which is known as the dielectric permit-tivity [12].
The electrical properties were investigated by imped-ance spectroscopy. Measurements were performed on 10 mm (diameter)91.2 mm (thickness) cylindrical sam-ples (capacitors). The sintered pellets were polished with fine emery paper in order to make both the surfaces flat and parallel. The pellets were then painted with silver, which were dried at 120°C for 30 min, for better contact. The measurements were carried out with an applied potential of 500 mV in the frequency range from 100 Hz to 1.0 GHz.
2.4 Temperature coefficient of capacitance (TCC) and the electric modulus (M)
For accomplishment of the experimental measurements of the capacitance as a function of temperature, a system of acquisition of data was mounted that consisted of the use of an electric oven model equipped with a controller euro-thermo linked model 2024 to an impedance analyzer Solatron model SI 1260 controlled by a personal computer. The temperature was tuned from 25°C to 100°C with a stability of 0.1°C in air. The obtained data had been adjusted by straight lines, showing of this form a possible linear behavior of the capacitance with temperature in the frequency of 100 kHz, 200 KHz and 1 MHz. The dielectric properties of the composites are shown in Table2. The TCC was calculated by the following formulates:
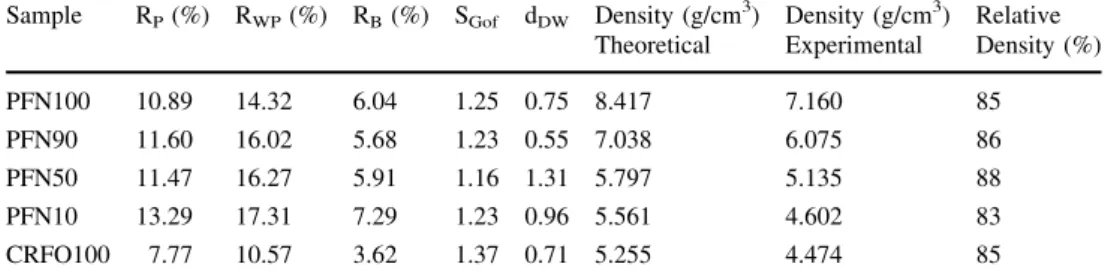
Table 1 Numerical criteria of
fit and density Sample RP(%) RWP(%) RB(%) SGof dDW Density (g/cm3)
Theoretical
Density (g/cm3) Experimental
TCC¼½ðCT2CT1Þ=½CT1ðT2T1Þ ð7Þ
where CT1is the measured capacitance at T1(where T1is 25°C) and CT2 is the measured capacitance at T2=100°C.
In composite materials, an interfacial polarization is almost always present because of the different phases that make these systems heterogeneous. Usually, in the systems with a conductive component, an interfacial polarization is obscured by conductivity and the dielectric permittivity can be very at low frequencies [13].
In order to study the frequency and temperature dependence of the interfacial polarization effect, which generate electric charge accumulation around the ceramic particles, displacing relaxation peaks, electrical modulus (M) was used.
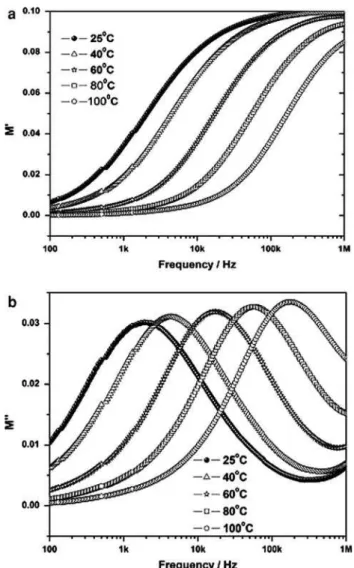
Figures8–9 present the real and imaginary parts of the electrical modulus, M0 and M00, as a function of tempera-ture and frequency calculated using the Eqs. 8–10 [14].
M¼1=½e0je00 ¼M0þ jM00 ð8Þ
M0¼e0=ð Þe0 2þ½ e002 ð9Þ
M00¼e00=ð Þe0 2þ½ e002 ð10Þ
The activation energy (Eac) of the relaxation was calculated starting from the values of the maximum frequencies in each curve of M00(f) as a function of the temperature. Considering that the process is activated by temperature in Eq. 11.
f¼f0eðEac=KTÞ ð11Þ
where f is the maximum frequency in the composites (at temperature T), k is the Boltzman constant, Eac is the activation energy and T it is the temperature (K).
3 Results and discussion
The XRD patterns of PFN100, PFN90, PFN50, PFN10, CRFO100 composite samples are shown in Fig.1. In the Rietveld procedure, a model based on iron oxide and chromium oxide was used for CRFO100 [4], is summa-rized in Table 1. The structural parameters for the PFN100 are also summarized in Table1. The data obtained from the Rietveld procedure associated to PFN and CRFO compounds are collected and discussed in Ref. [5].
Table1summarizes the parameters of refinement of the phases PFN100, CRFO100 and the composites in accor-dance with the Ritiveld method showing that the refinement presented a good adjustment with Rwp varying between 10.57 and 17.3. In Table1we also have the values of the theoretical and experimental densities of all the composites. For all the samples we have densities in the range of 83 to 88% of the expected theoretical densities.
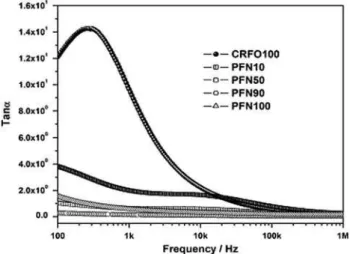
Figures2, 3, 4, 5 present the measured capacitance and loss of the samples for temperatures of 25°C and 100 °C respectively. In Fig.2 we can observe that at 25°C the capacitance is quite stable in the frequency range of 100 Hz to 1 MHz. The composite PFN90 is presenting the higher value of the capacitance. The loss is decreasing with the increase of the frequency (see Fig.3). At 100°C the PFN90 (see Figs.4 and 5) is also presenting the higher value of the capacitance. The PFN90 is presenting higher value for the loss (see Fig.5), when compared to the other samples, for fre-quencies up to 10 KHz. For higher frefre-quencies all samples are presenting loss in the same order.
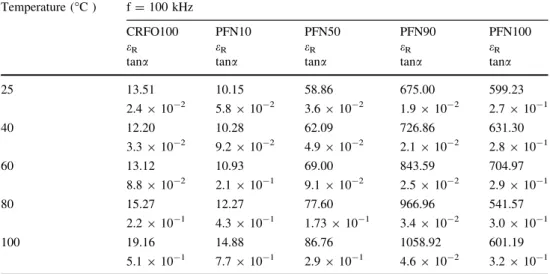
In Table2 we have the values of the dielectric permit-tivity (eR) and loss (tanga) at 100 KHz for all samples and
temperatures. We can observe that the PFN90 is presenting the highereRvalue (675) with the lowest value for the loss
(1.9910-2) at 25°C. With the increase in temperature,
Table 2 Dielectric Permittivity (eR) and dielectric loss (tana) of
the samples as a function of the temperature (f=100 KHz)
Temperature (°C ) f=100 kHz
CRFO100 PFN10 PFN50 PFN90 PFN100
eR eR eR eR eR
tana tana tana tana tana
25 13.51 10.15 58.86 675.00 599.23 2.4910-2 5.8910-2 3.6910-2 1.9910-2 2.7910-1
40 12.20 10.28 62.09 726.86 631.30 3.3910-2 9.2910-2 4.9910-2 2.1910-2 2.8910-1
60 13.12 10.93 69.00 843.59 704.97 8.8910-2 2.1910-1 9.1910-2 2.5910-2 2.9910-1
80 15.27 12.27 77.60 966.96 541.57 2.2910-1 4.3910-1 1.73910-1 3.4910-2 3.0910-1
the PFN90 is always presenting the highest value of theeR
and lower value of tangafor all samples and temperatures.
At 100°C the PFN90 is presentingeRvalue (1058.92) with
loss (4.6910-2). The PFN100 is also presenting values close to the PFN90 sample.
In Fig. 6and Table3 we have the measurements ofeR
and tangain the frequency range of 10 MHz to 1 GHz. In
this frequency range the PFN90 and PFN100 is also pre-senting values of theeRthat are very close and very stable
in this region of frequency. In Table3we can notice that at 1 GHz the highest permittivity,eR= 28.89 and lowest loss,
tanga=9.3910-3 was obtained for PFN100, however
for 1.8 GHz the PFN90 is presenting the highest value of the permittivity,eR = 42.74.
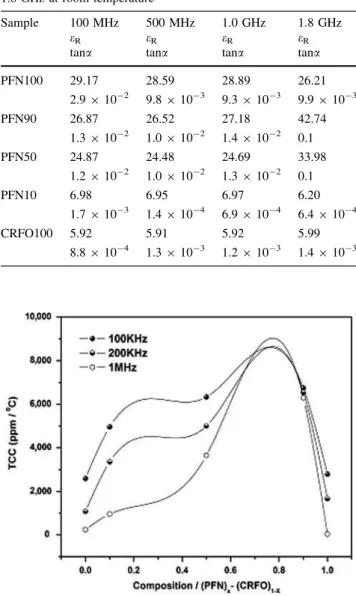
In Fig.7we have the TCC values for all the composites at 100 KHz, 200 KHz and 1 MHz. The TCC values were experimentally obtained through Eq. 7 considering a the-oretical fitting for a straight line adjustment. The values of TCC for all the samples are presenting positive values (Fig.7 and Table4). We can observe that the CRFO100 Fig. 2 Capacitance of CRFO100, PFN10, PFN50, PFN90 and
PFN100 as a function of frequency (T=25°C)
Fig. 3 Loss tangent of CRFO100, PFN10, PFN50, PFN90 and PFN100 as a function of frequency (T=25°C)
Fig. 4 Capacitance of CRFO100, PFN10, PFN50, PFN90 and PFN100 as a function of frequency (T=100°C)
Fig. 5 Loss tangent of CRFO100, PFN10, PFN50, PFN90 and PFN100 as a function of frequency (T=100°C)
Fig. 6 Dielectric Permittivity(eR) for (PFN)X–(CRFO)1 -X with
x=0%, 10%, 50%, 90% e 100% (T=25°C ) as a function of
sample is presenting the lowest values for the TCC (see Fig.7) for the three frequencies under study (100 KHz, 200 KHz and 1 MHz). With the increase of the PFN presence (x is increasing) there is an increase of the TCC
value for all frequencies. The highest value is observed for the PFN90 sample. In Table4 we can confirm this behavior. At 1 MHz the lowest obtained values are around 242 ppm/°C (CRFO100) and 404 ppm/°C(PFN100).
In Figs.8and9we have the values of M0and M00 as a function of frequency and temperature for CRFO100 and PFN10 respectively. For both figures we can notice that the M0 values increased with frequency and reach a rather constant value (Figs.8a and9a). Nevertheless, peaks in M00 values are developed at the same frequency range, indi-cating the appearance of a relaxation process. The peak in the M00 values is increasing in frequency when we are increasing the sample temperature. Relaxation peaks are displaced to higher frequencies, because of the relaxation process. This relaxation is influenced by the interfacial polarization effect, which generates electric charge accu-mulation around the ceramic particles, displacing the relaxation peaks.
The most probable model for explanation of this phe-nomenon is the one of the tunneling of electrons or by Table 3 Dielectric Permittivity (eR) and dielectric loss (tana) of the
samples in the frequency of 100 MHz, 500 MHz, 1.0 GHz and 1.8 GHz at room temperature
Sample 100 MHz 500 MHz 1.0 GHz 1.8 GHz
eR eR eR eR
tana tana tana tana
PFN100 29.17 28.59 28.89 26.21 2.9910-2 9.8910-3 9.3910-3 9.9910-3
PFN90 26.87 26.52 27.18 42.74 1.3910-2 1.0910-2 1.4910-2 0.1
PFN50 24.87 24.48 24.69 33.98 1.2910-2 1.0910-2 1.3910-2 0.1
PFN10 6.98 6.95 6.97 6.20 1.7910-3 1.4910-4 6.9910-4 6.4910-4
CRFO100 5.92 5.91 5.92 5.99 8.8910-4 1.3910-3 1.2910-3 1.4910-3
Fig. 7 TCC of the samples (PFN)X–(CRFO)1-X as a function of
X=0; 0.10; 0.5; 0.90; 1, using Eq. 7 in 100 kHz, 200 kHz and
1 MHz
Table 4 Values of TCC as a function of compositions (PFN)X-(CRFO)100-X with values of X=0; 10; 50; 90; 100, using Eq. 7 in
100 kHz, 200 kHz and 1 MHz and the activation energy (Eac)
Compositions (% PFN) 0 10 50 90 100 TCC(ppm/°C)f=100 kHz 2594 4960 6332 6737 2787
TCC(ppm/°C)f=200 kHz 1079 3360 5006 6544 1669
TCC(ppm/°C)f=1 MHz 242 959 3650 6300 404
Eac(eV) 0.658 0.606 0.588 – –
Fig. 8 (a) M0 and (b) M00 values of CRFO100, as a function of
hopping [14]. By the determination of the maximum fre-quencies found through the calculation of the modules M00 it was possible to determine the energy of activation of the electric relaxation using Eq. 11. The obtained activation energy for each sample is given in Table4. A tendency of decrease of the activation energy (Eac) is observed with the increase of the PFN100 presence in the composite. The highest Eacvalue (0.658 eV) was measured for CRFO100. With the increase of the PFN concentration the Eacvalue is decreasing up to 0.58 8eV for PFN50. If you look for Table2 we can notice that for each composite there is a tendency of increasing the loss (tanga) with the increase in
temperature. In the case of PFN90 the loss increasing from 1.9910-2to 4.6910-2when we change the tempera-ture from 25°C to 100°C. Is a very small variation but it is enough to be detected by the modulus formalism. In Table2we can also notice that this is happening to all the composites. In Table4we can notice that the highest and
lowest values obtained for the activation energy was obtained for CRFO100 and PFN100 respectively. This is an indication that CRFO100 should have the lower loss and PFN100 the higher loss, which can be confirmed in Table2.
4 Conclusion
In this paper we did a study of the dielectric property (capacitance) in radio-frequency (RF) range as a function of temperature. The (TCC) of the composites [Pb(Fe1/2Nb1/2) O3(PFN)]Z–[CrYFe2-YO3(CRFO)]100-Z where Z=0%, 10%, 50%, 90% and 100% was measured. The XRD pat-terns of the composites were studied using the Rietveld procedure.
The Ritiveld method was used in the XRD analysis of the samples. The refinement present a good adjustment with Rwp varying between 10.57 and 17.3. For all the samples we have densities in the range of 83% to 88% of the expected theoretical densities.
The capacitance, dielectric permittivity, electric modu-lus and loss were studied in the frequency range of 100 Hz to 1 GHz and temperature range of 25°C to 100°C.
The PFN90 is presenting the higher value of the dielectric permittivity (eR =675) with the lowest value for
the loss (1.9910-2) at 25°C and 100 KHz. With the increase in temperature the PFN90 is always presenting the highest value of the eR and lower value of tanga for all
samples and temperatures. At 100°C the PFN90 is pre-senting eR value (1058.92) with loss (4.6910-2). The
PFN100 is also presenting values close to the PFN90 sample.
The measurements of eR and tanga in the frequency
range of 10 MHz to 1 GHz shows that PFN90 and PFN100 is also presenting values of the eR that are very close and
very stable in this region of frequency. At 1 GHz the highest eR = 28.89 and lowest tanga =9.3910-3 was
obtained for PFN100, however for 1.8 GHz the PFN90 is presenting the highesteR = 42.74.
The values of TCC for all the samples are presenting positive values. We can observe that the CRFO100 sample is presenting the lowest values for the TCC for the three frequencies under study (100 KHz, 200 KHz and 1 MHz). With the increase of the PFN presence (x is increasing) there is an increase of the TCC value for all frequencies. At 1 MHz the lowest obtained values are around 242 ppm/°C (CRFO100) and 404 ppm/°C (PFN100).
The study of the electric modulus (M0 and M00) as a function of frequency and temperature lead to the mea-surement of the activation energy (Eac), which is directed linked to the relaxation process associated to the interfacial polarization effect in the samples.
Fig. 9 (a) M0 and (b) M00 values of PFN10 as a function of
The calculation of the modulus revealed that the relax-ation of the samples CRFO100, PFN10 and PFN50 are activated by the temperature, while with the variation of the frequency these relaxations are not observed. The study of the electrical properties in the RF and MW range of frequencies is important in view of possible applications of these composites as future components in RF and MW circuits.
Acknowledgements This work partly sponsored by CAPES, FUNCAP and CNPq (Brazilian agencies) and the U.S. Air Force Office of Scientific Research (AFOSR) (FA9550-06-1-0543).
References
1. B. Kim, G.Y. Lee, W.J. Lee, J.H. Kim, Mat. Sci. Eng. B113, 198 (2004)
2. R.R. Vedantam, V. Subramanian, V. Sivasubramanian, V.R.K. Murthy, Mat. Sci. Eng. B113(2), 136 (2004)
3. H. Mosallaei, K. Sarabandi, IEEE Trans. Anten. Propag.52(06), 1558 (2004)
4. H.H.B. Rocha, F.N.A. Freire, R.C.S. Costa, R.S.T.M. Sohn, G. Orjubin, C. Junqueira, T. Cordaro, A.S.B. Sombra, Microwave Opt. Technol. Lett.49(2), 409 (2006)
5. F.N.A. Freire, H.H.B. Rocha, M.R.P. Santos, P.B.A. Fechine, F.M.M. Pereira, R.S.T.M. Sohn, I.F. Vasconcelos, A.S.B. Som-bra, J. Mater. Sci.43(1), 75 (2008)
6. E.A. Nenasheva, N.F. Kartenko, J. Eur. Ceram. Soc. 21, 2697 (2001)
7. R.M. German, Sintering theory and practice. (John Wiley & sons, New York, 1996), pp. 192–193
8. S. Ananta, N.W. Thomas, J. Eur. Ceram. Soc.19, 1873 (1999) 9. S. Saha, T.P. Sinha, J. Phys. Condens. Mat.14, 249 (2002) 10. B.W. Lee, I.R. Abothu, P.M. Raj, C.K. Yoon, R.R. Tummala,
Scripta Mater.54, 1231 (2006)
11. K. Srinivas, P. Sarah, S. Suryanarayana, Bull. Mater. Sci.26(2), 247 (2003)
12. A.K. Jonscher,Dielectric relaxation in solids. (Chelsea Dielectric Press, London, 1983)
13. A. Kyritsis, P. Pissi, I. Grammatikakis, J. Polym. Sci. Part B: Polym. Phys.33, 1737 (1995)
![Fig. 1 XRD patterns of composite samples PFN100, PFN90, PFN50, PFN10, and CRFO100 [* (Pb 2 (Nb 0.5 Fe 1.5 )O 6.5 )]](https://thumb-eu.123doks.com/thumbv2/123dok_br/15267215.540543/2.892.467.810.544.1032/fig-xrd-patterns-composite-samples-pfn-pfn-crfo.webp)