MEASURING CRUISER’S SATISFACTION OF LISBON AND
INTENTION TO RETURN TO PORTUGAL
AS INDEPENDENT VISITOR
Elodie Carreira Zeferino
Project submitted as partial requirement for the conferral of
Master of Science in Business Administration
Supervisor:
Professor Doctor Paulo Rita, ISCTE Business School Marketing, Operations and General Management Department
Co-supervisor:
Professor Doctor Sandra Loureiro, ISCTE Business School Marketing, Operations and General Management Department
MEASUR IN G C R UI S ER ’S S ATI S F ACT IO N O F LI S B ON AN D I NTE NTI ON T O RETU R N TO P ORTUG AL A S I ND EPENDE N T VI S IT OR
El
o
di
e
C
a
rre
ir
a
Zef
eri
n
o
i ACKNOWLEDGEMENTS
Realizing this one year project was not an easy trip and it was only possible with the support and motivation of every family member and friends who always tried to encourage me and believe in my work and capability to achieve the destination that seemed, sometimes, so longer.
For all hours of discussion, reviews and orientation, but also for the lessons and friendship, my truth thank to my thesis supervisors, Professor Paulo Rita and Professor Sandra Loureiro.
By the stolen hours of attention and affection, to my parents and sister, even whether sometimes they do not were sure what I was really doing, always encouraged me to keep doing and do not give up.
To the close friends that showed an unconditional support and willingness to help and motivate me, as Joana Serrano and Catarina Ramos.
ii ABSTRACT
Last years, the approach of the media about cruise tourism has becoming more relevant. As in the tourism as a whole, the cruise industry has been acting in a contradictory movement facing the economic and financial tendencies of Portugal, mostly because of the positive indicators, the arrival of more and bigger luxury cruise ships to the principal maritime ports, or the construction of new terminals, as a consequence of the activity increase. Nowadays, the weight of the tourism achieves more and more expression in Portugal and in 2012 around 5,7% of the GDP came from tourism receipts (WTTC).
The subsector of cruises is seen by the principal entities related to the sea with considerable potential to contribute to the growth of exportation: “The cruise tourism has been revealing one of the most
dynamic tourism segments, presenting good levels of growth, year by year” (PwC, 2012).
One of the most common and efficient ways to evaluate the tourism development is through the tourists’ feedback. As the efforts are driven to them, they are the ideal to evaluate and corroborate what the best has been made in the country in relation to the tourism activity. In research, “Satisfaction” is one of the most used “non-tourism keywords” in the cruise sector (Papathanassis & Beckmann, 2011). Through linear regression (Galton, 1894; Pearson, 1930) applied in a questionnaire conducted nearby the Port of Lisbon, it was studied the international passengers’ satisfaction and their behavioral intentions, such as intention to return and to recommend Portugal.
Keywords: Cruiser; Satisfaction; Intention to return; Lisbon; Multiple Regression
iii RESUMO
Nos últimos anos tem sido notória a crescente abordagem dos media sobre o turismo de cruzeiros. Tal como no turismo como um todo, a indústria dos cruzeiros tem actuado num movimento contraditório à tendência económico-financeira de Portugal, maioritariamente devido aos seus indicadores positivos, quer pela chegada de mais e maiores navios de luxo aos principais portos marítimos, ou pela construção, como consequência do aumento da atividade, de novos terminais. Hoje em dia, o peso da indústria do turismo tem ganho cada vez maior expressão, sendo que em 2012 cerca de 5,7% do PIB foi gerado com receitas do turismo (WTTC).
O subsector dos cruzeiros é visto pelas principais personalidades ligadas ao mar com um grande potencial para a contribuição do aumento das exportações: “O turismo de cruzeiros tem-se vindo a
revelar um dos segmentos turísticos mais dinâmicos, apresentando bons níveis de crescimento, ano após ano” (PwC, 2012).
Um das formas mais comuns e eficientes de se avaliar o desenvolvimento do turismo é através da opinião dos próprios turistas. Como o esforço é dirigido a eles, são os ideais para avaliar e corroborar o que de bem se tem feito no país em prol da atividade turística. Na área da investigação, “Satisfação” é uma das palavras mais utilizadas no sector dos cruzeiros (Papathanassis & Beckmann, 2011). Através de regressão linear (Galton, 1894; Pearson, 1930) aplicada a um questionário realizado junto ao Porto de Lisboa, foi avaliada a satisfação de passageiros internacionais, bem como as suas intenções de voltar e recomendar Portugal.
Palavras-chave: Passageiro de cruzeiro; Satisfação; Intenção de voltar; Lisboa; Regressão múltipla Sistema de Classificação JEL: L83 - Desportos; Jogos; Divertimento; Turismo, M31 – Marketing
iv INDEX Table of Contents Page Acknowledgements i Abstract ii Resumo Iii Table of Contents iv List of Appendix v List of Abbreviations vi
Executive Summary vii
Sumário Executivo ix
1. – Introduction 1
1.1. Motivations and Objectives 1
1.2. Problem Statement 2
1.3. Study Context 2
1.3.1. European Cruise Tourism Industry 3
1.3.2. The economic impact of Cruise Tourism Industry in Europe 5
1.3.3. Tourism facilities in European Ports 6
1.3.4. The travel and tourism contribution in Portugal 7
1.3.5. Lisbon and Funchal: two maritime ports of Portugal for cruises 8
1.3.6. Cruise passenger profile 10
2. – Literature Review 12
2.1. Tourism and Cruise Experiences 12
2.2. Cruise Tourism 16
2.3. Cruiser’s behavior 19
2.4. Cruise destinations 25
2.5. Cruiser’s intention to return to Portugal as independent visitor: satisfaction as a
mediator 27
2.5.1. Intention to return and willingness to recommend a tourist destination 27
2.5.2. Satisfaction as mediator 30
2.5.3. Determinants of cruise tourist satisfaction 34
2.5.4. Models used when studying tourist’s satisfaction and intention to return 38
3. - Conceptual Model 39
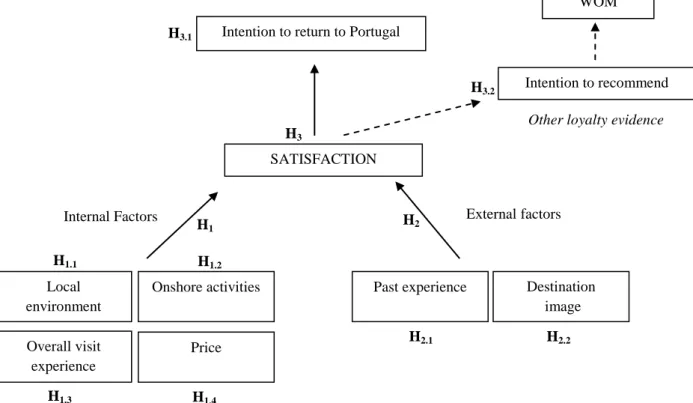
3.1. Proposed Conceptual Model and Research Hypotheses 39
4. - Research Methodology 42
4.1. Questionnaire design 42
4.2. Statistical Techniques Used 47
4.3. Data Collection 48
v
4.5. Measurement Scales 49
5. – Data Analysis and Results 51
5.1. Sample characterization 51
5.1.1. Socio-demographic profile of respondents 51
5.1.2. Influencer of travelling by cruise 52
5.1.3. Places visited and time spent 53
5.1.4. Loyalty to Cruise and to Lisbon 54
5.1.5. Overall satisfaction with Lisbon visit 54
5.1.6. Behavioral intentions 55
5.2. Internal Factors influencing Satisfaction 56
5.2.1. Local Environment 57
5.2.2. On-shore activities/services 57
5.2.3. Overall visit experience 57
5.2.4. Price 57
5.3. External Factors influencing Satisfaction 58
5.3.1. Past experience 58
5.3.2. Destination image 59
5.4. Assumptions considered to apply the MLRM 59
5.5. Model A: Internal Analysis 63
5.5.1. Model with Internal Factors and Overall Satisfaction 63
5.5.2. Internal Model with “Age” as dummy variable 64
5.5.3. Internal Model with “Loyalty” as dummy variable 65
5.6. Model B: External Analysis 66
5.6.1. Model with External Factors and Overall Satisfaction 66
5.6.2. External Model with “Age” as dummy variable 68
5.6.3. External Model with “Loyalty” as dummy variable 69
5.7. Model C: Global Analysis 71
5.7.1. Model with all factors and Overall Satisfaction 71
5.7.2. Global Model with “Age” as dummy variable 72
5.7.3. External Model with “Loyalty” as dummy variable 73
5.8. Overall Satisfaction and its relationship with Intention to return 74
5.8.1. Model with “Age” as dummy variable 75
5.9. Overall Satisfaction and its relationship with Intention to recommend 76
6. – Conclusions 77 6.1. Main conclusions 77 6.2. Implications 80 6.3. Limitations 81 6.4. Future research 82 7. – References 83 8. – Appendices 88
vi List of Appendix Page Appendix 1 – Chapter 1……….88 Appendix 2 – Chapter 2……….91 Appendix 3 – Chapter 4……….97 Appendix 4 – Chapter 5………...103
vii List of Abbreviations
EN EN Description PT PT Description
Bn Bn(s)
CATPCA Categorical principal components
analysis APL Administração do Porto de Lisboa
CLIA Cruise Lines International
Association APRAM
Administração do Porto da Região Autónoma da Madeira
CRM Customer Relationship
Management PIB Produto Interno Bruto
eWOM Electronic Word of mouth
EU European Union
FCCA Florida-Caribbean Cruise Association
GDP Gross Domestic Product
M M(s)
MLRM Multiple Linear Regression Model VIF Variance Inflation Factor
WOM Word of Mouth
WTTC World Travel & Tourism Council WTO World Tourism Organization SEM Structural Equation Model SLRM Simple Linear Regression Model
SPSS Statistical Package for Social Sciences
viii EXECUTIVE SUMMARY
The title of this dissertation is “Measuring cruiser’s satisfaction of Lisbon and the intention to return
to Portugal as independent visitor”. Due to the financial situation of the country and the considerable
potential of the cruise tourism, a study was raised to explore the behavior of cruise tourists.
The main objectives of this dissertation are:
(1) measure the satisfaction of cruisers about the most recent visit in Lisbon, not only in general, but also taking into consideration internal (in the cruise scope) and external (out of cruise scope) factors;
(2) identify the critical variables to be considered in order to positively influence satisfaction and, consequently, the intention to return to Portugal or to recommend it.
In order to achieve the main objectives of this dissertation an ordered methodology was adopted: - Firstly, it was presented the definition of motivations and objectives and the problem statement. - Then, a brief introduction of the international and national tourism sector and also of the cruise tourism sector was developed, in order to support the decision of the theme through a macro contextualization.
- In the next chapter, a literature review of the relevant publications about tourism, cruise tourism and cruiser’s behavior, and their respectively relationships with loyalty, destination image, satisfaction and intention to return was considered. Starting from the general to the specific, it was referred topics from what tourism is and what define tourist’s satisfaction, highlighting relevant authors of the area as Oliver (e.g. 1980), Bigné (e.g 2001), Petrick (e.g. 2004), Weaver (e.g. 2005), Alegre (e.g. 2006), Garau (e.g. 2010) or Brida (e.g. 2012).
- Subsequently and having in mind the main information extracted from the literature review, a conceptual model and its hypotheses were defined, as so as the research methodology followed. The model was divided in four parts: internal factors, external factors, overall satisfaction depending from those factors, and the behavioral intentions of cruisers.
- In the methodology, it was descripted all the characterization of the questionnaire (idioms, questions, scales, locals and dates, etc.), as well as the tools that are used to treat the data collected.
- The following part was the data analysis and main results presentation, as an outcome of questionnaires application to cruise passengers in Lisbon.
- Lastly, the major conclusions, research contributions, managerial implications were pointed out, not forgetting the dissertation limitations and future research suggestions.
ix Both objectives were accomplished. At the end of this dissertation the results showed that:
- International cruise passengers in Lisbon are mainly from UK; - They are travelling with their partner or family;
- Their average age is between 46 and 60 years old;
- A great portion is repeat cruiser and repeat visitor of Portugal;
- The influencer of the cruise holiday is normally the proper tourist, the partner or both;
- In general, they are satisfied with the visit to Lisbon; they intend to return and to recommend Portugal. “Recommendation” is the variable with better mean (4,5) and more percentage of answers with grade 5, from a 1 to 5 scale, among the three referred variables, although all received averages higher than 4.
- In the internal model, the dimension “Overall Visit Experience” reached the higher mean, mostly influenced by the best ranked attribute, the “Climate”.
- In the external perspective, the “Satisfaction with past experience” and the “Destination image” are also two favorable indicators, once both achieved a mean over than 4.
- Who have already been in Portugal took “Sun & Beach” or “Sightseeing” holiday in Lisbon or Algarve;
- International cruisers mostly recognize Portuguese promotion on TV and Travel Agencies and search for touristic information on the internet (search engine or official websites);
- “Price” was the dimension that most contribute for the goodness of fit of the internal and global models, whereas “Destination image” gave the highest positive contribution in the external analysis; - The association of the variable “Age” with the four internal dimensions (local environment, onshore activities/services, overall visit experience and price) resulted in the model with most percentage explained of the overall satisfaction by those independent variables: around 37,5% of the variance of overall satisfaction is justified by the variance of those five factors. However, only 48 cases were considered in that output.
- Yet 96 cases were the basis of the explanation of 36,8% of the variance of overall satisfaction by all the six dimensions (internal and external) plus the “Loyalty” factor;
- In a more significant sample (260 cases), only 12,5% of the overall satisfaction of cruisers is related to the “Destination image”, “Past experience” and “Loyalty” of cruisers;
- In relation to the link between “Overall satisfaction” and the cruisers’ behavioral intentions, the results were 13% for intention to return and 11,8% for intention to recommend, which means that perhaps there are other important factors that explain these behavioral intentions, besides the satisfaction.
x SUMÁRIO EXECUTIVO
O título desta dissertação é “Medindo a satisfação do passageiro de cruzeiro sobre Lisboa e a sua
intenção de voltar a Portugal como visitante independente”. Devido à situação financeira do país e ao
considerável potencial do turismo de cruzeiro, um estudo foi criado com o intuito de explorar o comportamento dos passageiros de cruzeiro.
Os principais objetivos da dissertação são:
(1) medir a satisfação dos passageiros de cruzeiro sobre a sua mais recente visita a Lisboa, não só no geral, mas também tomando em consideração fatores internos (no âmbito do cruzeiro) e externos (fora do âmbito do cruzeiro);
(2) identificar as variáveis críticas que afetem positivamente a satisfação e, consequentemente, a intenção de voltar a Portugal ou recomendar o país.
Com o intuito de atingir os principais objetivos da dissertação, foi adotada a seguinte metodologia: - Primeiramente foi apresentada a definição de motivações e objetivos, bem como a demonstração do problema;
- Depois, uma breve introdução do sector do turismo e também do sector do turismo de cruzeiro nacional e internacional foi desenvolvida, com o objetivo de suportar a decisão do tema através de uma contextualização “macro”.
- No capítulo seguinte, uma revisão de literatura das mais relevantes publicações sobre turismo, turismo de cruzeiro e comportamento do passageiro de cruzeiro e sua respetiva relação com lealdade, imagem do destino, satisfação e intenção de voltar foi considerada. Começando do geral para o específico, foi referido tópicos como o que é o turismo e o que define a satisfação do turista, sobressaindo autores relevantes das áreas, tais como Oliver (e.g. 1980), Bigné (e.g 2001), Petrick (e.g. 2004), Weaver (e.g. 2005), Alegre (e.g. 2006), Garau (e.g. 2010) ou Brida (e.g. 2012).
- Subsequentemente, e tendo em conta a principal informação extraída da revisão de literatura, um modelo conceptual e suas respetivas hipóteses foram definidas, tal como a metodologia do estudo seguida. O modelo foi dividido em quatro partes: fatores internos, fatores externos, satisfação global dependente destes fatores, e intenções comportamentais dos passageiros de cruzeiro.
- Na metodologia, foi descrita toda a caracterização do questionário (desde idiomas questões, escalas, locais e datas, etc.), assim como as ferramentas utlizadas para o tratamento dos dados recolhidos.
xi - A parte seguinte foi a apresentação da análise dos dados e dos principais resultados, como resultado da aplicação dos questionários aos passageiros de cruzeiro em Lisboa.
- Finalmente, as principais conclusões, contribuições para a investigação, implicações para a gestão foram apontadas, não esquecendo as limitações da dissertação e sugestões para futura investigação.
Ambos os objetivos foram atingidos. No fim da dissertação, os resultados mostraram que: - Os passageiros internacionais de cruzeiro em Lisboa são maioritariamente do Reino Unido; - Eles viajam com o seu parceiro ou família;
- A sua idade média está entre os 46 e os 60 anos:
- Uma grande porção é passageiro frequente (não é a primeira vez num cruzeiro) e visitante repetente de Portugal;
- O influenciador das férias de cruzeiro é normalmente do próprio turista, do seu parceiro ou de ambos:
- Em geral, eles estão satisfeitos com a visita a Lisboa, eles pretendem regressar e recomendar Portugal. “Recomendação” é a variável com melhor média (4,5) e mais percentagem de respostas com nota 5, numa escala de 1 a 5, entre as três variáveis referidas, embora todos obtiveram médias superiores a 4;
- No modelo interno, a dimensão “Experiência Geral da Visita” atingiu a média mais alta, maioritariamente influenciado pelo atributo interno mais bem avaliado, o “Clima”;
- Na perspetiva externa, a “Satisfação com experiência passada” e “Imagem do destino” são também indicadores favoráveis, uma vez que ambos conseguiram uma média superior a 4M;
- Quem já esteve em Portugal fez umas férias de “Sol e Praia” ou “Visita” em Lisboa ou no Algarve; - Os passageiros internacionais reconhecem promoção de Portugal na TV ou em Agências de Viagem e procuram informação turística na internet (motores de busca ou sites oficiais);
- “Preço” é a dimensão que mais positivamente contribui para a adequação do modelo interno e modelo global, enquanto “Imagem do destino” deu o maior contributo positivo na análise externa; - A associação da variável “Idade” com as quatro dimensões internas (ambiente local, atividades/serviços em terra, experiência geral da visita e preço) resultou no modelo com mais percentagem explicada da satisfação global por estas variáveis independentes: cerca de 37,5% da variância da satisfação global é justificada pela variância destes cinco fatores. No entanto, apenas 48 casos foram considerados neste resultado.
- Já 96 casos foram a base da explicação de 36,8% da variância da satisfação global por todas as seis dimensões (internas e externas) mais o fator “Lealdade”.
xii - Numa amostra mais significativa (260 casos), apenas 12,5% da satisfação global dos passageiros de cruzeiro está relacionada com a sua “Imagem do destino”, “Experiência passada” e “Lealdade”. - Em relação à ligação entre “Satisfação global” e as intenções comportamentais dos passageiros, os resultados foram de 13% para a intenção de voltar e 11,8% para a intenção de recomendar, o que significa que talvez existam outros fatores importantes que explicam essas intenções comportamentais, para além da satisfação.
1 1 - INTRODUCTION
1.1 Motivations and Objectives
First of all, in my view, it is important when developing a master thesis to emphasize a theme that has interest and particular proximity for us. In that sense, I started to think about activities I like to do, places I like to go, moments I like to share. Soon, I felt that the topic was chosen, because, for me, travelling is one of the best things I enjoy to do. Tourism is the main area of my dissertation, and joining this interest to the fact that I love my country and I believe that Portugal has a lot of potential places to be invested in terms of tourism (continent and islands), I decided to focus on Portugal as a brand destination. In general, Europe is an excellence choice for international tourists due to its localization, the diversity of places to visit, the culture offered and the climate that grants and, for sure, Portugal can take advantage of all this.
On the other hand, the financial situation that Portugal faces today helped me to strength my belief that it is in times like those that we should not give up and more than ever share our roots. Portugal is a wonderful country, even small, it is full of outstanding sites, from the typical beaches in the south (Algarve) to the amazing green landscapes in Gerês, evidencing also the beautiful and cultural cities as Oporto, Coimbra and Lisbon, never forgetting Azores and Madeira, considered as “pearls of the Atlantic”.
Nowadays, people that travel are looking for new ways of visiting places. Luxury tourism has been growing at a fast pace and being part of a cruise experience attract more and more tourists, once it is possible to get to know various countries in a short period of time. Moreover, doing a cruise is becoming more affordable and the passenger age can go from 1 to 99. As so, making tourists passing to Lisbon or Funchal without “forcing” them to exclusively visit these regions is surely a good weapon that Portugal can use in order to develop its tourism, receiving these tourists in the best possible way and making them “fall in love” with the country.
The main objective of this study is to understand how Portugal is seen as a destination brand by cruise passengers: are they willing to return to Portugal in a longer stay, after a one day experience in Portuguese lands? Are they satisfied with the visit? What did influence their satisfaction? Have Portuguese tourism entities already done something to attract them?
2 1.2 Problem Statement
In few words, what I propose is to study how cruise tourism, one of the fastest growing sectors in the industry, can influence positively the Portuguese economy, principally regional economies, as Lisbon and Madeira, two important European ports of call. Being characterized as luxury tourism but more and more contemporary, it is important to understand the behavior and intentions of the group of tourists that arrives to Portugal by cruise and how can they contribute to the Portuguese tourism sector. It is known among the scientific literature community that cruise tourism is not a very popular theme in the academic research (Wild & Dearing, 2000). Although some studies about cruise marketing and cruise tourists were developed in the last two decades, there is not so much evidence of studies which analyze the determinants that make a cruise tourist returning to a specific city or country (Brida and Coletti, 2010) and, additionally, what they really look for when they return. Actually, in the literature, there is a lack of approaches related to cruise destinations’ feedback by cruise tourists and the relationship between their feedback and their decision of whether returning or not returning.
Thus, the aim of this dissertation is to test the hypothesis related to cruise visitors measuring their satisfaction with Lisbon city and the relationship with the intention to return as land tourists for a future contribution to the wealth of Portuguese local destinations.
1.3 Study Context
The WTO Tourist 2020 Vision forecasts that tourism will continue to grow gradually with the total number of international arrivals estimated to be nearly 1,6 bn by 2020, a world average growth of 4,1% per year. The East Asia and the Pacific region will continue to rise in significance, establishing itself as the second largest region and achieving a market share of 25%, after Europe, the actual market leader, and probably the future one (Yeoman, 2006).
It is estimated that in the world there is a total of 82 cruise lines, composed by 390 ships approximately. Being part of that number are the main maritime cruise companies, such as Azamara Club Cruises, Carnival Cruise Lines, Celebrity Cruises, Costa Cruises, MSC Cruises, Princess Cruises, Royal Caribeean International, among others. Carnival is the market leader with a market
3 10,89
0,75 2,92 6,26
Global Source Markets by Cruise Passengers, 2012, in Millions
United States Canada
Rest of the World Europe
share of 21,2%, followed by Royal Caribbean with 16,4% of share and Costa Cruises (7,7%). The total worldwide cruise industry is estimated at $34,7 bn (Cruise Market Watch, Statistics, 2012).
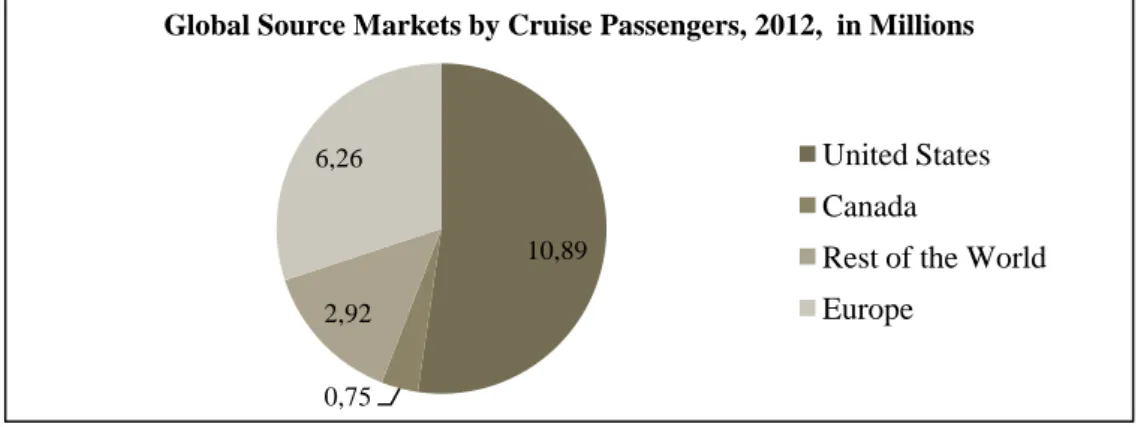
Since 2001, the number of international cruise passengers increased around 109%. From 9,91 M (in 2001) to 20,9 M passengers (in 20121), the North American's demand relative share, in relation to the total market, has been decreasing whereas the Europe’s demand relative share has been increasing, gaining position in the market (Figure 1.1 – Appendix 1). Nevertheless, US residents continue to be the number one in cruise tourism with 10,89 M passengers, followed by Europe (6,26 M), principally the UK2, Germany and Italy residents (Figure 1).
Figure 1 – Global Source Markets by Cruise Passengers
Source: Contribution of Cruise Tourism to the Economies of Europe in 2012, ECC, 2013 Edition
In order to shrink geographically the analysis, this brief contextualization has Europe3 as departure point.
1.3.1 European Cruise Tourism Industry
The diversity of the continent makes Europe an ideal holiday destination. Specifically, in the past decade, the EU has welcomed a relatively new phenomenon into the tourism industry: the cruise tourism. Due to its large expansion of coastlines, natural heritage, historical sites and variety of cultures, the EU makes an ideal cruise destination and, by consequence, the industry is adding significant economic value to EU members.
1
Unless otherwise stated, the year of reference for the presented statistics is 2012, and the comparison year is 2011
2 Unless otherwise stated, UK data includes Republic of Ireland 3
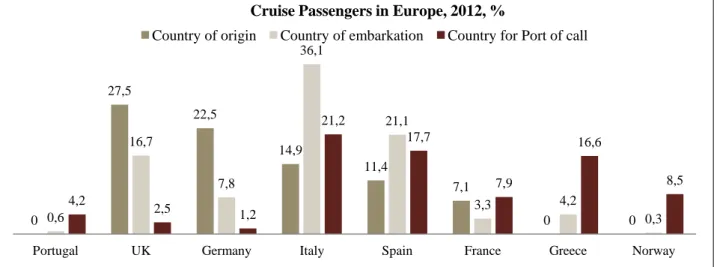
4 The ECC4 accounts the existence of 43 European cruise lines, operating in 131 cruise ships with a capacity of around 147.000 lower berths5. Another 76 ships with a capacity of approximately 102.000 lower berths are present in Europe by 22 non-European lines. In 2012, nearly €6,26 M European residents booked cruises, a 1,3% increase, representing around 30% of all cruise passengers worldwide. The UK was the country with more cruise passengers (€1,7 M - 27,5% of total share) followed by Germany (22,5%), Italy (14,9%) and Spain (11,4%). In terms of embarking, Italy obtained the biggest value with more than €2,08 M of passengers choosing an Italian port to start a cruise. Spain (21,1%) and UK (15,7%) are also frequent embarking ports. When talking about port-of-call visits, again Italy (23%) and Spain (18,7%) were the most attended countries, not forgetting Greece (17%), all of them have been registering high levels of attendance principally due to their location and coastal area (Figure 2).
Figure 2 – Cruise Passengers in Europe by country of origin/embarkation/port of call
Source: The Author from the data of “Contribution of Cruise Tourism to the Economies of Europe in 2012, ECC, 2013 Edition”
When referring to the leading cruise ports, ECC divides European ports in two: Mediterranean and Northern Europe. The first group of ports was leaded by Civitavecchia (Barcelona in 2011) in relation to the total of passengers with €2,2 M - embarking, disembarking and port-of-call visit -, followed by Barcelona (€2 M) and Venice (€1,8 M). Southampton (€1,5 M), Copenhagen (840 thousand) and Lisbon (523 thousand) were the three most attended Northern European ports. Lisbon was also considered the most attended North European port-of-call.
4 European Cruise Council 5
Used to measure the normal capacity of a ship when two beds in each cabin are occupied. 0 27,5 22,5 14,9 11,4 7,1 0 0 0,6 16,7 7,8 36,1 21,1 3,3 4,2 0,3 4,2 2,5 1,2 21,2 17,7 7,9 16,6 8,5
Portugal UK Germany Italy Spain France Greece Norway
Cruise Passengers in Europe, 2012, %
5 1.3.2 The economic impact of Cruise Tourism Industry in Europe
In the field of direct expenditures generated by cruise tourism, Italy is the leading country having totalized an income of €4,45 bn, followed by UK (€2,8 bn) and Germany (€2,5 bn) (Figure 1.2 – Appendix 1). Just the 3 countries represents 65% of the total industry direct expenditures of Europe. Generally, tours & entrance fees and shopping are the slices with more impact in the industry income.
Assuming the division that have been made by ECC, the direct cruise industry expenditures can be split in four big categories: cruise line purchases (representing 42% of the total of direct expenditures), value of shipbuilding (26%), passenger & crew purchases (23%) and cruise employees compensation (9%) (Figure 1.3 – Appendix 1). Summing those four categories, statistics say that all European countries gained around €15 bn (a 3,3% increase). The sectors that most influence this amount are, among others, transportation services, financial & business services, petroleum & chemicals, shipbuilding and retail trade.
Those direct expenditures generated around 326.904 jobs (direct - 48%, indirect - 37% and induced - 15%). Manufacturing has been the industry that most affects employment and employee compensation in cruise tourism in Europe. Italy, again, is the country that has more residents working in the industry (99.556) and, therefore, the first in compensation expenses (€ 3 bn), then UK and Germany. Portugal employs around 8.645 people and spends around €119 M in compensation.
In terms of individual expenditures, a tourist tends to spend €60 per port-of-call. Normally, tourists can choose two ways of visit a cruise destination: by themselves, with a cost of around €50 per passenger or by an organized excursion or tour, which is a little more expensive (€65 per passenger). When tourists stay one night in a embarking or disembarking port (principally due to airplane schedules or to visit more the city), they spend approximately €170 per passenger, whereas when they do not stay to overnight they just use to spend €45 (Tourist facilities in ports, EU, 2009).
For next years, some key trends will influence cruise ports and, therefore, be critical for local economies to know how to answer for this new mass tourism:
- the increasing ship capacity, i.e., more tourist activity; - the emerging cruise markets (e.g., China and India); - and the expanding cruise season.
6 1.3.3 Tourist facilities in European Ports
Yet in the maritime port scope, the same study previously mentioned (EU Commission, 2009) gave emphasis to tourist facilities in European ports presenting some important topics. Based on field visits and surveys, the key success factors identified for the regions located near the ports are:
- Tourist attractiveness of a destination/region: the most difficult and costly to change;
- Accessibility of a destination/region: also costly to change, but it is not intrinsically determined; - And the level of port facilities: the easiest and least costly to change.
The table below identifies which are the underlying variables and respective indicators for the three determinants of port attractiveness:
(1)Touristic attractiveness (2) Accessibility/Infrastructures (3) Port facilities
Intrinsic touristic value (Indicator: tourist bed density – Figure 3)
Accessibility of main touristic destination(s) (Indicators: relative distances to main touristic attraction, to nearest highway, nearest international airport, nearest railway station – less than 30 minutes is attractive)
Required port facilities 1st: sufficient draught 2nd: sufficient quay capacity 3rd: parking facilities 4th: waste disposal facilities Tourist friendliness
(Indicator: Own
perception/tourist survey)
Accessibility of transport hub(s)
(Indicator: relative distances to main touristic attraction(s) – less than 120 minutes is attractive)
Turnaround port facilities 5th: luggage handling facilities 6th: security and custom facilities 7th: terminal
Table 1 - Determinants for port attractiveness and underlying variables
Source: Tourists facilities in ports - The Economic Factor, EU Commission report, August 2009
Figure 3 - Tourist bed density per NUTS 3 coastal region
Source: Tourists facilities in ports - The Economic Factor, EU Commission report, August 2009
Based on the level of adaptability and importance for each determinant, a model was created on which ports can be scored according to their strengths and weaknesses. Using these perspectives, ports can
7 be categorized into eight types. The arrows at the bottom of the Figure 4 indicate the port strategies that should be targeted by ports. When the three determinants have a high score, the port is considered a cruise tourism hub. When there are fails in the port accessibility but all the rest continues well, we are talking about a pure transit destination. And finally, when the touristic attractiveness could be better, the port is considered a pure turnaround destination.
Figure 4 - Port categories and strategic objectives
Source: Tourists facilities in ports - The Economic Factor, EU Commission report, August 2009
Briefly and adapting Michel Porter’s generic strategies (1980), a port can adopt three types of strategies in relation to cruise tourism:
- Mass tourism driven by minimization of costs: Cost leadership;
- Driven by delivering high value and easy accessibility to the individual: Differentiation strategy; - And exclusive tourism seeking small segments to deliver uniqueness: Segmentation strategy.
1.3.4 The travel and tourism contribution in Portugal
Relatively to Portugal, the direct contribution6 of travel and tourism to the Portuguese GDP was €9,4bn, representing 5,7% of the total GDP. In terms of total contribution, it was about 15,9% of the GDP (around € 26,4 bn), what ranks Portugal as the 32th
country (out of 184) where travel and tourism
6
The UN Statistics Division-approved Tourism Satellite Accounting methodology (TSA:RMF 2008) quantifies only the direct contribution of Travel & Tourism. But WTTC recognizes that Travel & Tourism's total contribution is much greater, and aims to capture its indirect and induced impacts through its annual research.
8 Figure 6: Impact on GDP: Foreign vs. Domestic
Source: WTTC, 2013
Figure 5: Impact on GDP: Business vs. Leisure
Source: WTTC, 2013
87,3% 12,7%
Portugal
Travel & Tourism Contribution to GDP Business vs. Leisure, 2012 Leisure spending Business spending 63,5% 36,5% Portugal
Travel & Tourism Contribution to GDP Domestic vs. Foreign, 2012
Foreign visitor spending
Domestic spending more contribute to the country’s wealth (WTTC, 2013)7
. Concerning the employment, 325.500 direct jobs and 78.500 indirect jobs were supported by the tourism sector last year, which means that 18,5% of the Portuguese employees occupy functions directly or indirectly related to travel and tourism (WTTC, 2013). Travel and tourism sector has two different components: leisure and business. The same report concluded that 87,3% of the expenditure was generated by leisure purposes and 12,7% to business spending. Furthermore, 63,5% of the spending comes from foreign visitors and 36,5% from residents (Figures 5 and 6).
It will be further detailed in the next sub-chapter the cruise industry in Portugal, with special focus on the Ports of Lisbon and Funchal, since they are the most important maritime ports for cruise ships.
1.3.5 Lisbon and Funchal: two maritime ports of Portugal for cruises
The positioning of any port can be evaluated by its ranking in terms of number of passengers. The Port of Lisbon is considered the second most important in Portugal, the first is the Port of Funchal. But also in number of scales, Funchal becomes the first national port (Figures 1.4 and 1.5). However, it is given more emphasis to Lisbon port and its cruise passengers due to its proximity and available information.
The Lisbon region is the Portuguese best-known tourism region. It is already firmly established as one of Europe’s leading conference destinations and is increasingly popular for leisure tourism. The
7
9 Lisbon region is probably the only region in Europe that joins so much variety and choice for tourists into such a small geographical area, very important for cruise tourists that have a short time period to visit destinations.
The Port of Lisbon is a frequent point of entry used by international tourists and is one of the leading and largest cruise ship ports in Europe. The steady growth in passenger numbers over the years, principally since the beginning of the decade, has been one of the major arguments justifying the decision by the public authorities to build a bigger cruise ship terminal in Santa Apolonia area, the one receiving more scales (47%). The successive projects help to ensure improved facilities of cruise ship passengers to the city.
The best months for the Port of Lisbon are normally in the Spring (April, May) and in the Autumn (October), seasons that usually register more passengers attendance (APL, 2013)8.
Throughout the year, Lisbon is scale of numerous luxury cruise ships coming from several parts of the world, principally, Southampton (UK), Barcelona (Spain) and Palma de Majorca (Spain) - embarking ports - and some departing directly from Lisbon (APL, 2013).
The key indicators related to the Port of Lisbon have been facing a positive evolution. In terms of passengers, there has been noticed an increasing number of tourists passing in Lisbon (embarking, disembarking or port-of-call visit). Since 2007 (305.185 passengers), the evolution is going to 71%, in relation to last year (522.604) (Figure 7). Concerning the nationality of those passengers, the majority is from the UK (47%, representing 243.111 passengers), then Germany (17% - 88.104) and Italy (11% - 57.690). But, from the other side of the ocean, there is also an important representation of 10% in the US. Portuguese tourists only occupied 2% of the total of passengers (APL, 2013).
Since 2007, the number of scales in Lisbon evolved around 23%, although has decreased 5,1% last year. The other exception was in 2009, when it was registered -4,8% of scales (Figure 8) (APL, 2013), meaning that the number of scales is a more unstable indicator, depending on the booking made each year by the cruise lines companies. However, as the ships are being constructed with more and more capacity, this fact does not have direct impact in the evolution of number of passengers.
8
10 305.185 407.508 415.687 448.497 502.644 522.604 300.000 350.000 400.000 450.000 500.000 550.000 2007 2008 2009 2010 2011 2012 N u m b er o f p a ss enge rs
Evolution of number of passengers - Port of Lisbon
256 308 294 299 330 314 200 225 250 275 300 325 350 2007 2008 2009 2010 2011 2012 N u m b er o f sca le s
Evolution of scales - Port of Lisbon
Figure 7: Passengers in the Port of Lisbon
Source: APL, 2013
Figure 8: Scales in the Port of Lisbon
Source: APL, 2013
Yet Madeira is a green jewel in the Atlantic Ocean with 741 square kilometers. Its Laurissilva forest is recognized by the UN as a World Heritage Site. Funchal, the capital city, is a modern, cosmopolitan, rejuvenated city, well known for its many top class restaurants, stunning new 4 and 5 star hotels and warm all year round climate. Funchal has also for many years been one of the Atlantic cruise-ship’s main ports-of-call, located right in the middle of the town. The Port of Funchal is situated at 15 minutes on foot from the city center.
Concerning the number of passengers, the Port of Funchal is considered the first most important in Portugal and the sixth in the Iberian Peninsula. Not only in Europe (27th), but also in the world (61th), Madeira is well positioned, but not in any relevant international top 10 (APL, 2009). In 2012, there was a 9,8% increase of number of passengers (from 540.180 to 592.935) (Figure 1.6 – Appendix 1). Since 2007, the number of ships doing scale in that port also raised (28%), passing from 262 to 336 the number of scales done by cruises (Figure 1.7 – Appendix 1).
The best months for the Port of Funchal, in terms of number of cruise ships received, are usually March and April (beginning of Spring), November and December (Christmas and Winter holiday).
1.3.6 Cruise passenger profile
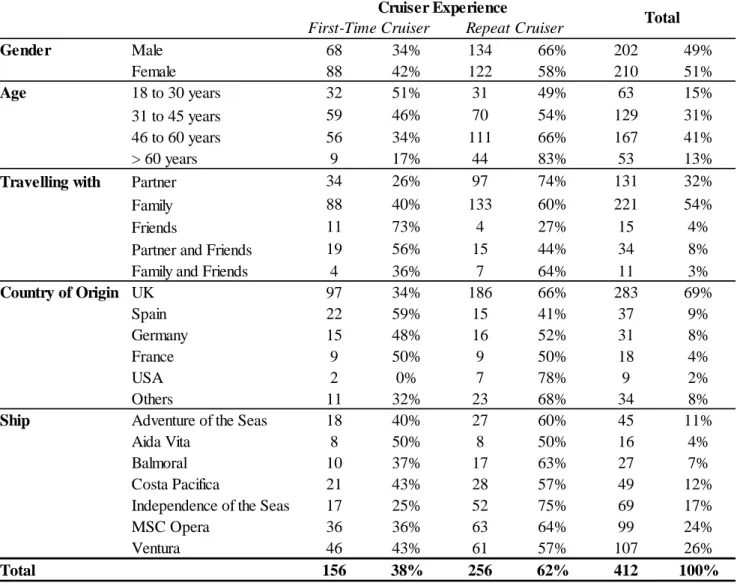
Based on a study developed by Portugal Tourism’s entity (Observatório do Turismo de Lisboa, 2012), it was analyzed the profile of some international passengers (996 people) doing scale in Lisbon. As already stated, UK, Germany, Italy, US and Spain are the countries that most bring tourists to Lisbon. Most of them come with its wife/husband and/or friends and for 52% it was the first cruise
11 experience, for 21% it was the second time. The most common past destinations already visited by them are Caribbean, Mediterranean and Northern Europe regions. Cruise tourists obtained information related to the trip mostly through internet (45%) and travel agencies (43%) and have as main motivations to do the cruise the following reasons: entertainment; relax and relieve the stress, also to be in contact with the sea.
Concerning the relation with Lisbon, 45% of the tourists visited the city on their own and 40% bought an onshore excursion on board. The main transport modes used were tourism bus, shuttles, on foot and taxis and the most visited places in the city were: Baixa-Chiado (83%), Belém (78%), Bairro Alto (73%), Parque das Nações (57%), Alfama/Castelo/ Mouraria (56%) and Estoril/Cascais (34%). Most distant but known places as well, such as Sintra, Fátima or Cabo da Roca were not so chosen due to time constraints. The products with more affluence in their shopping were wine (53%), pastry (38%), handicraft (36%) and postcards (33%) and the characteristics of the city most appreciated were the climate, local people, accessibility, the monuments, churches and museums and the possibility of visiting the city on foot. In average, each cruise tourist spent €118 during the journey in Lisbon (more €65 than the previous year).
Lisbon surpassed the expectations in 55% of the cases and it was just as expected for 43%, classifying their overall satisfaction with the city with 8,3 points (in a 1 to 10 scale). As a result, the intention of returning to Lisbon is an option for many tourists of the survey, since 23% answered that it was very /quite likely to return in cruise and 86% said that is very/quite likely to return in leisure (out of cruise trip). Other good indicator is the recommendation factor, where 97% of the tourists agree with the possibility of recommend Lisbon as a port-of-call for cruises and as touristic destination as well.
Talking about the itinerary, 37% of tourists affirmed that their choices would be the same even if Lisbon was not in the list of ports-of-call, whereas 3% answered that would not do the cruise without Lisbon in the itinerary. In fact, 65% had never been in Lisbon, however 22% had already visited out of cruise holiday and 12% in cruise holiday, i.e., 34% of interviews were at least once in Lisbon, and so, already know the city.
In general, tourists were very satisfied with Lisbon (since the average was 8,3 in a 1-10 scale) and 59% affirmed that would like to return, whereas 79% were likely to recommend the city.
12 2- LITERATURE REVIEW
“Research is to see what everybody else has seen and to think what nobody else has thought”
(J.R.R. Tolkien, English Writer and Author of The Lord of the Rings, 1892-1973)
This dissertation has all to do with the experience that a tourist has when choosing to do a cruise,as well as its proper behavior. It is also important to analyze the role of marketing in the tourism sector in order to assure that maritime ports as Lisbon and Madeira can take advantage of this luxury supersized ships and, by consequence, the people that arrive from any part of the world, almost every day in Portugal. The intent of this literature review is to understand what the authors have already written about the impact that cruise tourism has in local and national economies and, on the other hand, the motivations, reasons, experiences and intentions of a cruise tourist. Fundamentally, the principal aim is to understand what has already been discussed to contribute positively to the image of a destination through cruise tourism.
“It’s all about the experience (…). We’re not talking about your run-of-the-mill vacation here. We’re talking about a once in a lifetime, can’t stop talking about it, this rocks kind of experience”
Royal Caribbean International Cruise Line (2008)
2.1. Tourism and Cruise Experiences
The concept of leisure travel appeared in the 18th century, in the UK, during the Industrial Revolution. The middle class was incited to have more leisure time and the main destination was the French Riviera, principally Nice (Singh, 2008). As scientific area, the tourism was raised from other areas during the 90’s (Gilbert, 1990).
Among plenty of tourism definitions in the literature world, some of those were critically analyzed, as the case of Leiper (1995), Stear (2005) and Weaver (2010). The first one approached tourism as an open system with five elements (tourists, generating regions, transit routes, destination regions and a tourist industry), connected among each other and operating within different environments such as physical, cultural, social, economic, political and technological (Leiper, 1995). Ten years later, other definition, going through a marketing perspective, marked the tourism literature. Here, the author defends that tourism comprehends at least a one night away from the person’s home to satisfy leisure
13 Leisure Travel •Industrial Revolution, 18th century 20th century references •Manila Declaration on World Tourism, 1980 •Ottawa Conference on Travel and Tourism Statistics, 1991 •WTO, 1995 Leiper, 1995 •Tourism as a system composed by 5 interdependent elements Nowadays •Stear, 2005 - Satisfaction of leisure needs •Song, Witt & Li,
2009 and Song, Li, Witt, 2010 - Tourism measure •Weaver, 2010 - Demarketing Trend •CRM: to become tourists loyal •Tourism experience:
added value more than just satisfaction
wants and those needs are better satisfied in a temporary stay away from the usual home (Stear, 2005). Yet Weaver and Lawton (2010) changed somehow the way people normally interpreted the tourism concept, not due to their way of defining it9, but because of the introduction of “demarketing” concept,
which can be translated as applied marketing techniques, when demand exceeds supply, to reduce the number of tourists visiting a certain region, for instance, to preserve and protecting the nature.
Considered as an important social and economic phenomenon, in the Manila Declaration on World Tourism (1980), it was stated that tourism is, indeed, an essential activity to the life of nations, once it produces effects on social, cultural, educational and economic areas of the countries and on their international relations. In 1991, the concept was re-defined as the set of activities people make when travelling and staying in places outside their usual environment. According the WTO, tourism is “an activity which, in some form or other, mankind has undertaken for a very long time” and a tourist is a person "traveling to and staying in places outside their usual environment for not more than one consecutive year for leisure, business and other purposes" (WTO, 1995).
Tourism is predominantly measured by the number of arrivals and the level of tourist expenditure (receipts) in per capita terms (Song, Witt & Li, 2009; 2010). However, nowadays, to get those arrivals or receipts, marketers have on-hand new challenges, either related with strong competitors or weak customer basis, what makes tourism an area that absolutely needs CRM. This field has been an important strategy to attract and increase tourist arrivals as well as satisfying them and offering all facilities they need (Ivanovic et al., 2011). And this is how many authors define the success of a company of the sector: the capacity of attracting new tourists and become them loyal.
Figure 10 – Resume of tourism definition development
9
“The sum of the processes, activities and outcomes arising from the relationships and the interactions among tourists, tourism suppliers, host governments, host communities, and surrounding environments that are involved in the attracting, transporting, hosting and management of tourists and other visitors” (Weaver and Lawton, 2010)
Figure 9 – Resume of tourism definition development
14
Source: The Author, Compilation from different authors
Cohen (1979) defined tourism experience as the relationship between a person and a variety of “centers'' and that experience reflects some stable patterns of motivations both differentiating and characterizing various modes of tourists' activities. Pine and Gilmore (1998) and Berry, Carbone and Haeckel (2002) argue that in order to be successful, businesses should provide unforgettable and satisfactory experiences to their customers by adding value to their offerings. Today, and in the future, it is the ability to create personal experiences to customers that will give companies a sustainable competitive advantage (McCole, 2004; Prahalad and Ramaswany, 2004; Shaw and Ivens, 2005). At last, creating consistent customer experience becomes identical with the brand (Chang and Chieng, 2006). Nevertheless, some authors perceive that this activity and its inherent experience are only available to the affluent that have sufficient discretionary income to afford this luxury (McKercher, 2008). On cruise tourism, Ward (author of Berlitz Guide, Ocean Cruising & Cruise Ships, 2005:150) classifies cruise ships as being “Standard, premium, luxury or utterly exclusive”.
Knowing that every tourist destination has a certain combination of products, services and attractiveness, it is especially the cruise industry the one can offer that range of tangible and intangible items, from transportation, accommodation and meals to the symbolic and emotional benefits embedded in special personal service. Indeed, to define a touristic product it is important to take into account the attractiveness, the infrastructures and the accessibility (Rita, 1995). To choose the destination, tourists’ choices depend also on the combination of their tastes, wishes and interests, thus it is a marketing role the satisfaction of those tourists’ wishes as possible (Kwortnik, 2007, Mihelj, 2010). It is why the real challenge for the industry is to create a positive and right psychological environment and do not care only about technical things (John, 1994), since we are essentially talking about “real-time” services. Bonn et al. (2007) noted that researchers have focused on the effects of environmental factors (e.g., restaurants, hotels, leisure services, retail stores) on destination image. Therefore, there are evidences that the level of satisfaction in a destination also depends on the good experience that a tourist has on it (Brida et al., 2009). Before, Otto et al. (1996) had already developed a study which resulted in six different dimensions that can evaluate the affective component of service experience: hedonic, interactive, novelty, comfort, safety and stimulation. Each component gives some examples of characteristics and feelings that describe it (Figure 2.1 - Appendix 2).
15 Figure 10 – Resume of tourism experience concept
Source: The Author, Compilation from different authors
According to Weaver (2003) and based again on Cohen’s tourism bubble definition (1972), a cruise ship can be explained as a “place designed exclusively for tourists and those who serve them; where
the passengers and the crew are the actors; and where the activities by passengers and crew are scripted, scheduled, and closely monitored”.
In that intense closed bubble, it is a fact that social group interaction plays an important role in determining the quality of the tourist experience (Baker and Crompton, 2000; Cole and Scott, 2004). As Koth, Field, and Clark (1992) highlighted, three types of tourism activities - group tour, backpacking and cruise - are areas in which interactions among tourists are likely to be common and “potential development of social structure might occur”. The overall atmosphere of cruise vacations was recognized to be the condition shaping tourists’ behaviors onboard. Interestingly, negative meetings with other passengers apparently did not have a significantly adverse impact on the cruise experience, partly because passengers will not allow such negativity to ruin their vacation and managed to move away from them. This motivation immunized passengers against the negativity from fellow passengers (Jue et al., 2009).
Indeed, a cruise ship can become an authentic place of pressure, which means that by its quality of being a floating entity, there is almost total isolation of the tourists, except for occasions when the passengers leave the ship for an on shore visit (Jaakson, 2003). However, “for many tourists,
super-CRM / Marketing role
in Tourism
Develop tourism experience concept (Cohen, 1979; Pine and Gilmore. 1998; Berry, Carbone and Haeckel, 2002; McKercher, 2008): •Luxury •Uniqueness •Unforgettable •Added value Manage tourism as a brand (Chang and
Chieng, 2006) To achieve sustainable competitive advantage (McCole, 2004; Prahalad and Ramaswany, 2004;
Shaw and Ivens, 2005)
The experience results from a previous tourist choice of a combination of product, service, and attractiveness (Kwortnik, 2007; Mihelj, 2010)
It has a direct impact on the level of satisfaction of the tourist (Brida et al., 2009)
16
sized cruise ships have become the centerpiece of the cruise holiday. The ship has, in essence, become the trip” and this can be considered as a threat for local economies of the ports of call (Weaver, 2005).
It is important to highlight that without passengers on shore, many local economies cannot grow and they tend to gain less revenues than when receiving large thousands of tourists each year.
Academic research in cruise tourism has been relatively small (Wild & Dearing, 2000). In fact, there are only few academic textbooks introducing the topic (Papathanassis et al., 2011). Therefore, Papathanassis created a framework to demonstrate how distributed are the papers related with cruise research and it was possible to conclude that, in 2010, 31,9% of those papers were based on cruise themes as demand analysis and forecasting, marketing and branding, and service operations and management, points indirectly covered in this dissertation (Figure 2.2 – Appendix 2).
The next few pages are concerned to research already done about cruise tourism and the respective consumer behavior of cruise tourists.
2.2. Cruise tourism
The idea of cruising was realized for the first time by the founders of Peninsula & Oriental (P&O) in 1844 with the Mediterranean as the first destination (Lekakou et al., 2004). However, in the history of cruising, the mass-market cruise holiday was only created by Carnival Cruise Lines. This British-American company, established in 1972 in the US, promoted its ships as “Fun Ships” (Dickinson and Vladimir, 1997) turned an unknown company into the dominant force in the industry (Wood, 2000). Those ships, and not the ports of call, were advertised as the main holiday destinations for tourists (Weaver, 2005).
Today, cruise business is a growing segment of the international tourism market (CLIA, 1995; Hobson 1993; Peisley 1992). Industry research indicates that interest on cruise vacations continues to grow and that cruisers assess the experience as highly satisfying and with good value (CLIA, 2006). Actually, the WTO identifies cruising as one of the key trends for the future. The main characteristics for that kind of choice from tourists can be defined as: "time poor – money rich" concept, which means that tourists like the opportunity to see many things in short period of time. Cruising is the only possibility to do so (Mihelj, 2010). Moreover, cruises are destinations in themselves and, viewed in
17 this way, the cruise sector is among the top ten destinations both in number of arrivals and receipts. Although some barriers, as the economy and the instability of fuel costs, consumer interest on cruising continues being strong: a study says that 77% of past cruise tourists and 55 % of tourists who have not taken a cruise expressed interest on doing so within the next three years (Brida et al., 2009).
Figure 11 – Resume of the first boosters of cruise tourism
Source: The Author, Compilation of different information
There is truly a huge increase in passenger and cargo volumes. One of the major concerns for some cruise line companies has been the need of more terminals and infrastructures in the ports of call, what continues to be a problem for many (Beirne, 2006). There is no doubt that cruise ships bring money to local businesses and regions, but ensuring the sustainable development of a cruise destination has a very high cost for them (Brida et al. 2008).
Talking about the regions able to receive cruise ships, other important topic of the cruise ship meeting has to do with legal issues. It is known that many cruise ships are registered in foreign countries – principally in the Bahamas, Liberia and Panama - in order to avoid strict regulations, taxation and employment statutes in the United States (Bleecker, 2008). These named flags of convenience (FOC) permit cruise lines respecting the almost non-existent labor laws (Douglas, 2010). This can be a factor influencing the customer experience and intention to recommend and/or repurchase, as it is seen later.
Focusing on the Mediterranean market, cruise tourism is among the market segments whereas social and economic trends more contribute to the presence of a market expansion potential. This leads to forecast that more than 20 M people will cruise the Mediterranean and the Baltic Sea by the beginning of the next decade. This trend is supported by reasons, such as the high differentiated product provided with cruising, overnight stops and destinations choices, the consideration of Mediterranean Sea as a destination that can be visited throughout the year and the considerable improvement of European infrastructures (Lekakou et al., 2004).
20th century - "Fun Ships" promotion (Dickinson and Vladimir, 1997) Carnival Cruise Lines 1884 - Mediterranean market (Lekakou et al., 2004) P&O 70s and 80s - "Fun Ships" television promotion (Dickinson and Vladimir, 1997) "The Love Boat" series
18 Concerning economic impacts of this type of tourism, there is a common conviction that having cruise ships arriving to a destination produces a major economic impact on the local economy (Brida et al., 2009). The main expenditures a tourist can have when travelling through a cruise are, among others, air fares to and from the port of destination, accommodation, meals, shopping, attractions (all these last three in each port of call), not forgetting that a large portion of cruise passengers spend one or more nights in a destination while they wait to embark, which increases the expenditure spent at the homeport (Dwyer et al., 1998; SECTUR, 2003; Klein, 2005; Brida et al., 2009). All those expenses have a direct weight at regional level and, by consequence, at national level, helping to develop the economic activity. For example, in the Caribbean islands, cruises constitute more than 50% of the total of tourism arrivals generating important receipts through the services supplied by the port and the expenditures of passengers and crew (Brida et al., 2009). To summarize and organize all these types of expenditures, Dwyer et al. (1998) suggested a framework with six possible sources of benefits to an economy: (1) foreign exchange, (2) profit and taxes, (3) employment, (4) externalities, (5) terms of trade and (6) scales economies, showing that this kind of tourism induce multiple resources, different from each other, but all of them with national and/or regional impacts (Figure 2.3 - Appendix 2).
In addition to these economic effects, the cruise activity may provide to the destination an additional benefit of presenting the touristic attractions to thousands of people who may return as independent land tourists. This experience together with the particular characteristics of the passengers may influence the likelihood of a return visit. In fact, this argument is generally used by policy makers to give incentives to the cruise lines in order to be considered that port of call of their itineraries. This indicates that it is necessary for cruise destinations to study which factors determine returns, both those which refers to the characteristics and perceptions of the cruisers and those of the particular destination (Brida and Coletti, 2010).
Overall, what happens today is due to a huge evolution of mindsets and, consequently, it influences organizations and makes possible transforming what we call a basic touristic product in a customized holiday. But, in the 90s, this concept was not entirely applied and the McDonaldization thesis was developed and used to interpret a broad trend across the tourism industry (Ritzer and Liska 1997; Ritzer 1998). It presents 5 core principles (efficiency, calculability, predictability, control and the ‘‘irrationality of rationality’) and the inherent philosophy has to do with mass customization and McDonaldized standardization, promising efficiency and economies of scale. Nevertheless, about 10 years ago, and synchronized with global trends, a recent tendency within the cruise ship sector has
19
McDonaldization Theory (Ritzer, 1997) •5 core principles representing the
contemporary rationalization process •Standardized/uniform cruise holiday
Weaver, 2005 (Golden, 2003 and others) •Introduction of Risk and Post-Fordist
customization
• New needs and new trends • Customized cruise holiday
been felt concerning the introduction of various extra-fee services and facilities (Golden 2003; Sarna and Hannafin 2003). These can include extra-fee restaurants, duty-free shops, hair salons, health spas, among others, which allow tourists to customize and individualize their cruise vacations with the acquisition of those extra services, serving the interests of both cruise line companies and tourists. At the same time, it provides to the industry additional sources of revenue. The availability of cruisers to buy more products and services or simply select special attributes in their staterooms than the standard offer of the ship, for example, seems to contradict Ritzer’s belief related with standardized and uniform holiday experiences (Weaver, 2005).
Figure 12 – Resume of the McDonaldization theory and its criticism
Source: Compilation of different information
2.3. Cruiser’s behavior
But, what motivates a family or a group of friends to do on a cruise? Understanding the reasons people travel and how those reasons influence their destination choices is critical to plan appropriate marketing strategies (Heung et al., 2001; Petrick, 2004; Duman and Mattila, 2005; Hung and Petrick, 2011; Chen and Lin, 2012). Pearce and Caltabiano (1983) applied the well-known Maslow’s hierarchy of needs (1943) to the study of tourist travel motivations, suggesting that experienced travelers are more likely to go on trips to fulfill higher level of needs (i.e., self-actualization) than new travelers. Cruiser’s principal cruising motivations can be escape from usual environment and relaxation, prestige, enhancement of kinship relationships or friendships, novelty, convenience, destinations (which obtained 9 answers in 40 interviewees of a study), activities, services, etc. The motivation “Escape/Relaxation” was found to be the strongest cruise motivation, associating cruise tourism to freedom, escaping and relaxation (Hung et al., 2009).
Several studies have been made in order to create a model which demonstrates the different phases of leisure experiences and addressed motivations, since Clawson (1963) with the 5 decision “packages” to Chubb and Chubb (1981), Mannell and Iso-Ahola (1987), Moutinho (1987), Lee et al. (1994),