http://periodicos.uem.br/ojs/acta ISSN on-line: 1807-8672
Doi: 10.4025/actascianimsci.v40i1.42426 AQUICULTURE
Partial replacement of artificial diets by wet bioflocs biomass in Nile
tilapia culture tanks
Nayara Nunes Caldini, Hermano Hertz de Almeida Capistrano, Pedro Roberto Nogueira Rocha Filho and Marcelo Vinícius do Carmo e Sá*
Departamento de Engenharia de Pesca, Centro de Ciências Agrárias, Universidade Federal do Ceará, Av. Mister Hull, 2977, 60021-970, Campus do Pici, Fortaleza, Ceará, Brazil. *Author for correspondence. E-mail: [email protected]
ABSTRACT. The present work aimed to assess the partial replacement of artificial diets by wet bioflocs biomass in the culture of Nile tilapia juveniles. Fish were fed on different combinations of commercial dry diets (CD) and wet bioflocs biomass (BF), as it follows: 75% CD + 25% BF, 50% CD + 50% BF, and 25% CD + 75% BF, dry matter basis. There were also positive control tanks in which the fish received only commercial diet (100% CD), and three negative control tanks where the reductions of dry diets were not compensated by wet bioflocs biomass (75% CD, 50% CD, and 25% CD). Bioflocs were produced in one 500-L outdoor tank, which did not belong to the culture system, and it was called “separate BFT tank”, in which there was a daily adjustment of the C: N ratio of water to 15: 1, by the application of dry molasses to the water. There were no significant differences between the treatments for water pH, O2, TAN and NH3. Except by 25% CD, nitrite concentrations in water were lower
in bioflocs tanks than in the artificial diet tanks. The final body weight of fish was significantly higher in tanks that received only dry diets (21.9 ± 6.4 g) than in tanks with a combination of 50% dry diet and 50% wet bioflocs biomass (10.4 ± 2.5 g; p < 0.05). It can be concluded that the impairment on the growth performance of tilapia submitted to feeding restriction is lessened if wet bioflocs biomass is provided to the animals. Besides, the total substitution of artificial diets for wet bioflocs biomass in clear-water tanks is unfeasible because it leads to higher rates of mortality of tilapia in a relatively short period.
Keywords: aquaculture; bioflocs; dry diet; nutrition.
Substituição parcial de dietas artificiais por biomassa úmida de bioflocos em tanques de
cultivo de tilápia do Nilo
RESUMO. O presente trabalho teve por objetivo avaliar a substituição parcial de dietas artificiais por biomassa úmida de bioflocos, no cultivo de tilápia do Nilo juvenis. Os peixes foram alimentados com diferentes combinações de dietas comerciais (CD) e biomassa úmida de bioflocos (BF), como segue: 75% CD + 25% BF, 50% CD + 50% BF e 25% CD + 75% BF (base seca). Havia tanques controle-positivo, nos quais os peixes receberam apenas as dietas comerciais (100% CD), e tanques controle-negativo, nos quais as reduções de dieta seca não foram compensadas pela oferta de biomassa de bioflocos (75% CD, 50% CD e 25% CD). Os bioflocos foram produzidos em um tanque externo de 500 L, que não fazia parte do sistema de cultivo, o qual foi denominado de “tanque BFT avulso”. Esse tanque recebeu aplicações diárias de melaço em pó para ajustar a relação C: N da água para 15: 1. Não foram observadas diferenças significativas entre os tratamentos para pH, O2, NAT e NH3. Exceto pelos tanques 25%
CD, as concentrações de nitrito foram menores nos tanques BFT do que nos tanques que receberam apenas dietas comerciais. O peso corporal final dos peixes foi significativamente maior nos tanques que receberam apenas dietas secas (21,9 ± 6,4 g) do que nos tanques que receberam uma combinação de 50% de dieta seca e 50% biomassa úmida de bioflocos (10,4 ± 2,5 g; p < 0,05). Concluiu-se que a deterioração no desempenho zootécnico de tilápias juvenis submetidos à restrição alimentar (dietas secas) é minorada se a biomassa úmida de bioflocos for ofertada aos animais. Além disso, a substituição total das dietas artificiais por biomassa úmida de bioflocos, em tanques com águas claras, é inviável porque leva a mortalidades elevadas de tilápia, em um período relativamente curto.
Palavras-chave: aquicultura; bioflocos; dieta seca; nutrição.
Introduction
Currently, there is great interest in the super-intensive culture of fish and shrimp using bioflocs technology (BFT culture system). The BFT system for aquaculture is based on the promotion of a diverse
considered as incompatible among them: higher fish and shrimp yields and environmental sustainability (Crab, Defoirdt, Bossier, & Verstraete, 2012). The culture water is treated inside the BFT tanks, which demands little or no water exchange. Therefore, the environmental impact of BFT tanks is minimal or even zero. Besides, the occurrence of disease outbreaks is lessened in BFT tanks because they form a closed system with minimal water input (Dauda et al., 2018). The adjustment of the C:N ratio of water to 15 – 20: 1 allows the development of bioflocs, which remove ammonia from water (Luo et al., 2014), and that also could be used as a nutritional source by the cultured animals (Luo, Zhang, Cai, Tan, & Liu, 2017). The reduction of the protein content of artificial diets may be possible if plenty of bioflocs are available to the animals as supplementary food (Avnimelech, 2007).
The Nile tilapia (Oreochromis niloticus) can efficiently use bioflocs biomass as feed (Avnimelech, 2007). Accordingly, some studies have been made about the rearing of tilapia juveniles in BFT tanks (Lovera-Zapata et al., 2017; Luo et al., 2014; Widanarni & Maryan, 2012). Widanarni and Maryan (2012) stated that the application of BFT in red tilapia culture may improve the water quality as well as reduce external feed requirement. Luo et al. (2014) found that tilapia grew 22% more in BFT tanks than in RAS (recirculating aquaculture system) tanks. Long, Yang, Li, Guan, and Wu (2015) observed that BFT increased tilapia growth rate and net yield when compared to non-C:N ratio adjusted tanks. Lovera-Zapata et al. (2017) concluded that the adjustment of the C:N ratio of BFT tanks to 10:1 produced faster tilapia growth than to 15:1 or 20:1.
Although dried bioflocs can contain more than 30% of protein, the feeding of fish exclusively on bioflocs may be inappropriate to attain regular animal performance, probably due to essential amino acid and fatty acid deficiencies (Caldini, Cavalcante, Rocha Filho, & Sá, 2015; Ekasari et al., 2014). A better approach to attain higher growth rates would be the mixed allowance of artificial diet and bioflocs (Anand et al., 2014). It is still to be found the ideal proportions of artificial diets and bioflocs biomass to be used in Nile tilapia culture tanks.
The present work aimed to assess the partial replacement of artificial diets by wet bioflocs biomass in the culture of Nile tilapia juveniles.
Material and methods
Nile tilapia juveniles with body weight between 1.0 – 2.0 g were obtained from a regional producer
and transported to the laboratory facilities. Initially, fish were maintained for four days into one 1,000 L tank provided by non-stop aeration for acclimatization. In this initial phase, the fish were fed on four times daily, at 8 a.m., 11 a.m., 2 p.m. and 5 p.m., with a 49% crude protein (CP) commercial diet for tropical fish (Initial Fri-Aqua, Trouw Nutrition, Nutreco Brazil), at 5% of live weight per day.
The study was carried out in a clear water indoor experimental system which has 30 polyethylene 100 L tanks. Each culture tank was stocked with three 1.77 ± 0.05 g fish or 53.2 ± 1.5 g m-3 at the onset of
the experiment and maintained for 8 weeks. The culture tanks were served by nonstop mechanical aeration provided by one 2.5 hp air blower. The fish were fed three times daily, at 8 a.m., 12 p.m. and 4 p.m., with commercial dry diets. There was no water exchange in the culture tanks over the entire period, just water replenishment to maintain the initial level.
The experimental fish were fed on different combinations of artificial food, i.e., dry commercial diets, and natural food, i.e., wet bioflocs biomass (Table 1). The commercial diets used sequentially over the study were the following: 1 - powdered diet with 49% CP (Initial Fri-Aqua, Trouw Nutrition, Nutreco Brazil); 2 - pelletized 1.0 mm diet with 43% CP (Fingerling Fri-Aqua, Trouw Nutrition, Nutreco Brazil); 3 - pelletized 2 – 4 mm diet with 36% CP (Juvenile Fri-Aqua, Trouw Nutrition, Nutreco Brazil). As the input of dry diet was reduced, the input of wet bioflocs biomass was proportionally increased on a dry matter basis. In the 100CD positive control, the fish just received commercial diets as food throughout the study. In the 100BF experimental treatment, the fish just received wet bioflocs biomass as food over the experiment. In the 75CD + 25BF, 50CD + 50BF and 25CD + 75BF experimental diets, there were mixed allowances of commercial diet and wet bioflocs biomass, in different proportions, depending on the treatment. In the 75CD, 50CD and 25CD negative controls, the fish received the same amount of commercial diet delivered to the treatments 75CD + 25BF, 50CD + 50BF and 25CD + 75BF, respectively (Table 1).
The bioflocs biomass was produced in one 500 L outdoor tank separated from the culture system. The separate BFT tank received nonstop mechanical aeration provided by one 2.5 hp air blower connected to silicone hoses and porous stones. One 2,000 L h-1 underwater pump was placed inside the
Those fish were fed daily with a 36% CP commercial 2 – 4 mm diet at 3.5% of the stocked biomass.
Table 1. Proportions of commercial diet (CD) and wet bioflocs biomass (BF) delivered daily to Nile tilapia juveniles.
Treatment Function n Commercial diet (%)
Bioflocs biomass (%)
Total (%)
100CD Positive
control 5 100 0 100 75CD + 25BF
Experimental treatment
4 75 25 100
50CD + 50BF 4 50 50 100 25CD + 75BF 4 25 75 100
100BF 4 0 100 100
75CD
Negative control
3 75 0 75
50CD 3 50 0 50
25CD 3 25 0 25
The C:N ratio of water was adjusted daily to 15:1 in the separate BFT tank by means of dry molasses applications, according to the equation:
∆CH (addition of carbohydrate) = [artificial diet delivered (g/day) x % N artificial diet (% crude protein x 0.16) x 0.5]/0.07, based on Avnimelech (1999). Determinations of total settable solids (TSS) with Imhoff cones were carried out three times a week to assess the bioflocs development. The bioflocs biomass harvests started when TSS reached 100 mL L-1 or higher. A temporary suspension of the
molasses applications was practice always when the concentrations of O2 into the separate BFT tank
dropped below 5 mg L-1.
Prior to the first meal, a 1,000 mL water sample was withdrawn daily from the separate BFT tank. The collected water sample was filtered with a
40-μm mesh sieve to retain the wet bioflocs biomass. The obtained wet bioflocs biomass was weighed in a precision scale to determine its density, in g L-1, after
the regular procedure (oven drying at 103°C until constant weight). It was discovered that the wet bioflocs biomass contained approximately 10% dry matter. The required volume of wet bioflocs biomass applied into each culture tank was determined by considering the treatment in case (Table 1), the feeding rate employed and the bioflocs biomass density in the separate BFT tank. The following example is provided in order to explain the previous outlined procedure: (1) average body weight of fish = 3.3 g and total fish biomass = 10 g; (2) experimental treatment #3 (Table 1), that is, 50% artificial diet + 50% bioflocs biomass; (3) density of the wet bioflocs biomass into the separate BFT tank = 1.2 g L-1. In that day, the volume of wet
bioflocs biomass to be applied into that culture tank was obtained through the following steps: (1) as the feeding rate for the fish body weight of 3.3 g is 6.3% and the stocked fish biomass was 10 g, the daily
feeding allowance was 0.63 g; (2) as the experimental treatment in question was 50% artificial diet and 50% bioflocs biomass, the daily feeding allowance was split in half, that is, 0.315 g artificial diet + 0.315 g bioflocs biomass; (3) as it was considered that the wet bioflocs biomass contained 10% dry matter, the wet bioflocs biomass corresponding to 0.315 g dry bioflocs biomass was equal to 3.15 g (0.315 g/0.1); (4) as the density of wet bioflocs biomass in that specific day was 1.2 g L-1,
the volume of wet bioflocs biomass to be applied into that culture tank was equal to 2.62 L (3.15 g/1.2 g). A significant sample of the bioflocs biomass was withdrawn from the separate BFT tank, dried in a laboratory oven at 100°C for 12h and sent to the animal nutrition laboratory (Animal Sciences Department, Universidade Federal do Ceará, Fortaleza, Ceará) to determine its centesimal composition by the Association of Official Analytical Chemist (AOAC, 2005) standard methods.
The pH, temperature and specific conductance of water were determined twice a week, at morning (8 a.m.) and afternoon (4 p.m.), by the use of the mPA210 pH-meter (MS Tecnopon, Piracicaba, Brazil), a mercury thermometer, and the CD-850 conductivity meter (Instruthem Instrumentos de Medição Ltda, São Paulo, Brazil), respectively. Once a week, the concentrations of total ammonia nitrogen (TAN – indophenol method), nitrite (spectrophotometry at 543 nm) and dissolved oxygen (YSI 55 oxygen meter, Yellow Springs, USA) were measured; We carried out fortnightly
determinations of free CO2 (titration with a
Na2CO3 standard-solution), total alkalinity (titration
with a H2SO4 standard-solution), total hardness
(titration with an EDTA standard-solution), reactive phosphorus (spectrophotometry at 690 nm) and total dissolved sulfide (titration with a Na2S2O3
standard-solution). The spectrophotometer used was the Genesys 20 (Thermo Fisher Scientific). The concentrations of NH3 and H2S in water were
calculated through the results of TAN and total dissolved sulfide, respectively (El-Shafai, El-Gohary, Nasr, Van der Steen, & Gijzen, 2004). All water quality methods were the same performed by Cavalcante, Lima, and Rebouças (2017).
The water quality and animal performance variables were analyzed by one-way ANOVA. The assumptions of normal distribution (Shapiro-Wilk’s test) and homogeneity of variance (Levene’s test) were checked before the analyses. The different means were compared by pairs with the Tukey’s test. The 5% significance level was adopted in all tests. The statistical analyses were carried out with the aid of the BioStat 5.0 (Ayres, 1998) and Excel 2013 software.
Results and discussion
Bioflocs biomass quality
The biochemical composition of bioflocs is probably influenced by their biological composition (Widanarni & Maryan, 2012). Therefore, two bioflocs with distinct genera of bacteria and microalgae are expected to have dissimilar biochemical composition. The proximal composition of bioflocs biomass on dry matter basis was the following: crude protein = 23.5%, ether extract = 3.5%, ash = 33.8% and crude fiber = 4.8%. Azim and Little (2008) found the following bioflocs composition in their study, dry matter basis: crude protein = 37.9 – 38.4%, ether extract = 3.1 – 3.2%, ash = 11.8 – 13.2% and crude fiber = 5.7 – 6.2%. Therefore, the bioflocs biomass obtained by Azim and Little (2008), with higher protein and lower ash, had a higher nutritional value than the biomass produced in the present experiment. While Azim and Little’s bioflocs were already inside the treatment tanks from a previous experiment, the bioflocs of our study were developed into one separate tank. It seems that autochthonous bioflocs, such as those present in Azim and Little (2008) work, have a superior nutritional profile than allochthonous bioflocs, such as those of our study.
The biological composition of autochthonous bioflocs might be formed by protein-richer organisms than that from allochthonous bioflocs. Kuhn et al. (2010), however, produced dried bioflocs in biological and batch reactors with almost 40% CP, a level similar to Azim and Little (2008). Kuhn et al. (2010) used effluents from an inland tilapia farm with RAS as the bioflocs’ culture medium. One possibility is that the Kuhn’s farm effluents might have more protein than the water used in the bioflocs tanks from our experiment, which probably leads to a better condition to produce protein-rich bioflocs. Contrarily, Azim, Little, and Bron (2008) observed that the bioflocs quality (microbial protein) was not related to the quality of the feeds used as protein organic matter
(35 and 22% CP). Hence, the key factors driving the bioflocs quality remain to be disclosed.
Water quality
There were no differences between the treatments for water pH, O2, TAN and NH3 (Tables
2 and 3). A usual characteristic of intensive fish culture is the quick accumulation of nitrogenous compounds in water, because fish can retain only 20 – 40% of the organic nitrogen allowed to them through artificial diets (Avnimelech, 2007; Cyrino, Bicudo, Sado, Borghesi, & Dairik, 2010; Michelato, Furuya, & Gatlin III, 2018). In the present work, however, the low fish stocking density employed
(53.2 ± 1.5 g m-3) has not promoted TAN
accumulation into the tanks. Besides, part of TAN was probably converted to nitrite in nitrification process, which was facilitated by the nonstop aeration in all tanks. Those were the two probable reasons for the low TAN concentrations. However, even lower levels of TAN were expected in the bioflocs tanks because bioflocs can vanish TAN from water (Avnimelech, 2007; Azim & Little, 2008; Crab, Avnimelech, Defoirdt, Bossier, & Verstraete, 2007; Schryver, Crab, Defoirdt, Boon, & Verstraete, 2008). That, however, has not happened in the present work probably because the bioflocs were added as a feeding supplement, and not developed inside the culture tanks. Although the replacement of dry diets by wet bioflocs biomass has drawn no benefit on lessening TAN levels in culture water, there were lower levels of nitrite in the bioflocs tanks (Figure 1).
Intensive fish culture is prone to cause deterioration in water quality due to the accumulation of nitrogenous compounds such as ammonia, nitrite and nitrate in water (Crab et al., 2007). The nitrite produces meta-hemoglobin in fish blood, and this form cannot transport O2 to
The bioflocs origin or source is a possible explanation for the disagreement between the present work’s and previous works about TAN levels. Whereas the bioflocs in the studies cited above were already produced inside the culture tanks, the bioflocs in our research were produced outside the culture tanks. Those results suggest that bioflocs produced in a separate tank and subsequently delivered into the culture tanks have a lower capacity to withdraw TAN from water, when they are compared with the bioflocs that are already produced inside the culture tanks themselves. It is possible that the former bioflocs, i.e., allochthonous bioflocs were less adapted to the culture media than the latter ones, i.e., autochthonous bioflocs.
Figure 1. Concentration of nitrite in Nile tilapia culture tanks. Fish were fed on different proportions of artificial diet and wet bioflocs biomass. 100CD: 100% commercial dry diet. 100BF: 100% wet bioflocs biomass. 75CD + 25BF: 75% commercial dry diet and 25% wet bioflocs biomass. 50CD + 50BF: 50% commercial dry diet and 50% wet bioflocs biomass. 25CD + 75BF: 25% commercial dry diet and 75% wet bioflocs biomass. 75CD, 50CD and 25CD: 75%, 50% and 25% of the amounts delivered to 100CD, respectively. Means, in the last rearing week, with distinct letters are significantly different between themselves by the Tukey’s test (p < 0.001; n = 5, 4 or 3; please see Table 1).
The total alkalinity of water was strengthened because less artificial diet was delivered to the tanks (Table 2). There was probably less CO2 in tanks
with lower feeding allowances and free CO2 reacts
with the molecule of water and it forms carbonic acid that reduces alkalinity (Boyd, Tucker, & Somridhivej, 2016). Besides, the total alkalinity of water was higher in tanks that received only bioflocs biomass (100BF) than in the tanks that received just artificial diet (100CD). Alkalinity consumption by nitrifying bacteria is expected to be higher than by heterotrophic ones (Ebeling, Timmons, & Bisogni, 2006). The nitrifying activity was probably more intense in the non-bioflocs tanks (75CD, 50CD and 25 CD) than in their counterparts (75CD + 25BF, 50CD + 50BF and 25CD + 75BF, respectively). Therefore, the alkalinity requirement was higher in the former tanks than in the latter ones (Table 2).
Those results suggest that the partial replacement of artificial diets by wet bioflocs biomass might reduce the impact of feeding management on the total alkalinity of the Nile tilapia’s fish tanks. This replacement would be an interesting management to achieve better water quality, if the growth performance of the fish had not been affected by it (Table 4).
Table 2. pH, specific conductance, total alkalinity and total hardness of Nile tilapia juveniles’ tanks (body weight = 1.77 ± 0.28 g) fed on different proportions of commercial diet (CD) and wet bioflocs biomass (BF). The displayed results refer only to the last rearing week (mean ± S.D.; n = 5, 4 or 3; please see Table 1).
Treatment² Variable¹
pH SC TA TH 100CD 8.34 ± 0.05 770 ± 22ab³ 100 ± 17b 170 ± 24a 75CD + 25BF 8.26 ± 0.02 792 ± 9a 115 ± 24ab 177 ± 27a 50CD + 50BF 8.23 ± 0.03 799 ± 31a
114 ± 12ab
178 ± 27a 25CD + 75BF 8.28 ± 0.03 783 ± 10ab 124 ± 13a 183 ± 29a 100BF 8.30 ± 0.04 818 ± 7a 119 ± 8a 180 ± 23a 75CD 8.29 ± 0.01 751 ± 8b 107 ± 10ab 168 ± 23b 50CD 8.23 ± 0.01 767 ± 6b
110 ± 9ab
167 ± 19b 25CD 8.29 ± 0.02 769 ± 47b 113 ± 13ab 164 ± 23b ANOVA P ns4 < 0.01 < 0.01 < 0.001
1pH of water, specific conductance (μS cm-1), total alkalinity (mg L-1) and total hardness
(mg L-1); 2100CD: 100% commercial diet. 100BF: 100% wet bioflocs biomass. 75CD +
25BF: 75% commercial diet and 25% wet bioflocs biomass. 50CD+50BF: 50% commercial diet and 50% wet bioflocs biomass. 25CD+75BF: 25% commercial diet and 75% wet bioflocs biomass. 75CD: 75% of the amount delivered to 100CE. 50CD: 50% of the amount delivered to 100CD. 25CD: 25% of the amount delivered to 100CD; 3For each variable, means with different letters in a same column are
significantly different between themselves by the Tukey’s test (p < 0.05); absence of letters indicates that the differences between the means are not significant (p > 0.05);
4Not significant (p > 0.05).
Higher concentrations of reactive phosphorus in water were found in tanks with increased artificial diet allowances (Table 3). Just a small percentage of the total phosphorus that enters the tank via feeding is retrieved by the fish biomass, because there is a significant loss of phosphorus to water through fish excretion (Cyrino et al., 2010). Schneider, Sereti, Machiels, Eding, and Verreth (2006) have stated that heterotrophic bacteria associated with bioflocs could absorb phosphates from water. Those last authors observed that increased bioflocs biomass lowered the concentrations of orthophosphate in water. That, however, has not happened in the present work, since there was no significant effect on reactive phosphorus between the experimental treatments and their respective negative controls (Table 3). However, while Schneider et al. (2006) used autochthonous bioflocs, we used allochthonous bioflocs, which were produced in one separate tank. Therefore, allochthonous bioflocs seem to be inferior to autochthonous bioflocs as cleaning agents of the culture water.
Animal performance
the culture tanks, such as bioflocs (Vinatea et al., 2018). Therefore, bioflocs could reduce the required protein in aquaculture diets and, accordingly, reduce production costs. Although the total substitution of artificial diets by bioflocs leads to growth impairment, even minor substitutions could bring a significant reduction in the feeding cost, since the acquisition of artificial diets is a major expense (Ahmad, Rani, Verma, & Maqsood, 2017). All fish from 100BF died before the fifth rearing week (Table 4). This result pointed out that bioflocs had a lower nutritional value than the complete commercial diets used. Wasielesky, Atwood, Stokes, and Browdy (2006) have said that it is inappropriate to feed shrimp solely on bioflocs, regardless the bioflocs’ crude protein level obtained. Those authors have considered as ideal a combination between artificial diet and bioflocs biomass. Wasielesky et al. (2006), however, have not declared which proportions of artificial diets and bioflocs biomass should be used.
Table 3. Dissolved oxygen, total ammonia nitrogen, NH3 and
reactive phosphorus of Nile tilapia juveniles’ tanks (body weight = 1.77 ± 0.28 g) fed on different proportions of artificial diet (commercial fish diet) and wet bioflocs biomass (mean ± S.D.; n = 5, 4 or 3; please see Table 1). The displayed results refer to the last rearing week.
Treatment² Variable¹
DO2 TAN NH3 React P 100CD 7.69 ± 0.92 0.29 ± 0.16 0.04 ± 0.03 2.34 ± 1.88 a³ 75CD + 25BF 7.70 ± 0.85 0.19 ± 0.13 0.02 ± 0.01 2.28 ± 1.85 a 50CD + 50BF 7.62 ± 0.83 0.22 ± 0.13 0.02 ± 0.01 1.90 ± 1.40 a 25CD + 75BF 7.47 ± 0.81 0.26 ± 0.19 0.03 ± 0.02 1.56 ± 1.20 b 100BF 7.62 ± 0.63 0.28 ± 0.18 0.03 ± 0.02 0.27 ± 0.22 c 75CD 7.69 ± 0.74 0.28 ± 0.17 0.03 ± 0.02 2.34 ± 2.07 a 50CD 7.69 ± 0.78 0.22 ± 0.13 0.02 ± 0.01 1.91 ± 1.53 a 25CD 7.92 ± 0.65 0.17 ± 0.14 0.02 ± 0.01 1.15 ± 0.97 b ANOVA P ns4 ns ns < 0.001
1Dissolved oxygen (mg L-1), total ammonia nitrogen (mg L-1), non-ionized ammonia
(mg L-1) and reactive phosphorus (mg L-1); 2100CD: 100% commercial diet. 100BF:
100% wet bioflocs biomass. 75CD + 25BF: 75% commercial diet and 25% wet bioflocs biomass. 50CD+50BF: 50% commercial diet and 50% wet bioflocs biomass. 25CD+75BF: 25% commercial diet and 75% wet bioflocs biomass. 75CD: 75% of the amount delivered to 100CE. 50CD: 50% of the amount delivered to 100CD. 25CD: 25% of the amount delivered to 100CD; 3For each variable, means with different letters
in a same column are significantly different between themselves by the Tukey’s test (p < 0.05); absence of letters indicates that the differences between the means are not significant (p > 0.05); 4
Not significant (p > 0.05).
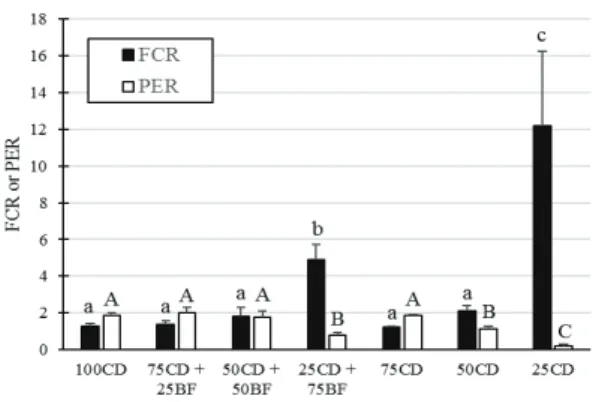
Despite the lower nutritional value of bioflocs biomass, the significant improvement of PER on the treatment 50CD + 50BF demonstrates that bioflocs protein was efficiently used by tilapia juveniles. Those results are in accordance with Avnimelech (2007), who said that bioflocs biomass has a great potential to be used as a food source by tilapia. Additionally, there might be nutritional advantages to combine bioflocs biomass and artificial diets, because bioflocs could improve diet digestion and utilization by fish (Luo et al., 2017). Kuhn, Boardman, Lawrence, Marsh, and Flick Jr (2009) have speculated
that microbial flocs are probiotics. In that case, it would be better to produce living bioflocs than adding dried bioflocs biomass as a feed ingredient.
Although fish survival has not been significantly affected by the treatments, disregarding 100BF, as the level of substitution of commercial diets by wet bioflocs biomass increased, the final body weight, weekly weight gains and fish production values decreased (Table 4). All fish from 100BF died before the 5th rearing week. Comparisons between the
mixed treatments, i.e., those with both commercial diet and wet bioflocs biomass allowances, and their respective negative controls, i.e., 75CD, 50CD and 25CD, revealed that bioflocs brought benefits to fish growth. The fish submitted to feeding restriction exhibited better growth performance when the wet bioflocs biomass was allowed to them. Avnimelech (2007) has demonstrated that tilapia juveniles could efficiently use bioflocs biomass as food. Ju, Forster, Conquest, and Dominy (2008) have speculated that if the bioflocs protein levels were similar to those from artificial diets, they might sustain even higher growth performance of farmed fish.
Table 4. Growth performance of Nile tilapia juveniles (body weight = 1.77 ± 0.28 g) stocked for 8 weeks in 100-L polyethylene tanks. Fish was fed on different proportions of commercial diets (CD) and wet bioflocs biomass (BF). Mean ± S.D.; n = 5, 4 or 3 (please see Table 1).
Treatment² Variable¹
Survival FBw WGR FP 100CD 80 ± 29a³ 21.9 ± 6.4a 2.5 ± 0.8a 481.6±106a 75CD + 25BF 92 ± 17a
17.9 ± 3.1a
2.0 ± 0.4a
481.6±78a 50CD + 50BF 100 ± 0a 10.4 ± 2.5b 1.1 ± 0.3b 313.6±78b 25CD + 75BF 83 ± 19a 5.2 ± 1.0c 0.4 ± 0.1c 128.8±11c 100BF4
- b - - -
75CD 100 ± 0a
11.5 ± 0.3b
1.2 ± 0.1b
347.2±11b 50CD 100 ± 0a 5.2 ± 0.5c 0.4 ± 0.1c 156.8±16c 25CD 100 ± 0a 2.5 ± 0.6d 0.1 ± 0.1d 56±16d ANOVA P < 0.001 < 0.001 < 0.001 < 0.001
1
Survival (%), FBw: final body weight (g), WGR: weekly weight gain (g per week), FP: fish production (g m-3); 2100CD: 100% commercial diet. 100BF: 100% wet bioflocs
biomass. 75CD + 25BF: 75% commercial diet and 25% wet bioflocs biomass. 50CD+50BF: 50% commercial diet and 50% wet bioflocs biomass. 25CD+75BF: 25% commercial diet and 75% wet bioflocs biomass. 75CD: 75% of the amount delivered to 100CE. 50CD: 50% of the amount delivered to 100CD. 25CD: 25% of the amount delivered to 100CD; 3For each variable, means with different letters in a same column
are significantly different between themselves by the Tukey’s test (p < 0.05); 4There
was zero survival on 100BF treatment.
than at 50CD, which suggests the use of bioflocs protein for fish growth.
Figure 2. Food conversion ratio (FCR) and protein efficiency ratio (PER) of Nile tilapia juveniles stocked for 8 weeks in 100-L polyethylene tanks. FCR = dry food intake/body weight increase. PER = weight gain/protein intake. Fish was fed on different proportions of commercial diets (CD) and wet bioflocs biomass (BF). Mean ± S.D.; n = 5, 4 or 3 (please see Table 1). 100CD: 100% commercial diet. 100BF: 100% wet bioflocs biomass. 75CD + 25BF: 75% commercial diet and 25% wet bioflocs biomass. 50CD+50BF: 50% commercial diet and 50% wet bioflocs biomass. 25CD+75BF: 25% commercial diet and 75% wet bioflocs biomass. 75CD: 75% of the amount delivered to 100CE. 50CD: 50% of the amount delivered to 100CD. 25CD: 25% of the amount delivered to 100CD. FCR and PER means with distinct lower and upper-case letters, respectively, are significantly different between themselves by the Tukey’s test (p < 0.05).
Conclusion
The impairment on tilapia growth performance submitted to feeding restriction is lessened if wet bioflocs biomass is provided to the animals. The total substitution of artificial diets for wet bioflocs biomass in clear-water tanks is unfeasible, because it leads to heavy tilapia mortalities in a relatively short period.
References
Ahmad, I., Rani, A. M. B., Verma, A. K., & Maqsood, M. (2017). Biofloc technology: an emerging avenue in aquatic animal healthcare and nutrition. Aquaculture International, 25(3), 1215-1226. doi: 10.1007/s10499-016-0108-8 Anand, P. S. S., Kohli, M. P. S., Kumar, S., Sundaray, J.
K., Roy, S. D., Venkateshwarlu, G., ... Pailan, G. H. (2014). Effect of dietary supplementation of biofloc on growth performance and digestive enzyme activities in
Penaeus monodon. Aquaculture, 418, 108-115. doi: 10.1016/j.aquaculture.2013.09.051
Association of Official Analytical Chemist [AOAC]. (2005). Official Methods of Analysis (18th ed.). Gaitherburg, MD: AOAC International.
Avnimelech, Y. (1999). Carbon/nitrogen ratio as a control element in aquaculture systems. Aquaculture, 176(3), 227-235. doi: 10.1016/S0044-8486(99)00085-X
Avnimelech, Y. (2007). Feeding with microbial flocs by tilapia in minimal discharge bio-flocs technology ponds. Aquaculture, 264(1), 140-147. doi: 10.1016/j.aquaculture.2006.11.025
Ayres, M., Ayres Junior, M. A., Ayres, D. L., & Dos Santos, A. S. (1998). BioEstat: aplicações estatísticas nas áreas das ciências biológicas e médicas. Manaus, AM: Sociedade Civil Mamirauá.
Azim, M. E., & Little, D. C. (2008). The biofloc technology (BFT) in indoor tanks: water quality, biofloc composition, and growth and welfare of Nile tilapia (Oreochromis niloticus). Aquaculture, 283(1), 29-35. doi: 10.1016/j.aquaculture.2008.06.036
Azim, M. E., Little, D. C., & Bron, J. E. (2008). Microbial protein production in activated suspension tanks manipulating C: N ratio in feed and the implications for fish culture. Bioresource Technology, 99(9), 3590-3599. doi: 10.1016/j.biortech.2007.07.063
Boyd, C. E., Tucker, C. S., & Somridhivej, B. (2016). Alkalinity and hardness: critical but elusive concepts in aquaculture. Journal of the World Aquaculture Society, 47(1), 6-41. doi: 10.1111/jwas.12241
Caldini, N. N., Cavalcante, D. H., Rocha Filho, P. R. N., & Sá, M. V. C. (2015). Feeding Nile tilapia with artificial diets and dried bioflocs biomass. Acta Scientiarum. Animal Sciences, 37(4), 335-341. doi: 10.4025/actascianimsci.v37i4.27043
Cavalcante, D. H., Lima, F. R. S., & Rebouças, V. T. (2017). Integration between bioflocs and periphyton in Nile tilapia culture tanks. Acta Scientiarum: Technology, 39, 601-607. doi: 10.4025/actascitechnol.v39i5.30123 Crab, R., Avnimelech, Y., Defoirdt, T., Bossier, P., &
Verstraete, W. (2007). Nitrogen removal techniques in aquaculture for a sustainable production. Aquaculture, 270(1), 1-14. doi: 10.1016/j.aquaculture.2007.05.006 Crab, R., Defoirdt, T., Bossier, P., & Verstraete, W.
(2012). Biofloc technology in aquaculture: beneficial effects and future challenges. Aquaculture, 356, 351-356. doi: 10.1016/j.aquaculture.2012.04.046
Cyrino, J. E. P., Bicudo, Á. J. d. A., Sado, R. Y., Borghesi, R., & Dairik, J. K. (2010). A piscicultura e o ambiente: o uso de alimentos ambientalmente corretos em piscicultura. Revista Brasileira de Zootecnia, 39(Suppl.), 68-87. doi: 10.1590/S1516-35982010001300009 Dauda, A. B., Romano, N., Ebrahimi, M., Teh, J. C.,
Ajadi, A., Chong, C. M., ... Kamarudin, M. S. (2018). Influence of carbon/nitrogen ratios on biofloc production and biochemical composition and subsequent effects on the growth, physiological status and disease resistance of African catfish (Clarias gariepinus) cultured in glycerol-based biofloc systems.
Aquaculture, 483, 120-130. doi:
10.1016/j.aquaculture.2017.10.016
Ebeling, J. M., Timmons, M. B., & Bisogni, J. (2006). Engineering analysis of the stoichiometry of photoautotrophic, autotrophic, and heterotrophic removal of ammonia–nitrogen in aquaculture systems.
Aquaculture, 257(1), 346-358. doi:
Ekasari, J., Angela, D., Waluyo, S. H., Bachtiar, T., Surawidjaja, E. H., Bossier, P., & De Schryver, P. (2014). The size of biofloc determines the nutritional composition and the nitrogen recovery by aquaculture animals. Aquaculture, 426, 105-111. doi: 10.1016/j.aquaculture.2014.01.023
El-Shafai, S. A., El-Gohary, F. A., Nasr, F. A., van der Steen, N. P., & Gijzen, H. J. (2004). Chronic ammonia toxicity to duckweed-fed tilapia (Oreochromis
niloticus). Aquaculture, 232(1), 117-127. doi:
10.1016/S0044-8486(03)00516-7
Hargreaves, J. A. (2006). Photosynthetic suspended-growth systems in aquaculture. Aquacultural Engineering, 34(3), 344-363. doi: 10.1016/j.aquaeng.2005.08.009
Ju, Z., Forster, I., Conquest, L., & Dominy, W. (2008). Enhanced growth effects on shrimp (Litopenaeus
vannamei) from inclusion of whole shrimp floc or
floc fractions to a formulated diet. Aquaculture
Nutrition, 14(6), 533-543. doi:
10.1111/j.1365-2095.2007.00559.x
Kuhn, D. D., Boardman, G. D., Lawrence, A. L., Marsh, L., & Flick Jr, G. J. (2009). Microbial floc meal as a replacement ingredient for fish meal and soybean protein in shrimp feed. Aquaculture, 296(1-2), 51-57. doi: 10.1016/j.aquaculture.2009.07.025
Kuhn, D. D., Lawrence, A. L., Boardman, G. D., Patnaik, S., Marsh, L., & Flick, G. J. (2010). Evaluation of two types of bioflocs derived from biological treatment of fish effluent as feed ingredients for Pacific white shrimp, Litopenaeus vannamei. Aquaculture, 303(1), 28-33. doi: 10.1016/j.aquaculture.2010.03.001
Lin, Y.-C., & Chen, J.-C. (2003). Acute toxicity of nitrite on Litopenaeus vannamei (Boone) juveniles at different salinity levels. Aquaculture, 224(1-4), 193-201. doi: 10.1016/S0022-0981(01)00227-1
Long, L., Yang, J., Li, Y., Guan, C., & Wu, F. (2015). Effect of biofloc technology on growth, digestive enzyme activity, hematology, and immune response of genetically improved farmed tilapia (Oreochromis
niloticus). Aquaculture, 448, 135-141. doi:
10.1016/j.aquaculture.2015.05.017
Lovera-Zapata, K. P., Brito, L. O., Lima, P. C. M., Alejandro, L., Arana, V., Galvez, A. O., & Cárdenas, J. M. V. (2017). Cultivo de alevines de tilapiaen sistema biofloc bajo diferentes relaciones carbono/nitrógeno.
Boletim do Instituto de Pesca, 43(3), 399-407. doi: 10.20950/1678-2305.2017v43n3p399
Luo, G., Gao, Q., Wang, C., Liu, W., Sun, D., Li, L., & Tan, H. (2014). Growth, digestive activity, welfare, and partial cost-effectiveness of genetically improved farmed tilapia (Oreochromis niloticus) cultured in a recirculating aquaculture system and an indoor biofloc
system. Aquaculture, 422, 1-7. doi:
10.1016/j.aquaculture.2013.11.023
Luo, G., Zhang, N., Cai, S., Tan, H., & Liu, Z. (2017). Nitrogen dynamics, bacterial community composition and biofloc quality in biofloc-based systems cultured
Oreochromis niloticus with poly-β-hydroxybutyric and polycaprolactone as external carbohydrates.
Aquaculture, 479, 732-741. doi:
10.1016/j.aquaculture.2017.07.017
Michelato, M., Furuya, W. M., & Gatlin III, D. M. (2018). Metabolic responses of Nile tilapia Oreochromis niloticus
to methionine and taurine supplementation.
Aquaculture, 485, 66-72. doi:
10.1016/j.aquaculture.2017.11.003
Pinho, S. M., Molinari, D., Mello, G. L., Fitzsimmons, K. M., & Emerenciano, M. G. C. (2017). Effluent from a biofloc technology (BFT) tilapia culture on the aquaponics production of different lettuce varieties.
Ecological Engineering, 103, 146-153. doi:
10.1016/j.ecoleng.2017.03.009
Schneider, O., Sereti, V., Machiels, M. A. M., Eding, E. H., & Verreth, J. A. J. (2006). The potential of producing heterotrophic bacteria biomass on aquaculture waste. Water Research, 40(14), 2684-2694. doi: 10.1016/j.watres.2006.05.008
Schryver, P., Crab, R., Defoirdt, T., Boon, N., & Verstraete, W. (2008). The basics of bio-flocs technology: The added value for aquaculture.
Aquaculture, 277(3-4), 125-137. doi:
10.1016/j.aquaculture.2008.02.019
Vinatea, L., Malpartida, J., Carbó, R., Andree, K. B., Gisbert, E., & Estevez, A. (2018). A comparison of recirculation aquaculture systems versus biofloc technology culture system for on-growing of fry of
Tinca tinca (Cyprinidae) and fry of grey Mugil cephalus
(Mugilidae). Aquaculture, 482, 155-161. doi: 10.1016/j.aquaculture.2017.09.041
Wasielesky, W., Atwood, H., Stokes, A., & Browdy, C. L. (2006). Effect of natural production in a zero exchange suspended microbial floc based super-intensive culture system for white shrimp Litopenaeus vannamei.
Aquaculture, 258(1), 396-403. doi:
10.1016/j.aquaculture.2006.04.030
Widanarni, J., & Maryan, S. (2012). Evaluation of biofloc technology application on water quality and production performance of red tilapia Oreochromis sp. cultured at different stocking densities. Hayati journal of Biosciences, 19(2), 73-80. doi: 10.4308/hjb.19.2.73
Received on April 18, 2018. Accepted on June 11, 2018.