Acta Scientiarum
http://www.uem.br/acta ISSN printed: 1806-2636 ISSN on-line: 1807-8672
Doi: 10.4025/actascianimsci.v37i4.27043
Feeding Nile tilapia with artificial diets and dried bioflocs biomass
Nayara Nunes Caldini, Davi de Holanda Cavalcante, Pedro Roberto Nogueira Rocha Filho and Marcelo Vinícius do Carmo e Sá*
Laboratório de Ciência e Tecnologia Aquícola, Departamento de Engenharia de Pesca, Centro de Ciências Agrárias, Universidade Federal do Ceará, Av. Mister Hull, s/n, 60356-000, Fortaleza, Ceará, Brazil. *Author for correspondence. E-mail: marcelo.sa@ufc.br
ABSTRACT. The effects of supplying dried bioflocs biomass to Nile tilapia juveniles were investigated in the present work. Fish were stocked in experimental rearing tanks for eight weeks. Selected variables of water quality, growth performance and effluent quality were evaluated. Fish were given different combinations of artificial diets and biofloc biomass, in wet (in natura) or dry form. As the supply of artificial diet decreased, the allowance of biofloc biomass increased in the same proportion. Biofloc biomass was produced in two 500-L tanks that received daily applications of dry molasses to adjust the C: N ratio of the water to 15: 1. The concentration of nitrite in water was only reduced in the tanks receiving wet bioflocs. The fish growth performance was poorer in the tanks that received dried biofloc biomass than in the tanks with wet biofloc biomass. Given the lack of positive results, there is no justification to dry the biofloc biomass aiming at delivering it as a dry biomass to reared fish.
Keywords: aquaculture, Oreochromis, water quality.
Alimentação da tilápia do Nilo com dietas artificiais e biomassa seca de bioflocos
RESUMO. Os efeitos do fornecimento de biomassa seca de bioflocos bacterianos a juvenis de tilápia do Nilo foram avaliados no presente trabalho. Os peixes foram mantidos em tanques experimentais de criação por oito semanas, quando foram observadas variáveis selecionadas de qualidade de água, desempenho zootécnico e qualidade de efluentes. Os peixes foram alimentados com diferentes combinações de ração balanceada e biomassa de bioflocos, na forma úmida (in natura) ou seca. À medida que o aporte de ração aos tanques era menor, o fornecimento de biomassa de bioflocos era proporcionalmente maior. A biomassa de bioflocos foi produzida em dois tanques avulsos de 500 L, sendo feito o ajuste diário da relação C: N da água para 15: 1, pela aplicação de melaço em pó à água. A concentração de nitrito na água de cultivo somente foi reduzida nos tanques que receberam bioflocos úmidos. O desempenho zootécnico dos peixes nos tanques que receberam a suplementação de biomassa seca de bioflocos ficou abaixo do observado nos tanques com biomassa úmida. Pela ausência de resultados positivos, não há justificativa técnica para a secagem dos bioflocos com o objetivo de fornecer a biomassa seca aos peixes cultivados.
Palavras-chave: aquicultura, Oreochromis, qualidade de água.
Introduction
The bioflocs technology (BFT) in aquaculture has proven to be an important source of nutrition for the rearing animals, helping to maintain water quality and preventing diseases (Ballester et al., 2010). Previous studies have shown that the bioflocs produced within the system, or added to it, can accelerate the growth of the cultured organisms (Arnold, Coman, Jackson & Groves, 2009; Megahed, 2010; Xu & Pan, 2012). According to Xu and Pan (2012) the bioflocs are available 24 hours a day as a food source and can supply a significant part of the nutritional demand of farmed animals.
Fish and shrimp diets supplemented with bioflocs can improve growth (Anand et al., 2014). According to Jatobá et al. (2014), the concentration of protein of the artificial diet may be reduced if there is abundant
natural food in the farming system, such as the bioflocs. Therefore, the aquaculture feeding costs can be reduced by adoption of the BFT system, since the expenses with commercial diets account for more than 50% of the production operating costs (Chamberlain, Avnimelech, McIntosh & Velasco, 2001).
Despite its nutritional value, previous works showed a significant drop in fish growth performance when the artificial diets were in great proportion replaced with wet bioflocs (Jatobá et al., 2014; Luo et al., 2014; Xu, Pan, Zhao & Huang, 2012). According to Wasielesky, Atwoo, Stokes and Browdy (2006), a BFT system without a supply of artificial feed is inappropriate to sustain a regular fish and shrimp growth. For that, it is important to associate artificial diets with bioflocs. In this regard, an alternative not evaluated yet is the supply of dried biofloc biomass to reared fish.
This study aimed at determining the effects of the supply of dried bioflocs biomass to Nile tilapia juveniles maintained in experimental tanks on selected variables of water quality, growth performance and effluent quality.
Material and methods
Juveniles of Nile tilapia (Oreochromis niloticus; n = 1000), masculinized, weighing between 1 and 2 g, were obtained from the Bom Princípio Farm, located in Guaíba (Ceará State) and transported to the LCTA – Laboratório de Ciência e Tecnologia Aquícola, Departamento de Engenharia de Pesca, Centro de Ciências Agrárias, Universidade Federal do Ceará, Fortaleza, Ceará State, Brazil. In the laboratory, fish were initially stocked in one 1000-L polyethylene tank with constant artificial diet for lab acclimation for four days. The artificial diet was given four times a day (8, 11, 14 and 17 h). It was used a commercial powdered diet designed for omnivore tropical fish with 49.4% CP at 5% of the body weight per day.
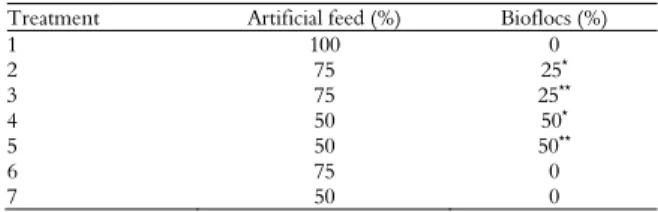
The study lasted eight weeks and used 30 circular 100-L polyethylene indoor tanks, which were located in the laboratory clear water room. The stocking density was set up at six fish per tank (initial body weight = 2.19 ± 0.05 g). Continuous mechanical aeration was provided to all tanks. No water exchange was performed throughout the experimental period, only replacement to maintain the initial water level. Fish were fed three times a day with the following diets: (1) a 51.6% CP powdered diet, (2) a 43.4% 1-mm extruded diet and a 35.9% CP 2-4 mm extruded diet, always at 8, 12 and 16 h. The experimental design consisted of seven treatments, formed by different combinations of artificial diet and bioflocs (Table 1).
In tanks of the treatment 1 (positive control), fish received only the commercial diets along the entire study (100% artificial feed). In tanks of the treatments 2 and 4, fish received both artificial feed and wet bioflocs biomass at different proportions. In these last tanks, the artificial diet allowances were reduced by 25% and 50%, respectively, compared to the treatment 1. The same was carried out in tanks of the treatments 3 and 5, except for
the use of dried bioflocs biomass. In tanks of the treatments 6 and 7, it was provided only artificial diet, at 75% and 50% respectively in relation to the treatment 1, but without any supplementation of biofloc biomass, either wet or dry (negative controls).
Table 1. Proportions of artificial feed and biofloc biomass supplied daily to fish.
Treatment Artificial feed (%) Bioflocs (%)
1 100 0
2 75 25*
3 75 25**
4 50 50*
5 50 50**
6 75 0
7 50 0
*Wet bioflocs; ** Dry bioflocs.
In this work, it was used two separate outdoor 500-L tanks for bioflocs production. The separate BFT tanks were provided with continuous aeration and intensive stirring of the water. Each separate BFT tank was stocked with 100 Nile tilapia juveniles with 30 ± 1.2 g. A 2,000 L h-1 pump was placed into each separate BFT tank to make a constant exchange of the two waters and obtain the same bioflocs quality in the two tanks. In the separate BFT tanks, fish fed a commercial 35.9% CP 2 – 4 mm diet for tropical omnivorous fish, supplied four times daily at 8, 11, 14 and 17 h, at 3% of the total biomass. The water C: N ratio of the separate BFT tanks was adjusted daily to 15: 1 with applications of dry molasses by using the Avnimelech (1999) formula. In those tanks, Imhoff cones were used to determine the concentration of settleable solids in water and the concentrations of dissolved oxygen were monitored three times a week.
Dryed bioflocs biomass for tilapia 337
The water quality of the tanks was monitored throughout the trial period. Twice a week, in the morning and afternoon, the water pH, temperature and electrical conductivity were read with the aid of a pH meter mPA210 (MS Tecnopon®), digital thermometer and CD-850 conductivity, respectively. Weekly, the concentrations of total ammonia nitrogen (TAN - indophenol method), nitrite (spectrophotometry at 543 nm) and dissolved oxygen (YSI 55 oximeter) were determined; the determinations of total alkalinity (titration with standard H2SO4 solution), total hardness (titration with standard EDTA solution) and reactive phosphorous (spectrophotometry at 690 nm) were carried out fortnightly. Additionally, measurements of free CO2 (titration with Na2CO3 solution) and total dissolved sulfides (titration with standard Na2S2O3 solution) were performed at the beginning, middle and end of the experiment. The concentrations of NH3 and H2S were then calculated using the results of TAN and total sulfides, according to El-Shafai, El-Gohary, Nasr, Van der Steen and Gijzen (2004). The determinations of water quality were carried out following the procedures described in the laboratory handbook, which is based on APHA (1999). After the final weighing of fish, all fish were removed from the tanks and the mechanical aerations turned off. Then, the water in the tanks was left to rest for five days. Next, samples of effluents were analyzed for DO2, TAN, nitrite, nitrate, and organic matter.
Fish growth performance was monitored through the following variables: survival, final body weight, specific growth rate (SGR = [(ln final body weight - ln initial body weight)/days of rearing] x 100), fish yield, feed conversion ratio (FCR = artificial diet allowed (g)/fish weight gain (g)) and protein efficiency ratio (PER = fish weight gain (g)/artificial crude protein allowed (g)). Fish weighings were carried out every other week to adjust the amount of artificial feed and bioflocs biomass provided to each tank.
Variables of water quality, growth performance and effluent quality were analyzed by one-way ANOVA for randomized block experiments. The Tukey’s test was used to compare means when there were significant differences between the treatments. The significance level adopted in all statistical tests was 5%. The statistical analyses were run using the softwares BioStat 5.0 and Excel 2013.
Results and discussion
Water quality
There were no significant differences between the treatments for pH, dissolved oxygen, total ammonia nitrogen (TAN), NH3, reactive phosphorus and organic matter (Table 2).
In general, the total alkalinity increased as the artificial feed was partially replaced with bioflocs biomass regardless its condition (dry or wet; p < 0.05). Fish feces decomposition (undigested food) as well as the non-consumed feed decay release free CO2 into the water that lowers the alkalinity (Ebeling, Timmons & Bisogn, 2006). Therefore, the more artificial feed is provided to fish the lower the total alkalinity. This result suggests that the effect of bioflocs biomass supply on the water alkalinity is the opposite of that observed for the artificial feed allowance. This is positive fact because a higher water alkalinity brings several benefits to fish culture, such as the increased water buffering effect (Furtado, Poersch & Wasielesky, 2011).
In intensive aquaculture systems, the accumulation of toxic substances in water, such as nitrite, is a major water quality problem (Cobo, Sonnenholzner, Wille & Sorgeloos, 2014). In this study, the concentration of nitrite in water was significantly higher in the tanks with the larger allowances of artificial feed (100R; Figure 1). The maximum nitrite concentration was observed at the fourth day of culture with a decrease thereafter until the end of the experiment. As the fish feces and the unconsumed feed decompose, ammonia is released to the water. Then, ammonia can be transformed into nitrite by nitrifying bacteria. Therefore, the higher the concentrations of protein-rich organic matter in the water the higher the concentrations of ammonia and, probably, nitrite (Campos et al., 2012). In bioflocs systems, Schryver and Verstraete (2009) observed a 98% efficiency in nitrite removal. Azim and Little (2008) found a nitrite reduction in BFT systems and a simultaneous 9 - 10% increase in tilapia growth when compared to the system without bioflocs. Therefore, the partial removal of artificial feed and its replacement with bioflocs, beside increase the hardness and the alkalinity of water, also reduces the concentrations of nitrite. The nitrite reduction, however, was only verified when the wet bioflocs biomass was used (25WBF+75R; 50R+50WBF). These results suggest that the use of wet bioflocs biomass is preferable to the use of dried bioflocs biomass because only living bacterial cells can remove nitrite from the water (Azim & Little, 2008).
Table 2. Water quality of indoor tanks stocked with Nile tilapia (2.18 ± 0.06 g). The juveniles fed different proportions of commercial fish feed and bioflocs biomass, wet and dry (mean ± S.D.; n = 5).
Variable¹ Treatment² ANOVA P
100R 75R+25WBF 75R+25DBF 50R+50WBF 50R+50DBF 75R 50R DO2 (mg L
-1) 7.78 ± 0.35 7.86 ± 0.59 7.72 ± 0.42 7.71 ± 0.27 7.65 ± 0.42 7.65 ± 0.55 7.81 ± 0.49 ns³
pH 7.97 ± 0.49 8.01 ± 0.26 7.98 ± 0.27 8.01 ± 0.19 8.02 ± 0.26 8.00 ± 0.31 8.01 ± 0.26 ns Tot alk (mg L-1) 76.1 ± 40 b4 84.4 ± 20 b 91.0 ± 19 a 103.5 ± 12 a 91.1 ± 18 a 79.5 ± 31 b 81.9 ± 21 b <0.003
Tot hard (mg L-1) 159.8 ± 29 cd 193.3 ± 45 b 161.0 ± 25 c 222.6 ± 65 a 167.7 ± 25 c 163.3 ± 27 c 150.8 ± 11 d <0.001
EC5
(μS cm-1
) 854 ± 117 c 899 ± 123 b 860 ± 126 c 933 ± 123 a 839 ± 101 c 831 ± 102 cd 821 ± 109 d <0.001 TAN (mg L-1) 2.83 ± 1.60 1.59 ± 1.51 2.34 ± 2.27 1.45 ± 1.36 1.80 ± 1.63 2.19 ± 1.68 1.87 ± 1.70 ns
NH3 (mg L-1) 0.14 ± 0.10 0.15 ± 0.11 0.20 ± 0.19 0.12 ± 0.09 0.14 ± 0.12 0.17 ± 0.13 0.18 ± 0.12 ns
P-react (mg L-1
) 2.63 ± 3.1 2.80 ± 2.9 2.74 ± 2.9 2.71 ± 2.8 2.95 ± 3.0 2.49 ± 2.7 2.79 ± 1.7 ns Org mat (mg L-1) 190 ± 23 198 ± 28 170 ± 22 210 ± 31 185 ± 31 191 ± 14 191 ± 29 ns
1 DO
2: dissolved oxygen; Tot alk: total alkalinity; Tot hard: total hardness; EC: Electrical conductivity; TAN: total ammonia nitrogen; P- reat: reactive phosphorus; Org mat: organic
matter; 2100R: 100% artificial diet; 75R+ 25WBF: 75% artificial diet + 25% wet bioflocs; 75R+25DBF: 75% artificial diet + 25% dried bioflocs; 50R+50WBF: 50% artificial diet +
50% wet bioflocs; 50R+50DBF: 50% artificial diet + 50% dried bioflocs; 75R: 75% of the amount supplied at 100R; 50R: 50% of the amount supplied at 100R. 3Non-significant
(ANOVA p > 0.05). 4
For each variable, distinct letters in the same row indicate significant differences between the means by Tukey’s test (p < 0.05).
Figure 1. Concentration of nitrite in tanks stocked with Nile tilapia juveniles over time. Fish were maintained for eight weeks in 100-L indoor tanks and fed different proportions of artificial feed and dried and wet bioflocs biomass, as a food supplement (mean ± S.D; n = 5). 100R: 100% artificial diet; 75R+ 25WBF: 75% artificial diet + 25% wet bioflocs; 75R+25DBF: 75% artificial diet + 25% dried bioflocs; 50R+50WBF: 50% artificial diet + 50% wet bioflocs; 50R+50DBF: 50% artificial diet + 50% dried bioflocs; 75R: 75% of the amount supplied at 100R; 50R: 50% of the amount supplied at 100R. Means followed by distinct letters represent treatments significantly different from each other by Tukey’s test (ANOVA p <0.05)
Growth Performance
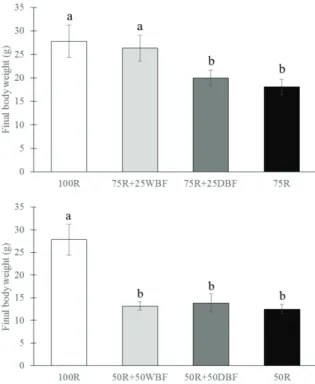
The bioflocs can be used as an important source of food for tilapia (Avnimelech, 2007). Furthermore, bioflocs enhance the digestion and utilization of artificial feeds, improving the growth performance of animals (Xu & Pan, 2012). In this study, there were no significant differences between the experimental
Figure 2. Concentrations of nitrate in tanks stocked with Nile tilapia juveniles over time. Fish were maintained for eight weeks in 100-L indoor tanks and fed different proportions of artificial feed and dried and wet bioflocs biomass, as a food supplement (mean ± S.D; n = 5). 100R: 100% artificial diet; 75R+ 25WBF: 75% artificial diet + 25% wet bioflocs; 75R+25DBF: 75% artificial diet + 25% dried bioflocs; 50R+50WBF: 50% artificial diet + 50% wet bioflocs; 50R+50DBF: 50% artificial diet + 50% dried bioflocs; 75R: 75% of the amount supplied at 100R; 50R: 50% of the amount supplied at 100R. Means followed by distinct letters represent treatments significantly different from each other by Tukey’s test (ANOVA p < 0.05).
Dryed bioflocs biomass for tilapia 339
treatments (Figure 3). These results demonstrate that the supply of wet bioflocs biomass support a higher body growth than the dried bioflocs biomass.
Figure 3. Final body weight of Nile tilapia juveniles after eight rearing weeks. Fish were maintained in 100-L indoor tanks and fed different proportions of artificial feed and dried and wet bioflocs biomass, as a food supplement (mean ± S.D; n = 5). 100R: 100% artificial diet; 75R+ 25WBF: 75% artificial diet + 25% wet bioflocs; 75R+25DBF: 75% artificial diet + 25% dried bioflocs; 50R+50WBF: 50% artificial diet + 50% wet bioflocs; 50R+50DBF: 50% artificial diet + 50% dried bioflocs; 75R: 75% of the amount supplied at 100R; 50R: 50% of the amount supplied at 100R. Columns with distinct letters represent significantly different means by Tukey’s test (P < 0.05)
Wet bioflocs, unlike the dried bioflocs, combine nutritional benefits with water quality improvement. According to Crab, Avnimelech, Defoirdt, Bossier and Verstraete (2007), the allowance of bioflocs in natura provides a more sustainable method to maintain the water quality, serving, additionally, as a protein food source. The in natura bioflocs are always available to the aquatic organims as a supplemental food supply (Avnimelech, 1999). They can be ingested and digested by the animals, replacing a significant fraction of the artificial feed (Anand et al., 2014; Crab, Chielen, Wille, Bossier & Verstraete, 2010; Xu & Pan, 2012). Contrarily, the dried bioflocs can be used only as a source of nutrients by fish (Ju, Forster, Conquest & Dominy, 2008). Therefore, there is no technical justification to dry the bioflocs biomass to supply to fish. It can be delivered in natura (wet biomass) to fish.
Fish final body weights in the 50R (50% of 100R), 50R+50WBF (50% artificial diet plus 50% wet bioflocs) and 50R+50DBF (50% artificial diet plus
50% dried bioflocs) tanks were lower than in the 100R tanks (Figure 3).
The best results for specific growth rate (SGR), weekly weight gain and fish yield were obtained for the 100R (100% artificial diet) and 75R+25WBF (75% artificial diet plus 25% of wet bioflocs) treatments. These two treatments did not significantly differ between each other for these variables (Table 2). The worst results for these variables were observed in the 50R+50WBF, 50R+50DBF and 50R tanks. The 75R+25DBF and 75R treatments did not differ between each other for SGR, weekly weight gain and fish yield (p > 0.05). These results indicate that, under the present study conditions, the maximum replacement level of artificial feed for wet bioflocs biomass is 25%. Besides, any level of replacement of artificial feed with dried bioflocs impairs the growth performance in tilapia. Therefore, the nutritional value of dried bioflocs biomass is probably much lower than that present in a complete artificial fish diet (Wasielesky et al., 2006).
The results of feed conversion ratio (FCR) were significantly inferior in the 50R, 50R+50WBF and 50R+50DBF tanks (Table 3). Results of FCR for 100R, 75R, 75R+25WBF and 75R+25DBF did not differ from each other (p < 0.05; Table 3).
Except by the 50R’s result, the best protein efficiency ratio (PER) was registered for the 75R+25WBF treatment that was not different from 75R+25DBF (p > 0.05; Table 3). The 100R’s PER result was significantly lower than for the 75R+25WBF and 75R+25DBF tanks. These results suggest that the protein of the artificial diet is better converted in fish growth when the wet bioflocs are present in the tanks. Bioflocs may increase the digestibility of protein of the artificial diet. According to Xu et al. (2012), bioflocs affect positively the digestive enzyme activity of the farmed aquatic organisms. Anand et al. (2014) concluded that the digestive activity of the animals was improved when the artificial diet was supplemented with bioflocs.
Effluent quality
Table 3. Performance of Nile tilapia juveniles (initial body weight = 2.18 ± 0.06 g) maintained for eight weeks in 100-L indoor tanks and fed different proportions of commercial feed and wet or dried bioflocs biomass (mean ± S.D.; n = 5).
Variable¹ Treatment² ANOVA P
100R 75R+25WBF 75R+25DBF 50R+50WBF 50R+50DBF 75R 50R SGR (% day-1) 4.38 ± 0.23 a³ 4.24 ± 0.16 a 3.91 ± 0.13 b 2.96 ± 0.14 c 3.08 ± 0.26 c 3.62 ± 0.11 b 2.97 ± 0.16 c <0.001
Weekly weight gain (g) 3.20 ± 0.43 a 2.89 ± 0.33 a 2.21 ± 0.18 b 1.30 ± 0.11 c 1.38 ± 0.28 c 2.01 ± 0.20 b 1.35 ± 0.12 c <0.001 Fish yield (g m-3 day-1) 22.4 ± 4.8 a 23.0 ± 2.4 a 16.8 ± 4.3 b 13.1 ± 1.6 c 12.8 ± 1.7 c 16.8 ± 0.6 b 11.2 ± 1.9 c <0.001
FCR 1.45 ± 0.5 b 1.25 ± 0.3 b 1.72 ± 0.6 b 2.44 ± 0.3 c 2.34 ± 0.6 c 1.30 ± 0.1 b 0.78 ± 0.1 a <0.001 PER 1.77 ± 0.2 b 3.15 ± 0.1 a 2.66 ± 0.3 a 0.93 ± 0.1 c 0.80 ± 0.2 c 1.85 ± 0.1 b 3.22 ± 0.5 a <0.001
1SGR: specific growth rate = [(ln final body weight - ln initial body weight)/ rearing days] x 100; FCR: feed conversion ratio = artificial diet allowed (g)/ fish weight gain (g); PER:
protein efficiency ratio = fish weight gain (g)/artificial protein allowance (g). 2
100R: 100% artificial diet; 75R+ 25WBF: 75% artificial diet + 25% wet bioflocs; 75R+25DBF: 75% artificial diet + 25% dried bioflocs; 50R+50WBF: 50% artificial diet + 50% wet bioflocs; 50R+50DBF: 50% artificial diet + 50% dried bioflocs; 75R: 75% of the amount supplied at 100R; 50R: 50% of the amount supplied at 100R. ³For each variable, distinct letters in the same row indicate significantly different means by Tukey’s test (p < 0.05).
Table 4. Quality of effluents from Nile tilapia tanks. Juveniles fed different proportions of commercial feed and wet or dried bioflocs biomass for eight rearing weeks (mean ± S.D.; n = 5).
Variable¹ Treatment² ANOVA P
100R 75R+25BFU 75R+25BFS 50R+50BFU 50R+50BFS 75R 50R DO2 (mg L
-1
) 2.05 ± 0.35 2.07 ± 0.20 2.34 ± 0.37 2.83 ± 0.16 2.28 ± 0.25 2.68 ± 0.58 2.73 ± 0.64 ns4
TAN (mg L-1) 1.26 ± 0.76 a³ 0.02 ± 0.01 b 0.12 ± 0.04 b 0.05 ± 0.04 b 0.16 ± 0.14 b 0.72 ± 0.52 a 0.19 ± 0.16 b <0.001
Nitrite (mg L-1) 0.19 ± 0.03 0.09 ± 0.03 0.09 ± 0.07 0.04 ± 0.03 0.06 ± 0.04 0.51 ± 0.39 0.21 ± 0.16 ns
Nitrate (mg L-1) 299 ± 80 350 ± 98 299 ± 53 357 ± 55 290 ± 47 293 ± 61 305 ± 16 ns
Mat org (mg L-1) 126 ± 20 122 ± 21 121 ± 22 127 ± 21 139 ± 30 134 ± 25 138 ± 29 ns
1DO2: dissolved oxygen; TAN: total ammonia nitrogen; Org mat: organic matter; 2100R: 100% artificial diet; 75R+ 25WBF: 75% artificial diet + 25% wet bioflocs; 75R+25DBF: 75%
artificial diet + 25% dried bioflocs; 50R+50WBF: 50% artificial diet + 50% wet bioflocs; 50R+50DBF: 50% artificial diet + 50% dried bioflocs; 75R: 75% of the amount supplied at 100R; 50R: 50% of the amount supplied at 100R. ³For each variable, distinct letters in the same row indicate significantly different means by Tukey’s test (p < 0.05); 4Non-significant
(ANOVA p > 0.05).
Conclusion
The results obtained in this study allowed us state that there is no technical justification for drying the bioflocs biomass in order to provide it for farmed fish. Better water quality and growth performance results are obtained when applying bioflocs biomass in the wet form (in natura) directly to fish tanks. However, the majority of the fish diet should consist of artificial diet for better productive results even when using the wet bioflocs biomass.
References
Anand, P. S. S., Kohli, M. P. S., Kumar, S., Sundaray, J. K., Roy, S. D., Venkateshwarlu, G., ... Pailan, G. H. (2014). Effect of dietary supplementation of biofloc on growth performance and digestive enzyme activities in Penaeus monodon. Aquaculture, 418-419, 108-115.
APHA. (1999). Standard methods for the examination of water and wastewater (Vol. 20). Maryland, Baltimore. American Public Health Association.
Arnold, S. J., Coman, F. E., Jackson, C. J., & Groves, S. A. (2009). High-intensity, zero water-exchange production of juvenile tiger shrimp, Penaeus monodon: an evaluation of artificial substrates and stocking density.
Aquaculture, 293(1), 42-48.
Avnimelech, Y. (1999). Carbon/nitrogen ratio as a control element in aquaculture systems. Aquaculture, 176(3), 227-235.
Avnimelech, Y. (2007). Feeding with microbial flocs by tilapia in minimal discharge bio-flocs technology ponds.
Aquaculture, 264(1), 140-147.
Azim, M. E., & Little, D. C. (2008). The biofloc technology (BFT) in indoor tanks: water quality, biofloc composition, and growth and welfare of Nile tilapia (Oreochromis niloticus). Aquaculture, 283(1), 29-35.
Ballester, E., Abreu, P., Cavalli, R., Emerenciano, M., Abreu, L., & Wasielesky Junior, W. (2010). Effect of practical diets with different protein levels on the performance of
Farfantepenaeus paulensis juveniles nursed in a zero exchange suspended microbial flocs intensive system.
Aquaculture Nutrition, 16(2), 163-172.
Campos, B. R., Miranda Filho, K. C., D'Incao, F., Poersch, L., & Wasielesky, W. (2012). Toxicidade aguda da amônia, nitrito e nitrato sobre juvenis de camarão-rosa
Farfantepenaeus brasiliensis (Latreille, 1817) (Crustacea: Decapoda). Atlântica, 34(1), 75-81.
Chamberlain, G., Avnimelech, Y., McIntosh, R., & Velasco, M. (2001). Advantages of aerated microbial reuse systems with balanced C/N. The Global Aquaculture Advocate, 4, 53-56. Cobo, M. L., Sonnenholzner, S., Wille, M., & Sorgeloos, P.
(2014). Ammonia tolerance of Litopenaeus vannamei
(Boone) larvae. Aquaculture Research, 45(3), 470-475. Crab, R., Avnimelech, Y., Defoirdt, T., Bossier, P., &
Verstraete, W. (2007). Nitrogen removal techniques in aquaculture for a sustainable production. Aquaculture, 270(1), 1-14.
Crab, R., Chielens, B., Wille, M., Bossier, P., & Verstraete, W. (2010). The effect of different carbon sources on the nutritional value of bioflocs, a feed for Macrobrachium rosenbergii postlarvae. Aquaculture Research, 41(4), 559-567. Ebeling, J. M., Timmons, M. B., & Bisogni, J. (2006).
Engineering analysis of the stoichiometry of photoautotrophic, autotrophic, and heterotrophic removal of ammonia–nitrogen in aquaculture systems.
Dryed bioflocs biomass for tilapia 341
El-Shafai, S. A., El-Gohary, F. A., Nasr, F. A., Van der Steen, N. P., & Gijzen, H. J. (2004). Chronic ammonia toxicity to duckweed-fed tilapia (Oreochromis niloticus). Aquaculture, 232(1), 117-127.
Furtado, P. S., Poersch, L. H., & Wasielesky, W. (2011). Effect of calcium hydroxide, carbonate and sodium bicarbonate on water quality and zootechnical performance of shrimp Litopenaeus vannamei reared in bio-flocs technology (BFT) systems. Aquaculture, 321(1), 130-135.
Hargreaves, J. A. (2006). Photosynthetic suspended-growth systems in aquaculture. Aquacultural Engineering, 34(3), 344-363.
Jatobá, A., Silva, B. C., Silva, J. S., Nascimento Vieira, F., Mouriño, J. L. P., Seiffert, W. Q., & Toledo, T. M. (2014). Protein levels for Litopenaeus vannamei in semi-intensive and biofloc systems. Aquaculture, 432, 365-371. Ju, Z., Forster, I., Conquest, L., & Dominy, W. (2008).
Enhanced growth effects on shrimp (Litopenaeus vannamei) from inclusion of whole shrimp floc or floc fractions to a formulated diet. Aquaculture Nutrition, 14(6), 533-543.
Luo, G., Gao, Q., Wang, C., Liu, W., Sun, D., Li, L., & Tan, H. (2014). Growth, digestive activity, welfare, and partial cost-effectiveness of genetically improved farmed tilapia (Oreochromis niloticus) cultured in a recirculating aquaculture system and an indoor biofloc system.
Aquaculture, 422-423, 1-7.
Megahed, M. E. (2010). The effect of microbial biofloc on water quality, survival and growth of the green tiger
shrimp (Penaeus semisulcatus) fed with different crude protein levels. Journal of the Arabian Aquaculture Society, 5(2), 119-142.
Schryver, P., & Verstraete, W. (2009). Nitrogen removal from aquaculture pond water by heterotrophic nitrogen assimilation in lab-scale sequencing batch reactors. Bioresource Technology, 100(3), 1162-1167. Wasielesky, W., Atwood, H., Stokes, A., & Browdy, C. L.
(2006). Effect of natural production in a zero exchange suspended microbial floc based super-intensive culture system for white shrimp Litopenaeus vannamei.
Aquaculture, 258(1), 396-403.
Xu, W.-J., & Pan, L.-Q. (2012). Effects of bioflocs on growth performance, digestive enzyme activity and body composition of juvenile Litopenaeus vannamei in zero-water exchange tanks manipulating C/N ratio in feed. Aquaculture, 356-357, 147-152.
Xu, W.-J., Pan, L.-Q., Zhao, D.-H., & Huang, J. (2012). Preliminary investigation into the contribution of bioflocs on protein nutrition of Litopenaeus vannamei fed with different dietary protein levels in zero-water exchange culture tanks. Aquaculture, 350-353, 147-153.
Received on March 18, 2015 Accepted on July 16, 2015.