1 INTRODUCTION
A major program of refurbishment of school build-ings is starting in Portugal. It is an exceptional op-portunity, not only to increase the energy efficiency of the buildings, but also to improve the indoor learning environment in terms of thermal comfort and indoor air quality. This intervention must be prepared carefully and the technical decisions must be scientifically supported to guarantee the sustain-ability of the exploration costs of the building, often neglected during the design process (Freitas, 2009).
To technically support the retrofit decisions the Laboratory of Building Physics (LFC) of Faculty of Engineering of University of Porto (FEUP) is con-ducting a research with two main purposes: (1) as-sess the indoor environmental quality conditions within classrooms of different school buildings by the measurement of temperature, relative humidity and carbon dioxide concentration, and from the re-sults understand the comfort conditions that should be used in the design process and check the viability of some of the solutions that are being used, mainly in terms of ventilation systems, regarding the eco-nomic reality of Portugal and the high maintenance costs associated with those systems; (2) the devel-opment of a methodology for optimization of con-structive solutions to use in the rehabilitation of school buildings, by means of multi-objective opti-mization with genetic algorithms. It is intended that
the constructive solutions should ensure adequate conditions of comfort, low energy costs and sustai-nability in the operating costs of the buildings.
The aim of this paper is to show the initial results of this research and to launch a preliminary discus-sion. Therefore, this paper presents the results of the first experimental campaign of measurements in classrooms and the first models for computer simu-lation of hygrothermal and energy performance of school buildings.
2 EXPERIMENTAL CAMPAIGN SETUP
A key component of this work is the on-site assess-ment of the comfort conditions, measured by the temperature and relative humidity, and the indoor air quality, measured by the carbon dioxide concentra-tion and the ventilaconcentra-tion rate, of classrooms under service conditions. A total of eight classrooms, two in each of the four school buildings studied, were monitored. Two of the schools were recently retrofit-ted and the other two maintain the original condi-tions. The experimental campaign took place during the winter of 2009.
The campaign included continuous measurements and spot measurements: continuous measures in-cluded the monitoring through one week of the tem-perature, relative humidity and carbon dioxide con-centration with equipment placed in the classrooms
Hygrothermal Performance of Portuguese Classrooms:
measurement and computer simulation
R. Almeida
Escola Superior de Tecnologia e Gestão de Viseu, Civil Engineering Department, Viseu, Portugal
V.P. de Freitas
University of Porto, Faculty of Engineering, Civil Engineering Department, Laboratory of Building Physics, Porto, Portugal
ABSTRACT: The rehabilitation of school buildings is an imperative in Portugal. The current buildings do not guarantee adequate conditions of habitability. So, a very ambitious public plan for rehabilitation of school buildings which involves substantial investments is being carried. It is essential to support this investment plan with a thorough investigation that could help and sustain the technical decisions to be taken. To that end a research project has started with two main objectives: to evaluate the suitability of the legal requirements currently in use in Portuguese codes regarding comfort conditions and ventilation rates through the measure-ment of temperature, relative humidity and carbon dioxide concentration in classrooms of different schools; and make an optimization of constructive solutions to be used in retrofitting of school buildings using com-puter simulations, artificial neural networks and genetic algorithms. This paper presents the initial results of this project, from the measured values starts a preliminary discussion and launches the future works of the re-search project.
and spot measures include the evaluation of the ven-tilation rates by means of the tracer gas method - de-cay technique, with different conditions of envelope (door open/closed and interior windows open/closed).
2.1 Retrofitted schools
Measurements were taken at two schools in the city of Porto, Portugal, in this paper designated as R1 and R2. In each of the schools two classrooms con-sidered representative of the environment within the school where chosen for the measurements. Both schools were recently retrofitted.
R1 school was built in the 80’s and underwent a rehabilitation process during the year of 2008. The classrooms are now prepared with heating equip-ment and hybrid ventilation. The ventilation consists of mechanical air extraction with natural supply inlets. The air admission is obtained from pressure-controlled ventilators that guarantee a constant flow and the mechanical air extraction has a maximum capacity of 400 m3/h. The occupants of the class-rooms have the possibility to operate both the heat-ing equipment and the mechanical air extraction.
The school building R2 date of 1930 and was re-trofitted during 2008. The classrooms were equipped with openings in the facades for air intake and me-chanical equipment for the extraction of air that al-low a maximum fal-low of 600 m3/h. Heating systems were built and the occupants have the possibility to regulate it.
2.2 Non-retrofitted schools
Two non-retrofitted schools were chosen to evaluate the indoor environmental quality, both in the city of Porto, designated in this paper as NR1 and NR2.
The school NR1 was built in 1997 while the NR2 in 1993. The schools were monitored for a week and have no heating system or air intake devices. The classrooms ventilation is achieved only by window opening.
2.3 Techniques and equipment
The continuum monitoring of temperature and rela-tive humidity was carried with data loggers
HOBO-H08-007-02 (±0,7ºC and ±5%, resolution of 0.4°C)
and the carbon dioxide concentration was measured with the TelAire 7001 associated to a data logger
HOBO-H08-007-02 (0 to 2500ppm, errors of
±50 ppm).
The determination of ventilation flows was per-formed using a tracer gas and the decay technique. For the typical situation inside a classroom (tempera-ture and wind steady - almost constant flow) and when the tracer gas concentration outside is null and there is no emission or absorption of gas inside, the
mass balance of the tracer gas can be expressed by the following differential equation:
( )
q c( )
t t t c V =− ⋅ ∂ ∂ ⋅ (1)where V = volume; t = time; c = concentration of the tracer gas; q = flow.
The solution for Equation 1 is:
( )
t V q e c t c = 0⋅ − ⋅ (2)where c0 = initial concentration of the tracer gas.
Rearranging this last equation, we can obtain:
( )
t t c c ACH V q = = 0 ln (3) where ACH = air changes per hour.Thus, for calculating the leakage flow or ventila-tion in spaces that can be considered as a single zone is necessary to introduce the tracer gas in the space until a uniform initial concentration, c0, is achieved.
Then record the evolution of concentration with time in a graph ln (c) versus time, which by Equation 3, is a straight line. The module of its slope, q/V is the unknown that allows the calculation of the air changes per hour, ACH. This test is regulated by ISO 12569 (2000) and ASTM E741-00 (2000).
To perform this measurements the Innova analyz-er refanalyz-erence 1312 was used. The tracanalyz-er gas was the sulfur hexafluoride (SF6) and the equipment record-ed its concentration during the test.
3 RESULTS
The continuous measurements of temperature, rela-tive humidity and carbon dioxide concentration be-gan on a saturday and held for a week.
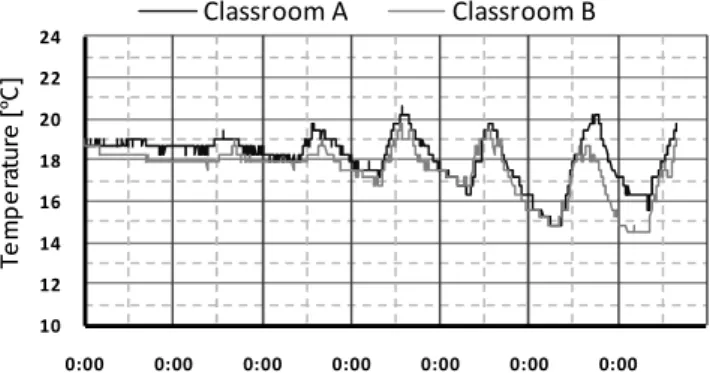
3.1 Temperature and relative humidity
The following Figures illustrate the results obtained for the temperature and relative humidity in the classrooms studied. Tables 1 and 2 summarize the results. 10 12 14 16 18 20 22 24 0:00 0:00 0:00 0:00 0:00 0:00 0:00 T e m p e ra tu re [ ºC ] Classroom A Classroom B
10 12 14 16 18 20 22 24 0:00 0:00 0:00 0:00 0:00 0:00 0:00 T e m p e ra tu re [ ºC ] Classroom A Classroom B
Figure 2. Temperature variation in school R2.
10 12 14 16 18 20 22 24 0:00 0:00 0:00 0:00 0:00 0:00 0:00 T e m p e ra tu re [ ºC ] Classroom A Classroom B
Figure 3. Temperature variation in school NR1.
10 12 14 16 18 20 22 24 0:00 0:00 0:00 0:00 0:00 0:00 0:00 T e m p e ra tu re [ ºC ] Classroom A Classroom B
Figure 4. Temperature variation in school NR2.
20 40 60 80 100 0:00 0:00 0:00 0:00 0:00 0:00 0:00 R e la ti ve H u m id it y [% ] Classroom A Classroom B
Figure 5. Relative humidity variation in school R1.
20 40 60 80 100 0:00 0:00 0:00 0:00 0:00 0:00 0:00 R e la ti ve H u m id it y [% ] Classroom A Classroom B
Figure 6. Relative humidity variation in school R2.
20 40 60 80 100 0:00 0:00 0:00 0:00 0:00 0:00 0:00 R e la ti ve H u m id it y [% ] Classroom A Classroom B
Figure 7. Relative humidity variation in school NR1.
20 40 60 80 100 0:00 0:00 0:00 0:00 0:00 0:00 0:00 R e la ti ve H u m id it y [% ] Classroom A Classroom B
Figure 8. Relative humidity variation in school NR2
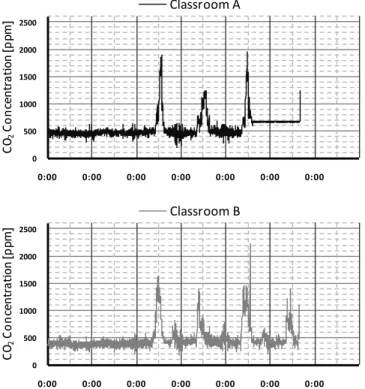
3.2 Carbon dioxide concentration
Figures 9 to 11 show the variation of the carbon dio-xide concentration in the classrooms studied during the measurement period. Table 3 summarizes the re-sults.
Table 1. Statistical analysis of temperature R1 R2 NR1 NR2 Classroom A Classroom B Classroom A Classroom B Classroom A Classroom B Classroom A Classroom B Tindoor Mean 18,5 17,9 21,3 21,6 16,3 15,3 14,7 14,2 Standard deviation 1,32 1,22 1,43 1,46 0,99 1,08 3,76 1,33 Maximum 20,6 19,8 23,6 24,0 17,9 17,5 21,0 17,1 Minimum 14,9 14,5 17,1 16,4 13,3 13,3 4,0 11,0 Toutdoor Mean 10,2 14,5 14,7 11,0 Standard deviation 2,24 1,35 3,76 2,69 Maximum 13,0 17,0 21,0 17,0 Minimum 4,0 11,0 4,0 4,0
Table 2. Statistical analysis of relative humidity
R1 R2 NR1 NR2 Classroom A Classroom B Classroom A Classroom B Classroom A Classroom B Classroom A Classroom B HRindoor Mean 46 51 46 47 56 55 57 61 Standard deviation 4,2 3,0 3,7 4,1 3,3 1,8 1,6 6,4 Maximum 55 67 55 59 74 69 67 84 Minimum 38 45 38 37 49 50 52 55 HRoutdoor Mean 78 82 69 81 Standard deviation 13,5 9,2 15,0 13,5 Maximum 100 100 100 100 Minimum 58 63 40 58 0 500 1000 1500 2000 2500 0:00 0:00 0:00 0:00 0:00 0:00 0:00 C O2 C o n ce n tr a ti o n [ p p m ] Classroom A 0 500 1000 1500 2000 2500 0:00 0:00 0:00 0:00 0:00 0:00 0:00 C O2 C o n ce n tr a ti o n [ p p m ] Classroom B
Figure 9. Carbon dioxide concentration variation in school R1.
0 500 1000 1500 2000 2500 0:00 0:00 0:00 0:00 0:00 0:00 0: 00 C O2 C o n cen tr a ti o n [ p p m ] Classroom A 0 500 1000 1500 2000 2500 0:00 0:00 0:00 0:00 0:00 0:00 0: 00 C O2 C o n cen tr a ti o n [ p p m ] Classroom B
Figure 10. Carbon dioxide concentration variation in school R2.
0 500 1000 1500 2000 2500 0:00 0:00 0:00 0:00 0:00 0:00 0:00 C O2 C o n ce n tr a ti o n [ p p m ] Classroom A 0 500 1000 1500 2000 2500 0:00 0:00 0:00 0:00 0:00 0:00 0:00 C O2 C o n ce n tr a ti o n [ p p m ] Classroom B
Figure 11. Carbon dioxide concentration variation in school NR1. 0 500 1000 1500 2000 2500 0:00 0:00 0:00 0:00 0:00 0:00 0:00 C O2 C o n ce n tr a ti o n [ p p m ] Classroom A 0 500 1000 1500 2000 2500 0:00 0:00 0:00 0:00 0:00 0:00 0:00 C O2 C o n ce n tr a ti o n [ p p m ] Classroom B
Figure 12. Carbon dioxide concentration variation in school NR2.
Table 3– Statistical analysis of carbon dioxide concentration
R1 R2 NR1 NR2 Classroom A Classroom B Classroom A Classroom B Classroom A Classroom B Classroom A Classroom B Mean 1113 1597 732 667 1890 1964 2083 1730 Standard deviation 512 607 286 313 614 717 568 861 Maximum* 2466 2500 1958 2231 2500 2500 2500 2500 Minimum 259 261 386 259 503 349 320 381
* data logger was limited to 2500 ppm.
3.3 Ventilation
The ventilation rates were determined using the tracer gas method – decay technique. Ventilation rates were measured in one classroom of R1 school and one classroom of NR1 school. In the classroom of school R1 two scenarios were measured: (a) me-chanical air extraction off and (b) meme-chanical air ex-traction on. In both scenarios door and windows were closed. In the classroom of school NR1 three scenarios were measured: (a) the door and interior windows closed; (b) the door open and interior win-dows closed; (c) door closed and interior window open. Figures 13 and 14 show the results from the decay of tracer gas in the classrooms of schools R1 and NR1 respectively. Table 4 summarizes the venti-lation rates measured.
y = -0,9064x + 4,6274 R² = 0,9447 L n ( c ) Time (a) y = -2,6693x + 4,7648 R² = 0,9783 L n ( c ) Time (b)
y = -0,073x + 3,2002 R² = 0,8626 L n ( c ) Time (a) y = -1,3428x + 3,7759 R² = 0,9636 L n ( c ) Time (b) y = -1,1018x + 4,4924 R² = 0,9576 L n ( c ) Time (c)
Figure 14. Tracer gas decay – school NR1.
Table 4 summarizes the results.
Table 4 – Ventilation rates
R1 NR1
(a) (b) (a) (b) (c)
Ventilation rate
(m3/h) 137 405 11 201 165
4 SIMULATION
The parameters and physical processes involved in the phenomena of heat, air and moisture transfer in buildings and, in many situations, the complicated geometry of the building, mean that more detailed analysis of the hygrothermal performance of build-ings must make use of modeling and computer simu-lations.
The use of simulation tools has increased signifi-cantly and is universally acknowledged its contribu-tion to finding solucontribu-tions that enhance energy effi-ciency in buildings, notably the choice of the ventilation system, constructive solutions to the building envelope, heating system, more efficient lighting equipment, solar protection systems...
Since the hygrothermal phenomena that occur in-side a building affect its ventilation system (such as
the buoyancy effects in naturally ventilated buildings where the ventilation flow rates depend on tempera-ture differences between indoor air and the exterior) and it has a strong impact on the energy performance of the building, it is clear that the best way to simu-late the performance of a building is using models that combine the phenomena of heat transfer pheno-mena associated with ventilation.
Given the objectives of this study, EnergyPlus (Crawley et al. 2001a, b) software was chosen for the simulation of the school buildings hygrothermal end energetic performance. The software
Design-Builder (2009) was used to create the models. 4.1 Models
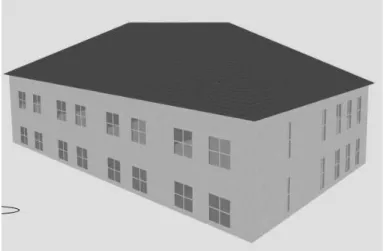
The two non-retrofitted schools, NR1 and NR2, were modeled with DesignBuilder (2009), Figures 15 and 16.
Figure 15. Simulation model of NR1 school.
Figure 16. Simulation model of NR2 school.
4.2 Models validation
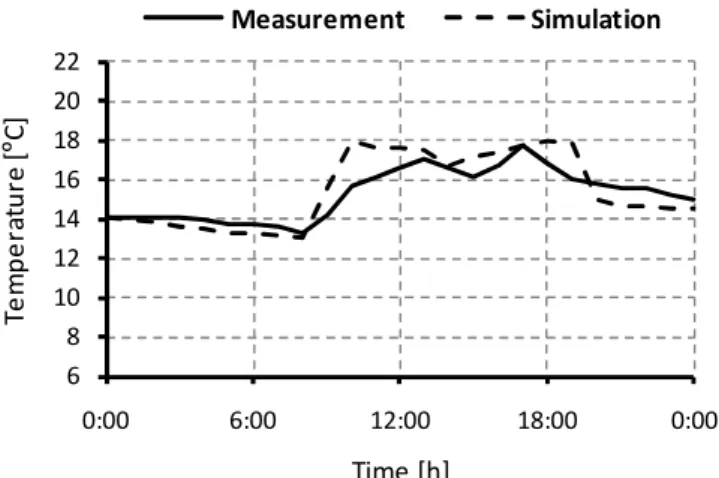
The simulation results were compared with the on-site measurements to allow a validation of the model used. The results obtained for the temperature on a typical day of occupation are shown in Figures 17 and 18, for school NR1 and NR2 respectively.
6 8 10 12 14 16 18 20 22 0:00 6:00 12:00 18:00 0:00 T e m p e ra tu re [º C ] Time [h] Measurement Simulation
Figure 17. Measurement and simulation in NR1 school.
6 8 10 12 14 16 18 20 22 0:00 6:00 12:00 18:00 0:00 T e m p e ra tu re [º C ] Time [h] Measurement Simulation
Figure 18. Measurement and simulation in NR2 school.
The differences found between the simulated and measured values can be mainly explained by two reasons: it was considered a daily profile of occu-pancy of the classrooms constant, different from the real situation where the number of students varies from class to class and the classroom does not hold the same occupation every day, and the climatic data used was not from the exact location of the school but from a meteorological station nearby.
5 DISCUSSION AND CONCLUSIONS
The rehabilitation of school buildings involves huge investments and, as such, the associated decisions should be taken carefully seeking the optimization of the available resources.
Since these buildings present unique characteris-tics in terms of occupancy rates and consequently high internal gains, concerns about comfort, indoor air quality and energy performance must be decisive when choosing the best constructive solutions and techniques, which must be economically sustainable throughout the life cycle of the building.
To help and support the necessary decisions the LFC of FEUP is undertaking a research project that, by means of measurement of temperature, relative
humidity and carbon dioxide concentration, intends to verify the suitability of the actual legislation in terms of hygrothermal conditions and ventilation rates. The Portuguese codes impose a maximum val-ue of 1000 ppm for carbon dioxide concentration in-side the classrooms which corresponds to a value be-tween 600 and 700 m3/h of fresh air (30 m3/h/person). These values make almost imposs-ible the use of natural ventilation. This way all schools that are being retrofitted are mechanically ventilated. The applied systems have high operation-al and maintenance costs which, in authors opinion, are quite inadequate for the typical school budgets.
From the results of the first measurement cam-paign can be concluded the following:
- non-retrofitted schools do not have suitable conditions of comfort and indoor air quality, thus it is imperative to improve it by means of retrofitting the building envelope;
- the reference design temperatures in the Portu-guese codes are 20ºC and 25ºC for winter and sum-mer season, respectively. The mean air temperature in schools NR1 and NR2 was significantly less than the 20ºC value of reference. These schools do not have heating systems and the walls, roofs and win-dows have a high U value which help to explain the results. The ventilation rates were very low and, con-sequently, the carbon dioxide concentration very high. So the indoor air quality must be improved with higher values of fresh air, even if this action in-volves an increase of the energy losses due to venti-lation;
- so in authors opinion these schools hygrother-mal performance must be increased to guarantee adequate comfort conditions by means of improving the thermal behavior of walls, roofs and windows and applying adequate heating systems with low maintenance costs; the indoor air quality must be as-sured with adequate ventilation systems, mainly nat-ural ventilation due to the costs associated with me-chanical systems;
- temperature and relative humidity in retrofitted schools are within the usually considered comfort conditions; this fact show that simple heating sys-tems and improving insulation of the building envelope can guarantee adequate indoor environ-mental quality;
- the carbon dioxide concentration in the retrofit-ted schools is higher than the maximum value of 1000 ppm but within the ranges considered enough in some European countries (mean values of 1100 to 1600 ppm in school R1 and 667 to 732 in school R2);
- the ventilation rates were lower than the legisla-tion values but during the measurement period the occupants of the classrooms in the retrofitted schools, although having that possibility, chose not to put in operation the mechanical exhaust ventila-tion, meaning that the values obtained for the carbon
dioxide concentration correspond to a situation of natural ventilation. It is imperative to question the need for so significant investments in the mechanical systems for ventilation.
6 FUTURE WORK
The research project also intends to seek optimized construction solutions to be used in the retrofit of school buildings. The search for the best construc-tive solutions is a multi objecconstruc-tive optimization prob-lem, since it seeks to ensure adequate conditions of comfort and indoor air quality, minimizing energy consumption and costs, both initial and operational throughout the life cycle of the building. The para-meters that will be optimized are the heat transfer coefficient of external walls, roof, and windows, the total solar energy transmittance of windows and the air change rate. The cost functions for optimization are related to heating energy consumption, indoor relative humidity and overheating discomfort in summer season.
The optimization of the design solutions will be achieved through the use of computational simula-tion of the energy and hygrothermal annual perfor-mance of the buildings. Since numerical simulation of buildings is a very time consuming procedure, and the goal is to perform a multi-objective optimization, it is virtually impossible to employ it directly for the optimization of the solutions. So, it will be used ar-tificial neural networks that, after being properly trained, allow estimating the results of the simula-tions on a simple and quick manner. The final opti-mization of the solutions will be achieved with ge-netic algorithms.
ACKNOWLEDGEMENT
The authors would like to thank the FCT – Fundação para a Ciência e Tecnologia for their support to this project.
REFERENCES
ASTM 2000. Standard Test Method for Determining Air Change in a Single Zone by Means of a Tracer Gas Dilu-tion, E 741-00, American Society for Testing Materials, West Conshohocken.
Crawley, D.B., Lawrie, L.K., Winkelmann, F.C. & Buhl, W.F. 2001, EnergyPlus: creating a new-generation building ener-gy simulation program, Enerener-gy Build 33: 319–331.
Crawley, D.B., Lawrie, L.K., Winkelmann, F.C. & Pedersen, C. 2001, Energyplus: new capabilities in a whole-building energy simulation program, In: The 7th international IBPSA conference, Rio de Janeiro.
DesignBuiler 2009. DesignBuilder Simulation + CFD Training Guide, DesignBuilder Software Ltd., UK.
Freitas, V.P. 2009. Reabilitação de edifícios escolares, Procce-dings of Patorreb 2009 – 3º Encontro sobre Patologia e Reabilitação de Edifícios, Porto.
ISO 2000. Thermal Performance of Buildings. Determination of Air Change in Buildings. Tracer Gas Dilution Method, ISO 12569, Genève.
![Figure 11. Carbon dioxide concentration variation in school NR1. 0 5001000150020002500 0:00 0:00 0:00 0:00 0:00 0:00 0:00CO2Concentration [ppm]Classroom A050010001500200025000:000:000:000:000:000:000:00CO2Concentration [ppm]Classroom B](https://thumb-eu.123doks.com/thumbv2/123dok_br/15794206.1078513/5.892.464.828.62.455/figure-carbon-concentration-variation-concentration-classroom-concentration-classroom.webp)