F
ACULDADE DEE
NGENHARIA DAU
NIVERSIDADE DOP
ORTOCharacterization of
Portuguese Web Searches
Rui Ribeiro
Master in Informatics and Computing Engineering Supervisor: Sérgio Nunes (PhD)
Characterization of
Portuguese Web Searches
Rui Ribeiro
Master in Informatics and Computing Engineering
Approved in oral examination by the committee:
Chair: João Pascoal Faria (PhD)
External Examiner: Daniel Coelho Gomes (PhD) Supervisor: Sérgio Sobral Nunes (PhD)
Abstract
Nowadays the Web can be seen as a worldwide library, being one of the main access points to information. The large amount of information available on websites all around the world raises the need for mechanisms capable of searching and retrieving relevant information for the user. Information retrieval systems arise in this context, as systems capable of searching large amounts of information and retrieving relevant information in the user’s perspective. On the Web, search engines are the main information retrieval sys-tems. The search engine returns a list of possible relevant websites for the user, according to his search, trying to fulfill his information need.
The need to know what users search for in a search engine led to the development of methodologies that can answer this problem and provide statistical data for analysis. Many search engines store the information about all queries made in files called trans-action logs. The information stored in these logs can vary, but most of them contain information about the user, query date and time and the content of the query itself. With the analysis of these logs, it is possible to get information about the number of queries made on the search engine, the mean terms per query, the mean session duration or the most common topics. This analysis is called Query Log Analysis. The results of this anal-ysis can be compared with similar studies, to study eventual changes in users’ behavior due to factors like: time, culture, language or others. This kind of analysis brings many advantages for the search engine themselves and its users; knowing what users search for, it is possible to improve the search engine’s features anticipating and predicting user’s behavior.
Analyzing a log from the Portuguese SAPO search engine covering a period of about six months in the year of 2010 some statistics were produced about user’s sessions, queries, terms and searched topics. The original log stored about 140 million queries and contained queries about human users and queries made by bots or other automatic pro-cesses. As this study should focus only on the analysis of human queries, these queries were removed. Around 30% of the original queries from the dataset were considered as bots and removed. Queries from the same user were delimited by sessions. Two queries from the same user belong to different sessions if they have an inactivity between them of at least 30 minutes. Sessions with more than 100 queries were considered to be made by bots and were removed. Having a majority of users from Portugal (90%) this study present a characterization of the Portuguese community and the similarities and differ-ences with other studies. Users made more queries on the beginning of the week, and on almost all weekends the daily query traffic is below average. The highest hourly traffic is seen between 2:00 p.m. and 5:00 p.m. where the hourly query frequency is 50% above average. Oddly the hourly distributions of human queries and queries made by bots are very similar. The results show that SAPO’s users make short duration sessions, with 1 or
2 queries writing between 1 and 3 terms per query. Around 65% of the sessions have a duration lower than 1 minute, and almost 88% last less than 15 minutes. The mean session duration is 5 minutes and 23 seconds. More than half of the sessions only had 1 query and almost 90% of the sessions (85.92%) had up to 5 queries. Only about 5% of the sessions had 10 or more queries. Too common words, function words, like adverbs, propositions or pronouns were removed as they have little lexical meaning and are not relevant for the analysis process. Around 90% of the queries have at most 3 terms and only 1% of the queries have 7 or more terms. The mean terms per query is 2.03. Few queries and terms are unique (19.59% and 3.03% respectively). Users rarely use advanced operators (only in 1.5% of the queries) and when modifying or refining a query the number of terms stays unchanged or 1 term is added/removed. Analyzing a random sample of 2,500 queries it was observed that the main topic of interest was Computers or Internet accounting for 26.88% of the analyzed queries. The second and third categories were People, Places or
Thingsand Commerce, Travel, Employment or Economy with 22.64% and 16.56%. These
three categories have a similar hourly distribution with the highest query traffic between 10:00 a.m. and 4:00 p.m. and a clear decreasing after 8:00 p.m.. In many categories there is a clear downward tendency as the weekend approaches with some exceptions like
Entertainment or Recreation which evidences an opossite tendency, rising until Friday
Resumo
Actualmente, a Web pode ser descrita como uma biblioteca a nível mundial, sendo um dos principais pontos de acesso a informação. A informação dispersa pelos sítios web de todo o mundo faz com que sejam necessários mecanismos capazes de procurar e de-volver a informação relevante para o utilizador. Neste âmbito, surgem os sistemas de recuperação de informação como sistemas capazes de pesquisar grandes quantidades de informação e devolver a informação relevante na perspectiva do utilizador. Na Web, os motores de pesquisa são os principais sistemas de recuperação de informação. Tendo por base a pesquisa feita pelo utilizador, o motor de pesquisa devolve uma lista de possíveis páginas relevantes para o utilizador, tentando desta forma satisfazer a sua necessidade de informação.
A necessidade de saber o que realmente pesquisam os utilizadores num motor de pesquisa e quais os seus comportamentos típicos fez com que se procurassem metodolo-gias que respondessem a estas questões e fornecessem dados estatísticos passíveis de serem analisados. Tipicamente, os motores de pesquisa recolhem informação acerca de todas as pesquisas que são efectuadas. A informação é guardada em ficheiros como regis-tos de transacções. Apesar do tipo de informação contida nestes regisregis-tos variar, a maioria contém informação acerca do utilizador, data e hora da pesquisa e o conteúdo da pesquisa propriamente dita. Efectuando a análise da informação contida nestes registos, é possível obter informação acerca do número de pesquisas efectuadas no motor de busca, o número médio de palavras por pesquisa, o tempo médio de uma sessão de pesquisa de um uti-lizador ou mesmo quais os tópicos das pesquisas mais comuns; esta análise é designada por Query Log Analysis. Os resultados obtidos podem ser comparados com outros estu-dos semelhantes de forma a estudar eventuais variações do comportamento do utilizador devido a factores temporais, culturais, linguísticos, entre outros. Este tipo de análise trás muitos benefícios para o próprio motor de pesquisa e para os seus utilizadores. Sabendo o que os utilizadores mais pesquisam poderemos melhorar as funcionalidades do motor de pesquisa antecipando e prevendo os seus comportamentos.
Analisando um registo das pesquisas efectuadas no motor de pesquisa SAPO, co-brindo um período de cerca de 6 meses do ano de 2010, foram produzidas dados estatís-ticos acerca das sessões dos utilizadores, das suas pesquisas, termos e principais tópicos de interesse. O registo original possuía cerca de 140 milhões de pesquisas, contendo quer pesquisas feitas por humanos como pesquisas feitas por bots ou outros processos automáticos. Visto que a análise principal deveria ser focada nas pesquisas feitas por utilizadores humanos estas pesquisas foram removidas. Cerca de 30% das pesquisas da coleccção original foram consideradas como sendo feitas por bots e foram removidas. As pesquisas feitas por um mesmo utilizador foram divididas por sessões. Duas pesquisas pertencem a sessões diferentes se tiverem um período de inactividade de pelo menos 30
minutos. Sessões com mais de 100 pesquisas foram consideradas como sendo feitas por
bots e foram também removidas. Visto que a maioria dos utilizadores era de Portugal
(90%) este estudo representa uma caracterização da comunidade portuguesa e mostrar as semelhanças e diferenças com outros estudos. Foram feitas mais pesquisas no início da semana e em quase todos os fins de semana a percentagem de pesquisas está abaixo da média. O período horário com maior percentagem de pesquisas situa-se entre as 14:00 e 17:00 onde a frequência de pesquisas por hora está 50% acima da média. Estranhamente esta distribuição horária é muito semelhante à das pesquisas feitas por bots. Os resultados mostram que os utilizadores do SAPO preferem sessões de curta duração, fazendo apenas 1 ou 2 pesquisas contendo entre 1 e 3 termos. Cerca de 65% das sessões têm uma duração inferior a 1 minuto e quase 88% uma duração inferior a 15 minutos. A duração média por sessão é de 5 minutos e 23 segundos. Mais de metade das sessões têm apenas 1 pesquisa e quase 90% das sessões (85,92%) no máximo 5 pesquisas. Apenas cerca de 5% das sessões têm 10 ou mais pesquisas. Palavras muito comuns e sem relevância semântica como advérbios, preposições ou pronomes foram removidas visto que têm pouco con-texto léxico e portanto não eram muito relevantes para o processo de análise. Cerca de 90% das pesquisas têm no máximo 3 termos e apenas 1% têm 7 ou mais termos. A mé-dia de termos por pesquisa é de 2,03. O número de pesquisas e termos únicos é baixo, 19,59% e 3,03% respectivamente. Os utilizadores do SAPO raramente usam operadores booleanos (apenas em 1,5% das pesquisas totais) e quando modificam uma pesquisa o número de termos existe uma alta probabilidade do número total de termos se manter igual ou de adicionar/remover 1 único termo. Pela análise de uma amostra aleatória de 2.500 pesquisas foi observado que o principal tópico de interesse era Computadores ou
Interneto qual foi verificado em 26,88% das pesquisas analisadas. O segundo e terceiro
tópico mais pesquisado foi Pessoas, Sítios ou Coisas e Comércio, Viagens, Emprego ou
Economiacom 22,64% e 16,56% respectivamente. As três categorias mais pesquisadas
têm uma distribuição horária semelhante registando a maior frequência de pesquisas en-tre as 10:00 e 16:00 com um acentuado decréscimo dessa frequência após as 20:00. Em muitas categorias existe uma clara tendência de descida do número de pesquisas à medida que o fim de semana se aproxima com algumas exepções como a categoria de
Enterteni-mento e Recreaçãoque evidencia uma tendência oposta, com uma subida do número de
pesquisas até a sexta-feira seguido de uma descida aos sábados e subindo de novo aos domingos.
Acknowledgements
My sincere thanks to Prof. Sérgio Nunes who not only served as my supervisor but also encouraged and challenged me throughout the thesis process. Special thanks to the SAPO company, in particular to their protocol with University of Porto, that provided the dataset and facilities to work on a daily basis. Deepest gratitude to all my friends and family for their support throughout these six months.
Contents
1 Introduction 1
1.1 Context and Main Goals . . . 2
1.2 Document Structure . . . 3
2 Query Log Analysis 5 2.1 Overview . . . 5
2.2 Limitations . . . 6
2.3 Privacy and Confidentiality Concerns . . . 7
2.4 Query Log Analysis Phases . . . 7
3 Characterization of Web Searches 11 4 Methodology 19 4.1 Overview . . . 19 4.2 SAPO’s Dataset . . . 20 4.3 Dataset Preparation . . . 21 5 Data Analysis 27 5.1 Overview . . . 27 5.2 Bots’ Analysis . . . 32
5.3 Session Level Analysis . . . 37
5.4 Query Level Analysis . . . 40
5.5 Term Level Analysis . . . 45
6 Conclusions 53 References 57 A Appendix 61 A.1 Bots’ Terms . . . 61
List of Figures
1.1 SAPO Search Engine. . . 3
2.1 Tumba!’s log entries format [CS10]. . . 8
3.1 Query Frequency along the day [PCT06]. . . 16
4.1 The new dataset structure. . . 23
4.2 Some lines of the sessions’ file. . . 24
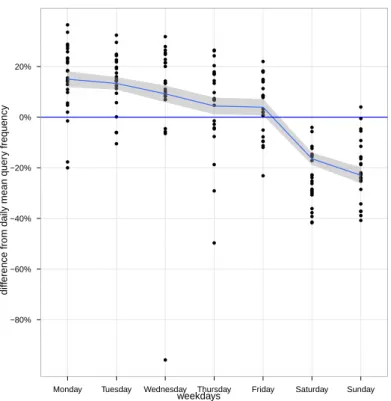
5.1 Difference from Daily Mean Query Frequency. . . 28
5.2 Difference from Weekday Mean Query Frequency. . . 29
5.3 Difference from Hourly Mean Query Frequency. . . 29
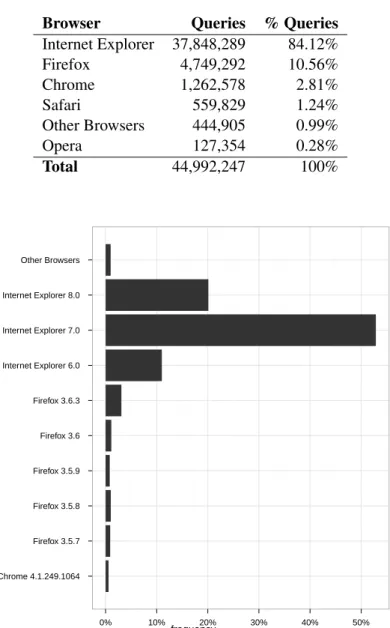
5.4 Most used Browsers and Versions. . . 30
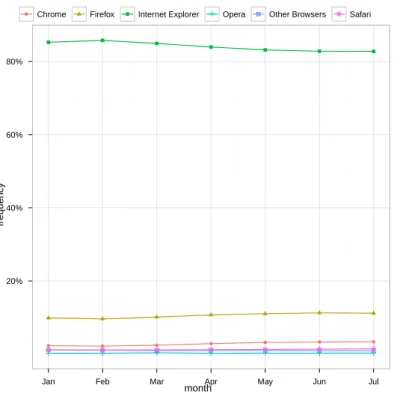
5.5 Cumulative Browser Usage Evolution. . . 31
5.6 Cumulative Daily Bots/Queries Frequency. . . 33
5.7 Cumulative Monthly Bots Frequency. . . 34
5.8 Distribution of Sessions with More than 100 Queries. . . 35
5.9 Difference from Hourly Mean Bots Query Frequency. . . 36
5.10 Difference from Weekday Mean Bots Query Frequency. . . 37
5.11 Sessions and Queries Distribution along months. . . 38
5.12 Distribution of Session Length vs Duration. . . 40
5.13 Cumulative Distribution of Queries. . . 42
5.14 Distribution of Characters per Term. . . 46
5.15 A cloud of the 250 most frequent terms. . . 47
5.16 Cumulative Distribution of Terms. . . 47
5.17 Topical Analysis Comparison Between Studies. . . 49
5.18 Hourly Query Traffic by Category. . . 52
List of Tables
3.1 Analysis Variables. . . 11
3.2 Web Search Engine Studies. . . 12
3.3 Data collected from Web search engine studies1. . . 13
3.4 Ranked Topic Classification. . . 16
4.1 Queries Removed in Sessions’ Creation. . . 25
5.1 General Statistics. . . 27
5.2 Most Used Browsers. . . 30
5.3 Top 10 Countries. . . 31
5.4 Top 10 Cities. . . 32
5.5 The 10 Most Frequent Automatic Processes. . . 35
5.6 The 10 Most Frequent Bots’ Queries. . . 36
5.7 Distribution of Sessions’ Duration (minutes). . . 39
5.8 Number of Queries per Session. . . 40
5.9 Distribution of Terms per Query (without function words). . . 42
5.10 Types of Queries Distribution. . . 43
5.11 Number of Terms Changed per Modified Query. . . 44
5.12 Correlation Between Advanced Operators. . . 44
5.13 Topic Categories Ranking. . . 49
5.14 The 20 most frequent terms and queries. . . 51
A.1 Strings used as Regular Expressions for the Removal of Bots. . . 61
Abbreviations
IR Information Retrieval
QLA Query Log Analysis
Chapter 1
Introduction
The Internet became one of the most useful ways to have access to information. In just a few seconds, it is possible to find what you are searching for, with a high degree of precision. The Internet can be seen as a container, and the Web is a part of it; while the Internet is as a big collection of computer networks, the World Wide Web (WWW) or the Web utilizes that structure to offer content, documents, multimedia, etc. The Web is used daily by many different users across the world, with different information needs. In 2010, almost 70% of the European Union’s population used the Internet, and also approximately
half of the Portuguese population [Gro10].
Taking into account the large amount of information available on the Web, it is im-perative that there are systems capable of retrieving the relevant information to fulfill the users’ information needs; those are called Information Retrieval (IR) systems.
“Information retrieval (IR) is finding material (usually documents) of an un-structured nature (usually text) that satisfies an information need from within
large collections (usually stored on computers).”[CDMS08]
The process of information seeking can be described as follows: a person is facing a problem that requires information for being solved. The representation of the problem in the mind of the user is called information need, and it is different from the problem because the user might not comprehend it, in the correct way; the representation of the information need in a natural language, is named request. The representation of the
infor-mation need in a “system” language is called query [Miz97]. In the Web context, the main
information retrieval systems are Web search engines (e.g. www.google.com); these are websites where the user searches for something, and a list of relevant websites containing information related with the user’s query, is presented.
To improve Web search engines, it is important to know what the users search for, in others words, what are their queries. To answer this problem, we need to know what
Introduction
the users searched for, with which topic was the query related, how much time did the user spent searching and other similar questions. Web Usage Mining techniques cover these problems by analyzing Web log data. Query Log Analysis (QLA) deals with the
study of query logs from data registered in a search engine [BYCBGC06]. Jansen [Jan06]
defined QLA as “the use of data collected in a transaction log to investigate particular research questions concerning interactions among Web users, the Web search engine, or the Web content during searching episodes”. In QLA, search engines’ transactional logs are analyzed. These logs store information about queries made on a search engine like the date and time of the query, the terms used or even the IP address of the user who made the query. QLA uses the data in transaction logs to recognize attributes of the search process such as the searcher’s actions on a system, the system responses or the evaluation
of results by the searcher [Jan06].
Using the statistic information retrieved from the QLA it is possible to increase the existing knowledge regarding how users use Web search engines enabling new features or improvements for the search engine itself. Furthermore, this information is really im-portant to understand the users’ behavior along the time.
1.1
Context and Main Goals
SAPO (Servidor de Apontadores Portugueses Online)1started in 1995 as a Web directory
to respond to Portuguese users’ information needs and evolved later into a search engine2
with an interface that can be seen on Figure1.1. SAPO was created by seven members of
the Computer Science Center of the University of Aveiro [Tel06].
The main goal of this project is to characterize the Portuguese Web searches analyzing SAPO search engine’s logs. These logs contain information regarding approximately 140 million records, from a recent period of time (January to July of 2010). Different people have different information needs, and search in different ways. With this analysis, it is possible to have a better understanding about the Portuguese Web searchers community and study their behavior. Having that information, it is possible to make a comparison with similar studies from different Web search engines. Furthermore, it provides solid knowledge for the SAPO search engine developers, giving them a tool to know their users’ behavior and present them with new features.
1The name corresponds to the Portuguese word for toad. 2Available at http://pesquisa.sapo.pt/
Introduction
Figure 1.1: SAPO Search Engine.
1.2
Document Structure
This document is organized as follows: in Chapter 2 the query log analysis and issues
surrounding this topic are explained. In this chapter, some limitations in query log anal-ysis are presented, mainly related with the queries’ information collection process. Next, privacy and confidentiality concerns are discussed and some techniques to reduce users’ real identity exposure risk are presented, as well as their advantages and disadvantages. In the final sub-chapter an overview of each one of the main QLA phases is made: collec-tion, preparation and analysis, describing what is performed in each of these phases. In the analysis phase, automatic methods that can help in the analysis phase are discussed.
In Chapter3some related studies are presented. In this chapter it is presented an
analy-sis of six studies and some conclusions are drawn from the comparison of the results of
these studies. Chapter4 describes how the work was done, namely the tools used, how
the dataset was organized and all the steps before the analysis process. In Chapter5the
results of this study are presented. The results are showed for the three main levels of analysis (Session, Query and Term and a brief analysis of queries made by bots is also
Chapter 2
Query Log Analysis
2.1
Overview
With the expansion of the Internet, and as more and more people use it, the need to know what and how a person searches, or use some service, is really important. One of the ways to get this information is by analyzing the transaction log files of information retrieval systems. A transaction log file, can be viewed as a file that has recorded the
interactions between a user (searching for information) and an IR system [Pet93]. It can
also be viewed as a method for automatically capture the type, content and time of the
interactions made by a person with a IR system [RB83]. In the Web context, a transaction
log is “an electronic record of interactions that have occurred during a searching episode between a Web search engine and users searching for information on that Web search
engine”[Jan06].
Search logs capture a large amount of interactions between users and search engines, and are less susceptible to bias, much because they capture the normal user behavior. Unlike qualitative methods (e.g. observations), there isn’t anyone observing the user
in-teracting with the search engine [CS10].
The analysis of these logs is named Transaction Log Analysis (TLA). TLA can be viewed as “the study of electronically recorded interactions between on-line informa-tion retrieval systems and the persons who search for informainforma-tion found in those
sys-tems” [Pet93]. Also it is the detailed and systematic examination of each search
com-mand or query by a user and the following database result or output [BBD+98]. One
of the sub-categorizations of TLA is Query Log Analysis (also known as Search Log
Analysis), meaning the analysis of search engine logs [JST08].
With QLA, it is possible to gain a clearer understanding of the interactions between searcher, content and systems. This opens a way to achieve some stated objective, such as improved system design, advanced searching assistance, or identified user information-searching behavior. Using this methodology, it is possible to examine search episodes in
Query Log Analysis
order to isolate trends and typical interactions between searchers and the system [Jan06].
This is, already, an important research area which directly impacts pay-per-click
mar-keting, Web-site-optimization strategies, and Web and Intranet search engine design [JS06].
Despite of collecting large quantity of clickstream data, few companies use this
informa-tion effectively [SDP06].
2.2
Limitations
Query logs capture explicit description of users’ information needs. These logs, capture the interactions that follow a user’s query and derivate traces that further characterize the
user and its interests [MT07]. Many researches criticized TLA as a research
methodol-ogy. They state that transaction logs do not record the users’ perceptions of the search, and therefore cannot measure the underlying information need of the searchers of the
searchers or the satisfaction with the obtained results [Jan06]. Kurth comments [Kur93]
that transaction logs can only deal with the actions the user takes, not their perceptions, emotions or background skills. Transaction logs are mainly a server-side data collection, therefore some users’ interactions are masked from these logging mechanisms (e.g. click
on back or print button) [Jan06]. Limitations and faults were also pointed to measures and
metrics used in QLA. People can be logged on to the Web but not using it; it is difficult to associate an IP to an individual (many people could use the same IP address); the fact
that a page was downloaded does not mean that anyone actually wanted it [NHLW99].
Some applications were developed to remedy the server-side data collection
limita-tions. Velayathan and Yamada presented their work [VY07] in which connections
be-tween user interest and user behavior were explored and offered an alternative method
for evaluating Web pages by incorporating client side logs. Kelly [Kel04] used a
soft-ware package that tracks a person’s computer activities. Jansen developed an application
[Jan06] to be used with transaction logs and other IR studies. This application simply
logs interaction with the IR system, along with other applications, using Dynamic Data Exchange (DDE), and outputting the data to a text file. This application can log a wide range of user interactions, including interactions with the browser toolbar, the system clipboard, scrolling results, among others.
Many of these client-side applications have obvious improvements over the typical server-side methods; despite these improvements, they come with some disadvantages (e.g. privacy concerns) that can discourage their use.
Query Log Analysis
2.3
Privacy and Confidentiality Concerns
Query log analysis poses an obvious tradeoff: the various advantages of log analysis bring at the same time privacy concerns namely in the aspects of users’ confidentiality; a proper balance between these two factors must be achieved. One of the biggest challenges of QLA is sharing information without compromising user privacy. When it is possible to associate the searcher with a real identity, log analysis assaults one of the most basic
principles, a person’s privacy. Cases like the AOL scandal [Tim06], raised new questions
about if log data can be anonymized and shared; thus, nowadays public logs are scarce and outdated.
Certain approaches try to resolve these problems, but some of them have impact in the
usefulness of the data. Eytan Adar [Ada07], stated that queries that are highly specific to
an individual are of seldom occurrence; a possible solution would be to store queries only from a minimum number of occurrences, hence reducing the risk of exposure at the cost of
raising the difficulty in identifying new queries. Murray and Teevan [MT07], showed that
the meaning of privacy is misleading, mostly because our understanding of privacy has shifted. Different nations have very different notions about what protections an individual
deserves. The browser plug-in TrackMeNot1 has a way to protect user’s privacy. This
software sends large quantities of pseudo-random queries from a user’s browser to mask that user’s real query.
The technology alone cannot solve the problems associated with privacy and most of
the techniques presented have side effects on the usefulness of the data [MT07].
2.4
Query Log Analysis Phases
Despite the fact that the decisions made in a QLA process may vary, there are some
common steps. Jansen, enumerated three major steps in a TLA [Jan06]:
• Collection: the process of collecting the interaction data for a given period in a transaction log;
• Preparation: the process of cleaning and preparing the transaction log data for analysis;
• Analysis: the process of analyzing the prepared data.
For a Web search engine, the main goal of this process is to collect data about the transactions made between the users and the search engine. The type of information to be collected must be defined so that proper analysis of that information can be done later.
Query Log Analysis
2.4.1 Collection
One of the earlier decisions that researches should do is to decide what type of content to collect from a given interaction of a searcher with the search engine. This decision de-pends on various aspects, like what needs to be investigated, what resources are available,
what is the frequency of data collection, and so on [JST08]. The taxonomy of user-system
interactions has many states like view results of the search made, selection of some page
link, execute by searching for some query and others [JM05]. The decisions made in this
phase are very important because the collection of the right data will allow researchers to make deductions regarding searchers behaviors.
The use of transactional logs is a good way for collecting data in a unobtrusive way, in other words the normal behavior of the searcher is not changed; furthermore this method does not interfere with the information retrieving process. Most of the transaction logs are primarily a server-side data collection, with known limitations (discussed in
Chap-ter2.2). Despite different transaction logs record different types of data, there is common
information in all of them. The majority of transaction logs include information about: • User Identification: the IP address of the searcher computer;
• Date/Time: the date and time of the interaction with the search engine; • Search Query: the query terms entered by the user.
Other common fields recorded are information about Language and Page Viewed
[Jan06]. Figure 2.1 shows the log format used in Tumba!’s study. This log follows the
Apache Common Log Format [Fou].
Figure 2.1: Tumba!’s log entries format [CS10].
2.4.2 Preparation
Before the collected data can be analyzed it is necessary to clean the information con-tained in the log, because not all of the information is relevant and some can be misleading for the analysis process. In this phase we should remove abnormal data that introduces bias to the results of the study. This information can be of two levels: query level and session level.
In terms of queries, information about incomplete queries and empty queries should
be removed. Also, because there are queries made by non-human (e.g. Web crawlers2)
Query Log Analysis
a maximum number of queries per session should be defined. Some studies used 100
queries as this value [CS10, JSP05, JS05]. This number is almost 50 times greater than
the reported mean search session [JSS00], and provides a good threshold to remove some
non-human searches. Still, distinguishing between human and non-human searchers can
not be done accurately [JS05].
Most of the studies use a gap to delimit the sessions. This means that if a user inserts a new query within the defined gap, the query is part of the same session; otherwise the new query is part of a new session. The value for this gap differs between studies, and it is
possible to find studies that use values from 5 minutes [SMHM99] to 30 minutes [CS10].
The preparation phase has an important role to make the information on the log more relevant and accurate.
2.4.3 Analysis
The core of the QLA process is obviously the analysis phase. At this stage, the data in the log is analyzed with the main purpose of providing results for some metrics and compare them with similar studies. This process is, in many studies, done by using text-processing scripts or relational databases, given that the logs are usually stored in ASCII text files. There are few studies that actually give a precise guide on how to do these
analysis; Jansen presented a stepwise methodology [Jan06], using relational databases, to
conduct log analyzes. This analysis can bring improvements for search engines in terms
of performance [BYGJ+08] or even design [Hea09]. With QLA it is possible to know
the searchers’ behavior, so the indexing methods can be improved and new features be provided by the search engine.
In a way to standardize QLA studies, Jansen provided a common language [JP01],
which defined metrics and levels of analysis. The analysis should focus on three lev-els: the session, the query and the term. The session represents the entire sequence of queries, entered by the same user within a limited duration, to address one or more
in-formation needs [JS06]. At session level it is common to make analysis of the session’s
duration and number of queries per searcher. Session’s duration is the total time between the user’s first query until the time he leaves the search engine. A query is composed by a string of zero or more characters inserted into the search engine. The first query made by a particular searcher is named initial query; a subsequent query made by the same searcher, and identical to his previous queries is referred as a repeated query. A subsequent query by the same searcher that is different than any of the searcher’s previ-ous queries is a modified query. The number of unique queries is the amount of distinct queries in the dataset regardless the number of time they were logged. At query level, it is interesting to determine query length, the use of complex operators or query frequency. A term is defined as a string of characters separated by some delimiter such as a space,
Query Log Analysis
a colon, or a period. The researcher should decide what delimiter to use. The analysis
at this level provides results for term frequency or topical analysis [JP01]. Some studies
also provide information about clicks, being possible to have statistical information about
the search engine results pages seen by users and frequency data about clicks [CS10].
To overcome certain limitations of typical QLA methods, automatic topic discovery methods should help researchers when used in conjunction with search engines’ logs. Gravano et al. proposed a categorization scheme for queries based on their geographical
locality [GHL03]. By defining queries as global, their best matches are broad, global
pages, not localized pages with a limited geographical scope; queries defined as local often include a location name or implicitly request “localized” results (e.g. the query “houses for sale”). For example, a Web page with general information about wildflowers could be considered as a global page, likely to be of interest to a geographically broad audience; in contrast, a Web page with information about houses for sale in a specific city could be seen as a local page, likely to be of interest only to a an audience in a relatively narrow region. Depending on the query character of local or global, this query is best answered by Web pages of the same geographical type. Automatic methods are very in-teresting from the point of view of discovering and categorizing topics. The information in the logs provides implicit feedback that is very valuable; the terms in queries can be used to describe the topic that users were trying to find. For example, if many users reach a document using certain keywords, then it is very likely that the information in this
doc-ument can be summarized by those words. Having this in mind, Poblete et al. [PBY08]
created a method based on frequent query patterns that shows clear results of
improve-ment in the quality of results given by the IR system. Beitzel and Lewis [BJF+05] showed
an approach for mining vast amounts of unlabeled data in search logs. Combining man-ual matching and supervised learning allowed to classify a larger proportion of queries than other techniques. The idea of supervised learning consists of training a classifier on the manual classifications to enable the classification of new queries in the respective categories.
Automatic topic detection methods could provide a great help categorizing users’ queries; the large amount of data in search logs, demands the use of such automatic meth-ods.
Chapter 3
Characterization of Web Searches
There are many studies about log analysis of Web search engines. In all of them, the analysis is made at different levels and the results are compared with other similar
stud-ies. Table3.1 summarizes the most common variables of analysis in these three levels.
Researchers tend to analyze the logs at the three main levels: query, session and term.
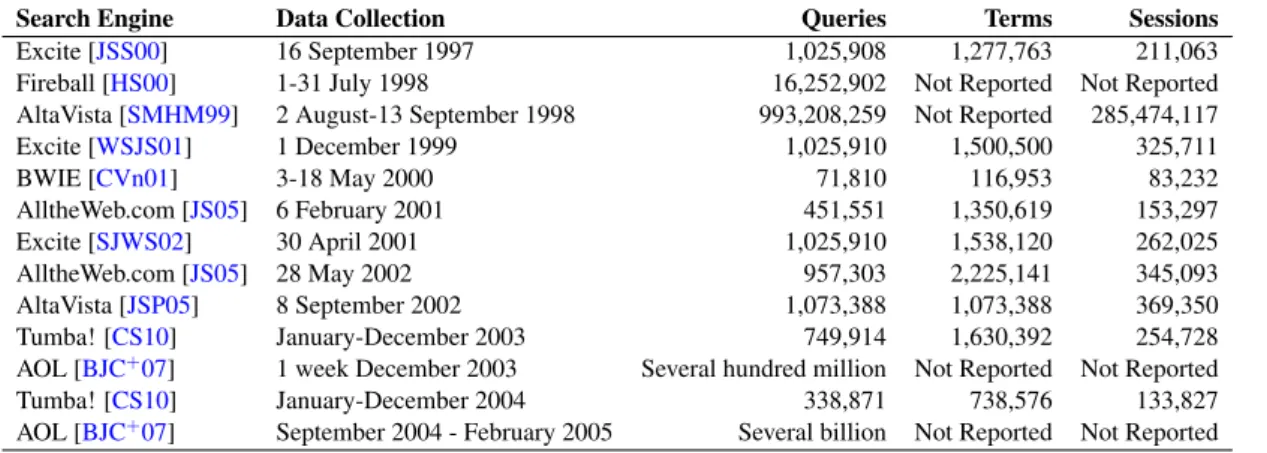
Table3.2summarizes the information gathered in some of these studies.
Table 3.1: Analysis Variables.
Query Level Session Level Term Level
Number of Queries Number of Sessions Number of Terms
Unique Queries Queries per Session Unique Terms
Initial Queries Session Duration Characters per Term
Subsequent Queries Term Frequency Distribution
Modified Topical Analysis
Identical New
Terms Swapped Advanced Queries Terms per Query
Query Frequency Distribution
To present the results and conclusions of the studies made in this area, some of them where selected as a way of comparison. The information was collected from different
studies: (1) a 1998 study of the AltaVista Web search engine [SMHM99], (2) a 1999
study of the Excite Web search engine [WSJS01], (3) a 2001 study of the AlltheWeb.com
Web search engine [JS05], (4) a 2002 study of Altavista Web search engine [JSP05], (5)
and (6) 2003 and 2004 studies of Tumba! Web search engine [CS10]. Following Jansen
and Spink’s view [JS06], we can group the studies from the geographical perspective
Characterization of Web Searches
Table 3.2: Web Search Engine Studies.
Search Engine Data Collection Queries Terms Sessions
Excite [JSS00] 16 September 1997 1,025,908 1,277,763 211,063
Fireball [HS00] 1-31 July 1998 16,252,902 Not Reported Not Reported
AltaVista [SMHM99] 2 August-13 September 1998 993,208,259 Not Reported 285,474,117
Excite [WSJS01] 1 December 1999 1,025,910 1,500,500 325,711 BWIE [CVn01] 3-18 May 2000 71,810 116,953 83,232 AlltheWeb.com [JS05] 6 February 2001 451,551 1,350,619 153,297 Excite [SJWS02] 30 April 2001 1,025,910 1,538,120 262,025 AlltheWeb.com [JS05] 28 May 2002 957,303 2,225,141 345,093 AltaVista [JSP05] 8 September 2002 1,073,388 1,073,388 369,350 Tumba! [CS10] January-December 2003 749,914 1,630,392 254,728
AOL [BJC+07] 1 week December 2003 Several hundred million Not Reported Not Reported
Tumba! [CS10] January-December 2004 338,871 738,576 133,827
AOL [BJC+07] September 2004 - February 2005 Several billion Not Reported Not Reported
AlltheWeb.com and Tumba! search engines complete the European side; from the US side the remaining search engines: Excite and AltaVista. AlltheWeb.com study was considered
at the time of the study a major and predominantly European Web search engine [JS05].
With this grouping it is possible to make deductions about the behaviors of users from different regions of the world.
The time range of these studies is from 1998 to 2004, which is a wide range to ob-serve changes in the users’ behavior; studies from the same search engine in different time periods make a greater contribution to this aspect. The results presented in each one of the studies, shows a big fluctuation in their values; as a better way of comparison be-tween them, percentages are used. Following the common analysis levels of most studies
[JSP05, JS05, JS06, CS10, WSJS01], Table 3.3 summarizes the results gathered. In the
preparation phase, researches have to make some decisions in order to prepare the log for the analysis. Transaction logs contain searches from both human users and agents
[JSP05]. Attempting to consider only the human users’ searches, in most studies is used a
cutoff value, defining the maximum number of queries per session that a human searcher may have done. This value is 100 in all of the presented studies (not reported on the Ex-cite’s study). Another decision that must also be done is about the session delimitation, defining what time interval should be used to say that two information needs of the same user belong to a different session, trying not to skew the results with ambiguous session
times [CS10]. Most of the studies presented do not use this delimitation, they just
mea-sure the time from the first submitted query until the user left the search engine; this can possibly lead to abnormal session times: the mean duration on the 2002 study of AltaVista (no. 4) was 58 minutes and 10 seconds, but with a standard deviation of about 3 hours, also the 2001 study of AlltheWeb.com (no. 3) had a mean session duration of 2 hours and 22 minutes but with a standard deviation of almost 5 hours.
Characterization
of
W
eb
Searches
Table 3.3: Data collected from Web search engine studies1.
Study no. 1 [SMHM99] 2 [WSJS01] 3 [JS05] 4 [JSP05] 5 [CS10] 6 [CS10]
AltaVista Excite AlltheWeb.com AltaVista Tumba! Tumba!
Data Collection August 2 to September 13 ,1998 December 1 ,1999 February 6, 2001 8 September, 2002 January to December ,2003 January to December ,2004
Sessions 285,474,117 325,711 153,297 369,350 254,728 133,827
Queries 993,208,159 1,025,910 451,551 1,073,388 749,914 333,871
Boolean Queries 20.4% 8% 1% 20.0% 12.79% 11.40%
Terms NR 1,500,500 1,350,619 1,073,388 1,630,392 738,576
Unique NR 61.6% 13% 9.5% 8.00% 10.33%
Queries Per Session Cutoff 100 NR 100 100 100 100
Session Delimitation 5m NR None None 30m 30m
Mean Terms Per Query 2.35 2.4 2.4 2.92 2.17 2.21
Terms Per Query
1 Term 25.8% 29.8% 25% 20.4% 39.30% 39.98%
2 Terms 26.0% 33.8% 36% 30.8% 29.00% 26.87%
3+ Terms 27.6% 36.4% 39% 48.5% 31.70% 33.15%
Mean Queries Per Session 2.02 1.9 3.0 2.91 2.94 2.49
Session Length
1 Query 77.6% 60.4% 53% 47.6% 40.73% 49.52%
2 Queries 13.5% 19.8% 18% 20.4% 22.10% 21.10%
3+ Queries 6.9% 19.8% 29% 32.0% 37.13% 29.38%
Mean Session Duration NR NR 2h22min 58m10s 6m31s 5m
Session Duration
< 5min NR NR 26.2% 71.6% 69.07% 74.98%
5-10min NR NR 6.2% 6.1% 10.69% 8.91%
> 10min NR NR 67.6% 22.3% 20.24% 16.11%
Mean Pages Viewed Per Query 1.39 1.6 2.2 NR 1.45 1.42
Result Pages Viewed
1 Page 85.2% 42.7% 83% 72.8% 68.11% 76.66%
2 Pages 7.5% 21.2% 10% 13.0% 16.76% 14.38%
3+ Pages 7.3% 36.1% 7% 14.1% 15.13% 8.96%
1NR- Not Reported in the analyzed study
Characterization of Web Searches
At session level, the results are balanced across studies. The number of mean queries per session fluctuates between the minimum and maximum values of 1.9 and 3.0 queries (Excite and AlltheWeb.com studies). There is a notable percentage of users that only did one query per session, but no remarkable changes in this values along the years and across studies. The use of 5 minutes cutoff in the 1998 study of AltaVista probably over
estimates the number of sessions with only one query (77.6%) [JS06]. The mean session
duration has a great variation between studies: the 2001 study of AlltheWeb.com and 2002 of AltaVista show high values (2h22m and 58m10s) unlike Tumba!’s 2003 and 2004 studies (6m31s and 5m). Only Tumba!’s studies used a session duration cutoff value, so it is possible that other studies have some long sessions that do not represent the reality and affect this value, also denoted by their high standard deviation values. The values presented also show that session durations tend to be short. In Tumba!’s studies, around 80% of the sessions lasted less than 10 minutes and only less than 1% lasted over than
one hour [CS10]. The 2002 study of AltaVista also showed that 81% of the sessions took
less than 15 minutes, and nearly 72% fewer than 5 minutes [JSP05]. The results from
AlltheWeb.com could be skewed by long sessions, although 52% of the sessions were
less than 15 minutes [JS05]. In the studies presented there seems to be a tendency for
short duration sessions.
At query level, there are also no significant changes between the studies. The number of mean terms per query is very similar between studies, having the minimum of 2.17 in 2003 study of Tumba! and the maximum value of 2.92 in the 2002 study of AltaVista. These results show that users tend to submit short queries, but there is a tendency for the query’s length to slowly increase. The wide time range of the two AltaVista studies show that there was a notable increase in queries with 3 or more terms and a decrease of 1 term queries. The two year study of Tumba!’s search engine does not have so sig-nificant changes, showing short increases of 1 term queries and on queries with more than 3 terms. The percentage of users modifying queries increased significantly in the
AltaVista search engine’s studies from 20.4% in 1998 to 52.4% in 2002 [JSP05]. In the
Excite study, this value was 39.6%. In 2003 Tumba!’s study 32.80% of the subsequent
queries were modified and 33.48% in 2004 [CS10]. The use of boolean operators in
queries (like “+” or “-”) varies greatly between studies. Although the use of this operators seems to be fairly low, there are significant changes between the US search engines and the European ones. With the exception of the Excite search engine, US search engines have higher percentage values of boolean queries. In AltaVista’s studies, the percentage of boolean queries held stable between 1998 and 2002 at around 20%. European users seem to be less familiar with the use of advanced operators, as shown by Tumba! and
AlltheWeb.com’s studies. These findings are consistent with other studies [JS05, JS06].
When modifying a query, Portuguese users tend to add a term [CS10], unlike other
Characterization of Web Searches
query [JSS00,SMHM99,WSJS01].
In terms of result pages seen by users, it is clear that the users rarely go beyond the second page. The value of mean pages viewed per query has a minimum of 1.6 and a
maximum of 2.2 among the studies. Jansen and Spink [JS06] stated that the tendency
is to view fewer pages over time; this affirmation is consistent with the results showed. With the exception of the Excite study, every other study shows a percentage of users seeing only the first page greater than 65%. Excite users seem to be more persistent, with an abnormal percentage of 36.1% seeing 3 or more result pages; although other Excite studies (1998 and 2001) show that there was also a tendency for users to view fewer page
results [JS06]. Again in the session cutoff in the 1998 study of AltaVista could skew the
results and increase the percentage of users seeing only one page. US users seem to see fewer result pages than the European ones.
In term analysis and topic classification there are some differences between studies. Excite’s study shows an abnormal percentage of unique terms, 61.6%, unlike the other studies where the maximum percentage verified was 12.79% in the 2003 study of the Tumba! search engine. This value is unusual, but normal for the Excite search engine, as
Spink et al. [SJWS02] showed in a comparison of Excite logs from different time periods;
the logs contained large amounts of terms that either are never repeated or used with low frequency like personal names, spelling errors, non-English terms and Web-specific terms such as URLs. In Tumba!’s study, Costa and Silva stated that caching only 1%
of the most frequent terms it would be possible to handle 50% of the queries [CS10].
To evaluate the main topics of interest, in most studies a random sample of queries is selected for analysis; queries are then classified under eleven general categories defined
by Spink et al. [SJWS02]. Selecting three studies, Table3.4shows the five most frequent
topic categories for each of them. The topics Commerce, Travel, Employment or Economy and People, Places or Things occupy the first two places in later studies. These findings match other studies stating that there is a decrease in topics like Computers, Internet or
Technology Itemsand Sex or Pornography opposing to an increase in topics like People,
Places or Thingsand Commerce, Travel, Employment or Economy that account for about
50% of the queries [JS05, SJWS02, JS06]. In a study comparing data collected from
Excite’s search engine from 1997, 1999 and 2001, Spink et al. detected a shift in search topics. Categories like Entertainment or Recreation and Health or Sciences moved down the ranking. Commerce, Travel, Employment or Economy and People, Places or Things moved up. In 1997, about one in six queries was about sex; by 2001 this was down to one
in twelve [SJWS02].
There are other studies in this field with interesting results and conclusions that are
worth mentioning. Pass et al. [PCT06], presented a paper based on pictures, as shown in
Figure3.1, showing information collected from AOL’s search engine, and giving
Characterization of Web Searches
Table 3.4: Ranked Topic Classification.
Excite 1997 (2,414 queries) % Queries
Entertainment or Recreation 19.9%
Sex, Pornography or Preferences 16.8%
Commerce, Travel, Employment or Economy 13.3% Computers or Internet or Technology items 12.5%
Health or Sciences 9.5%
AltaVista 2002 (2,603 queries) % Queries
People, Places or Things 49.27%
Commerce, Travel, Employment or Economy 12.52% Computers or Internet or Technology items 12.40%
Health or Sciences 7.49%
Education or Humanities 5.07%
Tumba! 2004 (1,000 queries) % Queries
Commerce, Travel, Employment or Economy 20.30%
People, Places or Things 17.70%
Health or Sciences 11.80%
Education or Humanities 10.50%
Society, Culture, Ethnicity or Religion 6.10%
space and user demographics. The query topics are diverse with queries about entertain-ment, shopping and porn occupying the first three places. Queries about personal finance are mostly done between 8h00 and 12h00; queries about music are mostly done between 1h00 and 4h00. In the universe of all queries, 28% are reformulations of a previous query.
Figure 3.1: Query Frequency along the day [PCT06].
Beitzel et al. [BJC+07] analyzed two query logs from America Online’s (AOL) search
engine. While the first contained all queries from an entire week (several hundred million) the second one contained the entire query stream from AOL’s Web search service over a continuous 6-month period from September 2004 through February 2005 (several billion queries). In this analysis, the authors found certain trends that are stable over time despite a continuous fluctuation in query volume. Certain topical categories can exhibit both short-term (over hours in a day) and long-term (over several weeks or months) query
Characterization of Web Searches
trends, and these trends and their behavior may vary wildly depending on the category and the length of time being studied. For instance, queries about a popular actor can have a stable query frequency along the time and have a peek at a certain date, if there is some action that triggers his popularity.
In an interesting study [HS00], Hölscher and Strube, showed that there are significant
differences between expert and novice users when using a search engine. Performing in-terviews was possible to distinguish participants between novice users and expert users. Novices tend to reformulate more often their queries and they often make small and in-effective changes to their queries. Domain knowledge is also very important as searchers with background knowledge about the domain spend less time reading information about it and are more aware of what to search next. Experts tend to use longer queries, use more often boolean operators, and commit less formatting errors on their queries .
Teevan et al. [TRM11] compared Twitter searches with Web search engines. People
search Twitter to find temporally relevant information (e.g. breaking news, real-time con-tent and popular trends) and information related to people. Microblogging concon-tent has very different properties than content on the Web. Tweets are short, frequent, and do not change after being posted. Twitter search is used to monitor content, while Web search is used to develop and learn about a topic. Twitter search includes more social content and events information, while Web results contain more basic facts and navigational content. Search engines could use social information finding behavior to improve search experi-ence. An hashtag method as the one used in Twitter is suggested to be adapted to Web search results. Using content analyses of the tweets that match a query might help to disambiguate the most common query intents; pages that match popular query specific Twitter topics, could be ranked higher.
Chapter 4
Methodology
4.1
Overview
At the beginning of this project the main metrics and analysis dimensions were already defined. Nevertheless, some metrics used in other works could not be used because of the lack of information in the dataset (e.g. no information about query results’ clicks). Frequently in exploratory works like this researchers discover new details about the stored information and consequently new forms of data analysis. This fact was important to decide how to do the analysis. The two possibilities considered were: use a database/data Warehouse and conduct the analysis from there or use ad hoc data analysis from the UNIX command line and a scripting language. The second option was used. The preparation work for conducting the analysis from a database/data warehouse would be much bigger. Using the UNIX command line and a scripting language there wouldn’t be this initial overhead and data inconsistencies would be much more easier to solve.
The dataset contained was stored in 165 compressed text files. These files have really good compression ratios which allow them to have relatively small sizes; extracting these files would consume large disk space. To avoid doing this, using the zcat command the files’ content is written on standard output and available for processing. Another UNIX facility very used was pipes. Pipes allow to redirect the output of a program to another one or to a file, which is perfect to chain a set of processes. As in other data mining projects, most of the work is based on regular expressions i.e., matching strings of text, allowing to retrieve certain parts of the dataset relevant for the analysis; from the earlier stages to the end of the project regular expressions were used on a daily basis. Perl was the scripting language chosen mainly for its efficiency and flexibility when dealing with regular expressions. The main UNIX commands used were:
• awk - Used for simple data manipulation (e.g. switch the order of two columns) and calculations;
Methodology
• sort - Used to sort certain fields (e.g. sort by IP address); • uniq - Used to retrieve only unique results;
• cut - Used to retrieve specific parts of a line bounded by a delimiter.
Along the analysis process dozens of commands were executed more than one time. Since inserting all these commands manually was impracticable, these were distributed across some bash scripts that will run them and store their output whenever needed.
An-other programming language used was R1, that offers many features for statistical
com-puting and graphics. To draw graphics it was used an R package, ggplot22.
The analysis focused on three main levels: sessions, queries and terms. These were also the main levels of analysis used on other studies, so a direct comparison of the results
is possible. The most common metrics used in similar studies (explained at section2.4.3)
were used at each one of these levels. Unfortunately the dataset doesn’t have information about query results’ clicks therefore an analysis at this level was not possible.
4.2
SAPO’s Dataset
The dataset provided has information recorded about queries made on SAPO’s search engine, covering a period of about six months in the year of 2010 (January, 29 to July, 12). This information was stored in 165 compressed files with a total size of 7.6 Gigabytes. In each one of these files the information about queries is stored in a kind of markup structure (like XML). Each record (query) is bounded by an empty line, so that it is possible to distinguish between different records. Not all these fields are important to the analysis process so such fields can be discarded. The fields used in the analysis process and their explanation are the following:
• ip stores the IP address of the user who made the query; the fields country and city are, respectively, the country and city registered for this IP address;
• date is a field with 14 numerical digits representing the date when the query was done in the format “YearMonthDayHourMinutesSeconds”;
• browser is the user-agent string that identifies the application used by the searcher to interact with the search engine;
• keywords shows the query terms entered by the searcher.
Although the same structure is used for all queries, most tags don’t always have con-tent, and they are represented by empty tags (e.g. <browser \>). It is imperative to know
1Available at http://www.r-project.org/ 2Available at http://had.co.nz/ggplot2/
Methodology
which fields always have content (especially those needed in the analysis process) and to avoid problems in future stages if all are always present, with or without content. From the verifications done it is possible to conclude that all these fields are always stored. Only two fields always have content, date and ip; the remaining fields when there is no content the empty-tag is always present.
The original dataset has about 140 million queries. As the next chapters will show the final number of queries will be much more diminished because the original dataset has a large number of non-human queries (bots).
4.3
Dataset Preparation
When doing analysis of textual content, especially when using regular expressions, we must be certain about how the information is organized. When dealing with regular ex-pressions one must be sure about the text pattern so that the regular expression can match it for all situations. For this reason an early task was to check if the information stored obeyed to the specified structure and find possible cases that could bring problems in the future. This was an ungrateful task as much of the problems were not found at this initial stage but over the course of the project, leading to redo and rethink a lot of work.
One of the problems found at this early stage was related to the last stored query in each one of the 165 files. For unknown reasons (related with the dataset collection process), in all of them the information about the last query was always incomplete. As all the files were read sequentially, and because these last queries stored incorrectly don’t have a line break to signal the end of the line, their information would be connected to the first query of the next file. As this could introduce incorrect results these last queries were discarded; one piece of text bounded by an empty line, was only accepted as a query if it was found the opening and closing of the notification tag. Sometimes the field that stores the query terms, keywords, had the line break character leading to the occurrence of empty lines inside a query record. This event was solved by defining that when an opening of the keywords tag is found, that specific line must end with the closure of that tag; if this was not true the line-break of that line was removed. All leading and trailing white-spaces in every line were also removed.
These procedures were applied on the bots’ elimination phase, explained next, where a new file with a structure identical to the original dataset is created eliminating all these problems.
4.3.1 Bots Elimination
The original dataset was not object of any kind of cleaning, meaning that it was possible to encounter many queries made by software applications (bots). As this study is only
Methodology
concerned in analyzing queries made by human users, queries made by bots should be part of this analysis. Remove all the queries made by bots with 100% certainty, is a difficult task that surpasses the main goals of this work. Using the field browser and matching its content with some known user-agent strings of bots, would be possible to remove many unwanted queries. When this field has no content (empty tag) it would be impossible to tell if it is a bot, so these queries remain in the dataset.
For this method it was obvious that some kind of user-agents’ list had to be done or use an existing one. Two different approaches were considered to produce this user-agents’ list: having a list of all the existing browsers and remove all the queries whose user-agent string is not there, or start with a list containing all the bots (crawlers, robots, spiders,etc) and remove queries whose user-agent string is in that list. To start the word “all” could not be used in any of these two approaches. There are so many browsers/bots, with different versions, names, OS (Operative System) specific, and other specificities that would not be possible to find and store all of them. For these reasons the list could also not contain the exact user-agent string for every browser/bot version and try to do an exact match with the browser field content; this matching process needed to be regular expressions’ based. Taking all these factors into account the second approach was chosen, because it was much more probable to wrongly discard queries using the first approach; also it is more desirable that some queries made by bots remain in the dataset than to wrongly remove non-bot queries.
To construct this list were used two online sources [Use,And] that include a list of the
most known user-agents’ strings. Browsing trough these two sources, a list of words that
are present on user-agents’ strings was created. This list (check TableA.1in AppendixA)
does not contain the exact string of the bot, but only a word to be used as a regular expres-sion and match the browser’s field content. For example the bot’s string “Blaiz-Bee/1.0 (+http://www.blaiz.net)” could be stored in the list as only “Blaiz-Bee” because there is no need to do a more complicated regular expression (to match the version number). An-other strategy was to store common words on the list so that its length was lower. Words like “bot”, “crawler”, “feed” or “spider” could match a large number of bot’s strings; also this way it was not necessary to store strings like “Arikus Spider”, “Googlebot/2.1”, “grub crawler” because those common words would already match these strings. Extra care was taken to not include any word that could match a browser user-agent string. The final result is a new file with the same structure of the original dataset without the queries made by bots removed.
Some verifications were done to check if the right content was removed or if it was possible to discover new bot’s strings to remove. Two files were created with the list of the user-agents’ strings removed and the remaining. These files were sorted by decreasing order of occurrences, and in each one of them the strings with larger occurrences were checked. With this verification was possible to add new bots’ strings to be removed and
Methodology
check if any of the already removed were, indeed, bots. The original dataset had about 140 million queries (140,112,498). After remove the bots the number of queries was about 102 million queries (101,795,370). This number is quite impressive because around 30% of the queries (38,317,128) stored on the dataset were considered as being made by bots and removed.
4.3.2 Sessions Creation
After cleaning the original dataset from bots, the obvious next step would be the creation of sessions. The original structure of the information stored was very "noisy" especially because the information was spread along many lines and not all of it was really important to analyze. Furthermore, with this original structure it was not trivial to extract specific parts of the dataset. For this reason, all the fields needed in the analysis phase were stored in a file with a different structure. In this file each field is separated by a tab character, separating the fields by columns making easy the access of each field using the UNIX
cut command. The fields stored in this new file were (by this order): date, ip, country,
browser, keywords and city. Figure4.1 shows some lines of the created file. When one
of these fields had no content it was stored in the file the word “EMPTY_FIELD” (e.g. “EMPTY_KEYWORDS” or “EMPTY_COUNTRY”). There were three distinct types of empty queries relative to the keywords field: when there was an empty tag for the field
keywords and it was stored in the new dataset as “EMPTY_KEYWORDS”; when the
field keywords had no content (e.g one or more white-spaces); the third one was the empty taxonomy. Sometimes along with the query terms the tag taxonomy was found. Frequently only the taxonomy information was stored and no query terms (e.g. “taxon-omy:TOP/DESPORTO”); these queries were considered as empty as they don’t contain any content. To simplify the sessions creation this file was sorted first by the ip field and then by the date field. Having the file sorted by these two fields would be much less complicated to create the sessions’ file.
Figure 4.1: The new dataset structure.
Having this file the next step was to create the sessions. The sessions were delimited using the IP address and date of the query. An interval was defined to separate different
Methodology
information needs of the same user. Two consecutive queries are included on different sessions if they have an inactivity of at least 30 minutes between them. This gap value
was used in other studies [CS10,CVn01] and using one avoids having sessions with very
long durations which would not represent the reality. Very often the exactly same query (same date, IP address, query terms, etc) was stored in the dataset more than one time;
these queries were not included in the sessions’ file. As in other studies [SMHM99,JS05,
JSP05, CS10] a cutoff value was used to delimit the maximum number of queries per
session. Any sessions with more than 100 queries were excluded, since sessions with so many queries were likely to come from bots. All the three types of empty queries were also excluded.
Using the dataset sorted by the IP address and date, the creation of sessions was sim-ple. As the queries with the same IP were all together and sorted by date at each step is only necessary to subtract the date of the current query with the last one and check if the difference is less than 30 minutes and the IP address is the same. If these two conditions are true then the session is the same otherwise the query belongs to a new session. When there is a new session the last one is only accepted if the number of queries is not greater than 100.
Figure 4.2: Some lines of the sessions’ file.
To the last dataset structure (see Figure4.1) is added a new column that represents the
session identifier. The date is also stored in a human-readable format (Year-Month-Day
Hours:Minutes:Seconds). Figure 4.2 shows some sessions of the file. At the end of the
session’s creation the total amount of queries dropped considerably. The total number of queries was now 45,413,607, a drop of almost 60% from the total number of queries (101,795,370), with a total number of sessions of 15,767,954. This was mainly because of the removal of sessions with more than 100 queries. There were 14,272 sessions in these situation totalizing 30,474,741 queries. The number of empty queries removed was 14,725,859 (where 1,880,616 were “empty taxonomy”) and repeated queries were
11,181,163. A total of 56,381,763 queries were removed at this stage. Table4.1
Methodology
Table 4.1: Queries Removed in Sessions’ Creation. Queries % (from the last dataset)
Empty Queries 14,725,859 14.47% Empty Tag 12,834,738 12.61% Empty Taxonomy 1,880,618 1.85% Empty Content 10,503 0.01% Repeated Records 11,181,163 10.98% +100 Sessions 30,474,741 29.94% Total 56,381,763 55.39%
Chapter 5
Data Analysis
5.1
Overview
Table 5.1: General Statistics.
Metric Value
Queries 45,413,607
Sessions 15,767,954
Terms 89,609,923
Mean Queries per Session 2.88
Mean Terms per Query 2.03
Mean Characters per Term 6.86
Unique Queries 19.59%
Unique Terms 3.03%
Queries Never Repeated 11.78%
Terms Never Repeated 1.5%
The main results of this analysis are shown on Table5.1. The queries distribution has a
de-fined pattern along the week and hours, as shown in Figure5.1, Figure5.2and Figure5.3.
The mean number of queries per day is 275,234 (median of 290,505). The maximum number of queries in a day was registered on 2010-02-08, with 375,558 queries; the mini-mum was on 2010-06-02 with only 11,346. This last value could be due to an error in the collection process. Except from the first and last months the number of queries per month is similar. These two months should not be compared with the others because the queries are not logged for a full-month period. The number of queries on the other months is between 8 and 9 million queries. The only exception is the month of June where the total amount of queries drops to about 7 million.
The weekly pattern is clearly seen in Figure 5.2. Along the week there is a clear
downward tendency. From Monday to Wednesday the number of queries is almost al-ways above the average. From Thursday the the tendency of decrease is noticeable. The weekend period is when less queries are made. On all Saturdays the number of queries is
Data Analysis
below average and the behavior on Sundays is almost the same. In a study from Vivisimo
[KSJ06], a meta-search engine, the percentage of queries per weekday also clearly drops
on weekends from values between 14% and 17% to 10% and 11% on Saturday and
Sun-day, respectively. In AOL’s study [BJC+07] the results were a little different. In this study
the highest percentage of queries in a weekday is registered on Sundays and from here there is a downward tendency until Friday where is seen the lowest number of queries in a weekday. Unlike this and Vivisimo studies, in AOL’s study from Friday until Sunday the percentage of queries per weekday raises.
In this period there are two drops on midday and 7:00 p.m.; the first one could be related with the lunch break. The highest traffic is verified between 2:00 p.m. and 5:00 p.m., where the number of hourly queries is more than 50% above the hourly mean. This amount of traffic is only again seen on 9:00 p.m. . The hour with the lowest number of queries is 1:00 a.m. and the highest 3:00 p.m.. These results were a bit different from
an AOL study [BJC+07] with the same kind of analysis. In this study the day with less
queries was Friday and the maximum peek was on Sundays. The downward tendency from Monday until Friday was also there, but the number of queries raises steadily on weekends. In this study the hour with less queries was 6:00 a.m. and from this hour until almost the end of the day the number of queries raises almost continuously. The hour with most queries was between 9:00 p.m. and 10 p.m.
month
diff
erence from daily mean quer
y frequency −80% −60% −40% −20% 0% 20% ● ● ● ● ●●● ● ● ● ● ●● ● ● ● ● ● ● ● ● ● ● ● ● ●● ● ● ● ● ● ● ●● ● ● ● ● ● ● ● ● ● ● ●●● ● ● ● ● ● ●● ● ● ●● ● ● ● ● ● ● ● ● ● ● ● ● ● ● ● ● ● ● ● ● ● ● ●●● ● ● ● ● ● ●● ● ● ● ● ● ● ●● ● ● ● ● ● ●● ●● ● ● ● ● ● ● ● ● ● ● ● ● ● ● ● ● ● ● ● ● ● ●● ● ● ● ● ● ● ●● ● ● ●● ● ● ● ● ● ●● ● ●●● ● ● ● ● ●●● ● ●● ●
Feb−10 Mar−10 Apr−10 May−10 Jun−10 Jul−10

![Figure 3.1: Query Frequency along the day [PCT06].](https://thumb-eu.123doks.com/thumbv2/123dok_br/15146576.1012403/34.892.252.593.715.880/figure-query-frequency-along-the-day-pct.webp)