分类号 S511 学校代码 10564 UDC 学 号 2007100011 密 级 学 位 论 文
收获前后调控香稻香气和米质的研究
GOUFO PIEBIEP 指导教师姓名 唐湘如 教授 申请学位级别 博 士 专业名称 作 物 栽 培 学 与 耕 作 学 论文提交日期 2010 年 4 月 论文答辩日期 2010 年 5 月 学院名称 农 学 院 学位授予日期 PhD 答辩委员会主席 官春云 院士 评阅人 刘向东 教授 谭中文 教授 梁计南 教授 钟旭华 研究员Department of Crop Science and Technology
College of Agriculture
South China Agricultural University
(Guangzhou, P. R. China)
Appropriate Set of Pre- and Post-harvest Treatments for
Obtaining High Levels of Aromas and Quality in Fragrant
Rice (Oryza sativa L.)
By
GOUFO PIEBIEP
A dissertation submitted in partial fulfillment of the requirement for the degree of Doctor of Philosophy (Ph.D.) in CROP SCIENCE (first-level discipline),
CROP CULTIVATION AND FARMING SYSTEM (second-level discipline)
Supervisor: Prof. Xiangru Tang (唐湘如)
Chairman of the Defense Committee: Prof. Guan Chunyun (官春云)
Members of the Defense Committee: Prof. Liu Xiangdong (刘向东)
Prof. Tan Zhongwen (谭中文)
Dr. Liang Jinan (梁计南)
Dr. Zhong Xuhua (钟旭华)
Date of thesis submission: 26 April 2010
Date of thesis defense: 25 May 2010
Dedication
To
Appropriate Set of Pre- and Post-harvest Treatments for Obtaining
High Levels of Aromas and Quality in Fragrant Rice (
Oryza sativa L.
)
Piebiep Goufo
(College of Agriculture, South China Agricultural University, Guangzhou 510642, China)
Abstract: Aromatic rices (Oryza sativa L.) constitute a special group of rice accessions
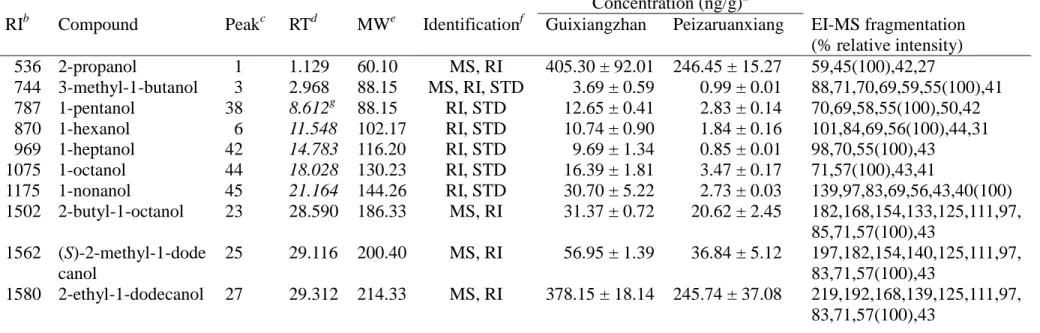
well known for their aroma and/or superfine grain quality. For a successful development of aromatic rices, research regarding factors affecting the quality of the aroma is of economic interest to rice growers and processors. Therefore, this study was conducted as a preliminary step towards the rice quality improvement of two aromatic rice cultivars growing in South China, namely Guixiangzhan and Peizaruanxiang.
The fragrance potential of two rice cultivars was investigated using headspace SPME and static headspace in conjunction with GC-MS, and under optimal conditions for the identification and quantification of the intensely popcorn-like smelling compound 2-acetyl-1-pyrroline (2-AP). About a 5-fold difference of 2-AP levels were observed among the two rices with Guixiangzhan having the highest content (3.86 µg/g) comparable to that obtained with Thai KDML 105 rice. Other compounds instead of 2-AP were assumed to contribute to the characteristic aroma of Peizaruanxiang.
The two cultivars were subjected to four pre-harvest treatments (planting densities of 16, 19, 22, 28, and 37 hills/m2, harvesting times of 10, 20, 30, 40, and 50 days after heading, ripening temperatures during the early and the late seasons, application of growth regulators consisting of gibberellic acid, paclobutrazol, 3-indole acetic acid and a mixture of paclobutrazol, proline, and zinc chloride) and three postharvest treatments (storage
times of 3 and 6 months, storage temperatures of -4, 8, 20, and 30 ºC, milling degree of
85%). Results were also discussed in terms of antioxidants enzymes activities (peroxidase, superoxide dismutase, proline oxidase), yield attributes (number of panicles per hill, number of spikelets per panicle, grain-filling percentage, paddy yield, 1000-grain weight), milling quality (milled rice rate, whole rice rate, head rice rate), grain appearance (% area with chalkiness, grain vitreosity), malondialdehyde, proline, total soluble proteins, amylose and protein contents of rice samples associated with differing pre-harvest regimes.
Highest 2-AP concentrations were obtained for Guixiangzhan and Peizaruanxiang with the lowest planting density of 16 hills/m2 (3.73; 0.69 µg/g), the earliest harvesting
2.42 ng/g), the shortest storage time of 3 months (2.40; 0.45 µg/g) and the coolest
temperature of -4 ºC (3.42; 0.49 µg/g). After milling, 2-AP content decreased up to 1.5-fold
in both Guixiangzhan and Peizaruanxiang. All treatments with growth regulators, although improved grain yield and quality, and enhanced the capacity of Peizaruanxiang and Guixiangzhan to scavenge and control the production of damaging species of active oxygen, resulted in reduced aroma content that negatively affected overall flavor in a smelling evaluation. Decreases ranged from 9 to 24% compared to the control (2.40; 0.41 µg/g).
These findings indicate that manipulating pre and postharvest treatments can greatly improve the specific attributes of the domestically produced aromatic rices. It is assumed from the study that keeping aromatic rice under refrigeration, milling it at a low degree and consuming it within six months would be a practical way to preserve its desirable character as monitored by changes in the levels of 2-AP. Results from our investigation also show that altering sowing dates to allow the critical stages of seed maturation to coincide with favorable field environments (cool and dry segment of the year) as well as planting at low density and early harvesting could improve aroma content and other seed qualities. It is also recommended that the aroma quality should be carefully monitored if growth regulators are to be used. With that in mind, China could effectively increase its share of the domestic market of fragrant rices and even tap into the international market.
Keywords: aromatic rices, 2-acetyl-1-pyrroline, quality, planting density, harvest date, growth regulators, storage conditions
摘 要
香稻是特种稻,以其芳香的气味和超优的米质被人们所熟知。随着香稻的不断 发展,探明影响香稻香气成分含量和米质的有关因素,对香稻种植者和加工者的经济 利益提高具有重要的作用。因此,本论文以华南地区两个香稻品种香稻桂香占和培杂 软香为材料,研究了收获前后调控香稻香气和米质的作用,主要结果如下: 利用了顶空固相微萃取技术和静态顶部空间气质联用技术,在最佳的条件下定 性及定量测定香稻桂香占和培杂软香的具有强烈爆米花气味的化合物 2 -乙酰- 1 -吡 咯啉(2 -AP)含量,以桂香占 2-AP 含量为最高(3.86 µg/g),高出泰国米 KDML105 5 倍;其他非 2-AP 化合物对促进培杂软香特有的香气形成具有一定的作用。 对桂香占和培杂软香两个品种进行了 4 个收获前处理:种植密度处理分别为 16、 19、22、28 和 37 穴/m2;收获时期处理分别为抽穗后 10d、20d、30d、40d 和 50d 收 割;种植季节处理分别为早季和晚季;植物生长调节剂处理分别为在抽穗期施用赤霉 素、多效唑、 3 -吲哚乙酸和多效唑、脯氨酸、和氯化锌的混配剂等和 3 个收获后处 理:贮藏时间处理分别为贮藏 3 个月和 6 个月;贮藏温度处理分别为-4℃、8℃、20℃ 和 30℃及碾磨程度处理分别为和常规碾磨和 85%的常规碾磨程度。测定了不同收获 前处理的香稻样品的过氧化物酶、超氧化物歧化酶和脯氨酸氧化酶活性,有效穗、每 穗总粒数、结实率、千粒重和产量等性状,糙米率、精米率、整精米率、垩白粒率、 垩白度和直链淀粉含量等品质性状,以及丙二醛、脯氨酸和蛋白质含量。结果表明, 桂香占和培杂软香的 2-AP 含量最高值分别出现在种植密度最稀的 16 穴/m2 处理分 别为 3.73µg/g 和 0.69 µg/g;收获时间最早的处理即抽穗后 10d 收获的 2-AP 含量最高, 桂香占为 5.24µg/g 和培杂软香为 0.72 µg/g;成熟期温度最低的 25℃处理的 2-AP 含量 最高,桂香占为 7.12µg/g 和培杂软香为 2.42 µg/g;储藏时间最短的 3 个月处理的 2-AP 含量最高,桂香占为 2.40µg/g 和培杂软香为 0.45 µg/g;储存温度最低的-4℃处理 2-AP 含量最高,桂香占为 3.42µg/g 和培杂软香为 0.49 µg/g;碾磨后,桂香占和培杂软香 的 2-AP 含量低出研磨前含量 1.5 倍;相对于对照,所植物生长调节剂处理,虽然提 高了桂香占和培杂软香的谷粒产量和质量,增强了其清除和控制其产品中活性氧危害 的能力,但是减少了香气物质的含量,降幅介于 9%至 24%,从而导致了在气味评估 方面的消极影响。 上述结果表明,利用收获前后处理,可大大改善中国国产香米的具体特征。通过冷藏香米、低的碾磨程度和储存时间低于 6 个月是有利于维持香米优良特征可行办 法,有利于防止香米 2-AP 水平的下降;利用改变播期使种子成熟的关键阶段与良好 的田间环境相适应,即,使香稻灌浆熟期处于温度相对较低和干燥的时间段,以及在 低密度和适期早收的种植方式等可以提高香稻香气含量和米质;香稻生产上应注意使 用植物生长调节剂对香气含量的不利影响。 因此,通过应用收获前后对香稻香气和米质有利的调控措施可以在不同程度上 改良香稻香气和品质性状,增加香米国内市场份额,甚至打入国际市场。 关键词:香稻 2 -乙酰- 1 -吡咯啉 品质 密度 生长调节剂 收获期 储存
Contents
1 General introduction
... 11.1 Overview of the topic ... 1
1.2 Aims of the work ... 2
1.3 Importance of the study ... 3
2 Materials and methods
... 52.1 Rice cultivars used in the study and experimental site... 5
2.2 Chemicals used and their sources ... 7
2.3 Techniques used for extraction and quantification of volatile components ... 9
2.3.1 Headspace SPME/GC-MS analysis of overall rice volatiles ... 9
2.3.2 Static headspace (SHS-GC/NPD) for quantification of 2-AP ... 13
2.4 Extraction and quantification of lipid degradation volatile and non-volatiles ... 17
2.4.1 Static headspace (SHS-GC/FID) analysis of lipid oxidation volatiles ... 17
2.4.2 Determination of malondialdehyde (MDA) content ... 22
2.5 Sensory evaluation protocol... 24
2.5.1 Sniffing test for warmed brown rice ... 24
2.5.2 Hedonic test for cooked milled rice... 24
2.6 Yield and yield components evaluation... 25
2.6.1 Number of panicles per hill ... 25
2.6.2 Number of spikelets per panicle ... 25
2.6.3 Grain-filling percentage ... 25
2.6.4 Weight of 1000-grains rough rice ... 26
2.6.5 Average grain yield ... 26
2.7 Milling quality evaluation ... 26
2.7.1 Brown rice rate ... 27
2.7.2 Milled rice rate ... 27
2.7.3 Head rice rate ... 28
2.8 Estimation of grain vitreosity and percentage area with chalkiness ... 28
2.9 Determination of the apparent amylose content ... 29
2.10 Estimation of protein content by the Kjeldahl method ... 31
2.11 Studies on the relationship between proline and 2-AP biosynthesis ... 34
2.11.2 Coomassie-Bradford method for total soluble protein determination ... 36
2.11.3 Colorimetric method for measuring free proline ... 38
2.12 Determination of anti-oxidative enzyme activities for stress studies ... 41
2.12.1 Assay for superoxide dismutase (SOD) activity ... 41
2.12.2 Assay for peroxidase (POD) activity ... 43
3 Topics, results and discussion
... 453.1 Fragrance quality of two rice cultivars grown in South China analyzed by headspace techniques coupled to GC-MS ... 45
3.1.1 Introduction ... 45
3.1.2 Experimental ... 47
3.1.2.1 Rice cultivars ... 47
3.1.2.2 Rice samples preparation ... 47
3.1.2.3 Statistical data analysis ... 48
3.1.3 Results ... 48
3.1.3.1 Extraction method for 2-acetyl-1-pyrroline ... 48
3.1.3.2 Comparison of Guixiangzhan and Peizaruanxiang flavors ... 50
3.1.3.3 Fragrance potential of South China fragrant rices ... 50
3.1.4 Discussion ... 57
3.1.4.1 Extraction method for 2-acetyl-1-pyrroline ... 57
3.1.4.2 Comparison of Guixiangzhan and Peizaruanxiang flavors ... 58
3.1.4.3 Fragrance potential of South China fragrant rices ... 59
3.1.5 Conclusion ... 59
3.2 Factors affecting concentration of 2-acetyl-1-pyrroline, and other seed quality traits in aromatic rice ... 60
3.2.1 Introduction ... 60
3.2.2 Experimental ... 61
3.2.2.1 Rice planting seasons ... 61
3.2.2.2 Rice growth conditions ... 62
3.2.2.3 Rice densities practiced ... 63
3.2.2.4 Harvest dates adopted ... 64
3.2.2.5 Yield and quality parameters measured ... 64
3.2.2.6 Statistical analysis ... 65
3.2.3.1 Effect of planting density on 2-acetyl-1-pyrroline content ... 65
3.2.3.2 Effect of planting density on rice yield and quality ... 68
3.2.3.3 Effect of planting density on proline content, lipid peroxidation and antioxidative systems of rice ... 69
3.2.3.4 Effect of harvesting time on 2-acetyl-1-pyrroline content ... 75
3.2.3.5 Effect of harvesting time on rice yield and quality ... 77
3.2.3.6. Correlation between proline and 2-acetyl-1-pyrroline contents ... 78
3.2.3.7 Effect of planting season on 2-acetyl-1-pyrroline ... 80
3.2.3.8 Effect of planting season on rice yield and quality ... 81
3.2.3.9 Effect of storage time and temperature on 2-AP content ... 82
3.2.3.10 Effect of milling degree on 2-acetyl-1-pyrroline content ... 83
3.2.4 Discussion ... 84
3.2.4.1 Planting density rates for optimum aroma and quality of rice ... 84
3.2.4.2 Optimum harvesting time for fragrant rice based on aroma content... 84
3.2.4.3 Correlation between proline and 2-acetyl-1-pyrroline contents ... 85
3.2.4.4 Seasonal variation of aroma content and rice quality parameters ... 86
3.2.4.5 Aroma stability during storage ... 87
3.2.4.6 Aroma preservation with milling ... 87
3.2.5 Conclusion ... 87
3.3 Change in the level of some odor-active volatile compounds of aromatic rice after application of growth regulators ... 89
3.3.1 Introduction ... 89
3.3.2 Experimental ... 91
3.3.2.1 Plot area, rice cultivars and growth conditions ... 91
3.3.2.2 Foliar application of plant growth regulators ... 91
3.3.2.3 Harvesting, storage and parameters measured ... 94
3.3.2.4 Sensory evaluation protocol ... 94
3.3.2.5 Statistical analysis ... 94
3.3.3 Results ... 94
3.3.3.1 Separation and identification of odor-active compounds ... 94
3.3.3.2 Influence of growth regulators on nitrogen-containing compounds ... 97
3.3.3.3 Influence of growth regulators on lipid oxidation aldehydes ... 98
3.3.3.4 Influence of growth regulators on malondialdehyde content ... 103
3.3.3.6 Influence of growth regulators on aromatic compounds ... 104
3.3.3.7 Influence of growth regulators on cooked rice odor ... 104
3.3.3.8 Influence of growth regulators on proline content, lipid peroxidation and antioxidative systems of rice ... 107
3.3.3.9 Influence of growth regulators on rice yield and quality ... 112
3.3.4 Discussion ... 118
3.3.4.1 Separation and identification of odor-active compounds ... 118
3.3.4.2 Influence of growth regulators on nitrogen-containing compounds ... 118
3.3.4.3 Influence of growth regulators on lipid oxidation aldehydes ... 119
3.3.4.4 Influence of growth regulators on malondialdehyde content ... 120
3.3.4.5 Influence of growth regulators on lipid oxidation alcohols ... 120
3.3.4.6 Influence of growth regulators on aromatic compounds ... 121
3.3.4.7 Influence of growth regulators on cooked rice odor ... 121
3.3.4.8 Influence of growth regulators on proline content, lipid peroxidation and antioxidative systems of rice ... 122
3.3.4.9 Influence of growth regulators on rice yield and quality ... 122
3.3.4.10 Modes of action of plant growth regulators ... 122
3.3.5 Conclusion ... 124
4 Conclusions and recommendations ... 126
Acknowledgements... 128 References ... 129 Appendix ... 138 List of tables………....146 List of figures………..149 List of appendix………..151 Publication progress………...152 Abbreviations………...153 Declaration………..154
1 General introduction
1.1 Overview of the topic
Aromatic rices constitute an important subgroup of rice that is becoming increasingly popular in China and the whole world due to their distinct flavor (Glaszmann, 1987; Singh et al. 2000; Smith and Dilday, 2003; Sweeney and McCouch, 2007). They are a bit more expensive than plain white rice, but their qualities are well worth the price. Main aromatic cultivars grown in the world are Basmati from India and Pakistan (Singh et al. 2000; Bhattacharjee et al. 2002, 2003; George et al. 2005), and Jasmine from Thailand (Singh et al. 2000; Mahatheeranont et al. 2001). Therefore, most of the trade in aromatic rice is from India, Pakistan and Thailand and is exported mainly to Saudi Arabia, UAE, Kuwait, Oman, Russia, UK, and USA (Singh et al. 2000). In addition to Basmati and Jasmine, however, a diverse cross-section of specialty rice types are produced or have been developed in other countries that have unique flavour, nutritional, textural, aesthetic, or other properties that often garner higher prices in the market place.
Although accounting for about 30% of total world production, China has not been able to play a leading role in the aromatic rice production. With the amelioration of living standards in China in recent years, however, the aromatic rice demand is constantly increasing. There has been a steady growth in the export of Jasmine rices from Thailand to China during the past 10 years. In 1995, China imported 261, 553 tonnes of Jasmine rice compared to 5, 250 in 1988 (Singh et al. 2000). Therefore, the trend of increased aromatic rice production and consumption is promising for the rice industry in the country, with an opportunity to tap into the international rice market. By developing successful aromatic rice cultivars, China can take advantage of this highly priced, growing rice market. In most part of China, the development of new aromatic rice cultivars has become a high priority within several rice-breeding programs. Thus, efforts have been undertaken for the last decades to promote the production of aromatic cultivars in Guangdong, a traditional rice cultivation area in the south of China. Some old scented cultivars have been revalorized (e.g. Guixiangzhan) and new ones adapted to the tropical climate have been developed (e.g. Peizaruanxiang) (Tang and Wu, 2007; Duan et al. 2009).
The economic value of aromatic rice crop depends mainly on the aroma. In breeding new rice cultivars, however, there is the danger of changing that subtle desirable feature. Numerous studies performed in the past 50 years on the composition of volatile rice
constituents have led to the identification of close to 300 compounds up to now. This number is still increasing due to rapid development in analytical techniques and the release of new cultivars. The volatiles identified vary with the degree of milling, isolation technique, cooking method, and storage duration. Important aroma compounds have been detected in
rice using advanced methods involving direct solvent extraction for
collection/concentration (SE) (Bergman et al. 2000; Mahatheeranont et al. 2001; Itani et al. 2004), stable isotope dilution (SID) (Yoshihashi, 2002; Yoshihashi et al. 2002), simultaneous steam distillation/extraction (SSDE) (Lin et al. 1990; Tanchotikul and Hsieh 1991; Widjaja et al. 1996b; Tava and Bocchi 1999; Mahatheeranont et al. 2001), supercritical fluid extraction (SFE) (Bhattacharjee et al. 2003), static headspace (SHS) (Sriseadka et al. 2006), dynamic headspace also called “purge and trap” (DHS) (Yang et al. 2008a, 2008b, 2008c), headspace solid-phase micro-extraction (HS-SPME) (Grimm et al. 2001; Ghiasvand et al. 2007).
Among the volatiles identified, there are a relatively small number of odor-active compounds. It is assumed that the good smell of aromatic rices stem primarily from its 2- acetyl-1-pyrroline (2-AP) content (Buttery et al. 1988). Although most aromatic types assessed to date contain 2-AP, they have very different aromas. It is, however, not yet clear whether differences in 2-AP concentrations, or the presence of a different set of odorants, are responsible for such aroma differences.
In addition, the aroma quality is reported to depend on cultivation conditions and postharvest practices. There is no agreement, however, with regard to factors controlling that aroma, and this could probably be related to the lack of extensive and objective work on the issue. Knowledge of the changes in volatiles induced by pre-harvest treatments, processing and storage is therefore of great importance.
1.2 Aims of the work
This project was initiated in order to assist with the development of South China aromatic rices by investigating the aroma, yield and quality of a new breeding line (Peizaruanxiang) and compare this with an existing cultivar (Guixiangzhan). The two rices are grown in Guangdong Province and possess a strong characteristic aroma, which differed greatly from the aroma of non-aromatic rices. However, chemical characterization of aromatic compounds in the two rices has not been attempted.
As a preliminary step towards that objective, volatile compounds emanating from Guixiangzhan and Peizaruanxiang headspaces were identified and quantified using GC-MS,
with an emphasis placed on 2-AP considered the single most important volatile in rice. In order to assist in the development of aromatic rice cultivars suited to a particular local environmental conditions, rice breeders have an interest in gaining access to an appropriate method for extracting volatile compounds. Two of such methods were investigated in the study: static headspace and headspace solid phase micro-extraction. To establish the fragrant potential of South China cultivars, samples of imported Thai aromatic rice (KDML 105) were also analyzed for attribute comparisons.
Of the pre-harvest factors that can affect rice yield and quality, a producer can only control few of them such as seeding date, planting density, drain time and grain moisture at harvest. In a second step of our study, the two cultivars were subjected to two different pre-harvest treatments: planting density and harvest date. Analyses performed on the data also measured seasonal variation of 2-AP over two planting seasons.
A third experiment was conducted to assess the effects of application of plant growth regulators at 25% panicle emergence on 2-AP, lipid oxidation volatiles and other odor-active compounds in the two rices. Efforts were made to correlate the special flavors of rice grains to specific volatile compounds or groups of compounds.
A storage trial was also performed where a selection of the two rice cultivars
underwent a 3 to 6 month storage period at 4 different temperatures (-4 ºC, 12 ºC, 20 ºC, and
30 ºC).
For all the experiment conducted, results were also discussed in terms of antioxidants enzymes activities (peroxidase, superoxide dismutase, proline oxidase), yield attributes (number of panicles per hill, number of spikelets per panicle, grain-filling percentage, paddy yield, 1000-grain weight), milling quality (milled rice rate, whole rice rate, head rice rate), grain appearance (% area with chalkiness, grain vitreosity), malondialdehyde, proline, total soluble proteins, amylose and protein contents of rice samples associated with differing pre-harvest regimes.
Finally, the possible involvement of proline in the biosynthetic pathway of 2-AP was investigated. Rice leaves and grains were harvested at different days after heading to determine if there was any relationship between proline oxidase activity, proline content and aroma content in rice plants and grains.
1.3 Importance of the study
An understanding of how genetic, pre, and post-harvest factors affect the aroma and quality characteristics of rice will help producers and processors meet the needs of specific
customers and foster the development of a diversified rice market. Results of this analysis will be helpful in several respects:
1. Extracting and quantifying volatiles components will be useful to infer on the type of compounds most significant in improving the scented character of aromatic rices and to know the possible involvement of new compounds associated with aroma formation with the final objective to aid the breeding of rice cultivars with specific aroma traits.
2. Addressing questions about the density can contribute to know the appropriate seeding rate to adopt for an optimum production of aromatic rices and to reduce risks associated with lodging, strong shedding and susceptibility to pests and diseases.
3. According to experts, improper harvest can lead up to 15% yield losses in rice. Accordingly determining the appropriate harvesting time is important and can aid growers in makingdecisions based on expected grain aroma content.
4. Identifying and targeting the suitable temperature is necessary because other management strategies, such as application of aroma improvers may not be feasible in certain situations.
5. Application of plant growth regulators is widely practiced to improve yield. However there may well be some impact of hormone levels on the aroma of aromatic rices. Therefore investigation of the effects of growth hormones on the aroma volatiles in rice plants and grain will help clarify requirements for aroma development. This can also help to predict the durability of the effectiveness of fertilizers and aroma improvers’ application. 6. Correlation of data obtained on rice storage time and temperature, and milling degree could define an appropriate set of post-harvest treatments for obtaining aromatic rice products with low substantial loss or reduction in quality.
Understanding these relationships will have an economic impact on the aromatic rice industry in the region, with much of the information being relevant to aromatic rices grown in other countries. This could also help the Chinese rice industry to obtain a sizable portion of this fast growing, high value aromatic rice market, both domestically and internationally.
2 Materials and methods
2.1 Rice cultivars used in the study and experimental site
Rice cultivars
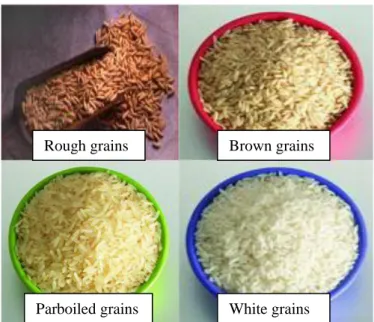
Two Indica fragrant rice cultivars were used throughout the study, namely Guixiangzhan and Peizaruanxiang. The two rices represent the two major types of fragrant cultivars in Guangzhou. Guixiangzhan (medium-grained) has been cultivated in South China since the sixties while Peizaruanxiang is a hybrid long-grained cultivar released recently by the breeding group of the college of Agriculture of South China Agricultural University (SCAU) with better attributes in terms of yield and grain size (Figure 2.1,
Table 2.1).
Figure 2.1 Rough, brown, parboiled and white grains Guixiangzhan rice. Table 2.1 Main characteristics of Guixiangzhan and Peizaruanxiang rice cultivars
Characteristics Guixiangzhan Peizaruanxiang
Cultivar classification Conventional Hybrid
Growth duration early season(days) 110-120 115-125
Growth duration late season (days) 90-100 95-105
Foliage color bright green green-yellow
Plant height (cm) 90-110 110-115
Grain length/width ratio 2.98 (slender) 3.18 (medium)
Apparent amylose content (%) 20.43 (intermediate) 28.37 (high)
Average protein content (%) 8.17 9.06
Gel consistency (mm) 65 (soft) 58 (flaky)
Grain vitreosity (%) 90.67 80.33
Rough grains Brown grains
Seeds of Guixiangzhan were collected from a previous harvest while those of Peizaruanxiang were purchased from a local shop situated inside the University. Samples of imported Jasmine Khao Dawk Mali 105 (KDML 105) were also analyzed along with Guixiangzhan and Peizaruanxiang samples. KDML samples were cultivated in a paddy of a local farm in the Surin Province in northeastern Thailand during November 2008 and kept for more than one month at an ambient temperature of ± 20 °C.
Experimental site
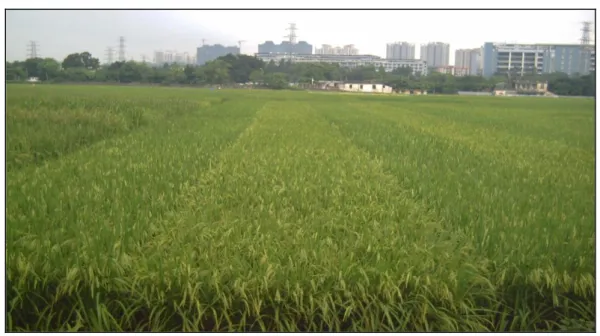
The two rice cultivars were grown in SCAU experimental farm (Figure 2.2), located
in Tianhe district (3o08’N and 113o12’E) in Guangzhou.
Figure 2.2 Guixiangzhan and Peizaruanxiang growing vigorously in SCAU experimental field.
Guangzhou is the capital of the most populous province in China, Guangdong province. It has a land area of 7,434 km2 and it is located at 112°57'E to 114°3'E and 22°26'N to 23°56'N. The city is part of the Pearl River Delta. Neighboring areas are Hunan, Jiangxi, Fujian, and Hainan provinces; Guangxi Zhuang Autonomous Region, Hong Kong and Macao. Guangzhou is a sub-provincial city. It has direct jurisdiction over ten districts (Yuexiu, Liwan, Haizhu, Tianhe, Baiyun, Huangpu, Huadu, Panyu, Nansha, and Luogang) and two county-level cities (Conghua and Zengcheng). Guangzhou has a humid subtropical climate influenced by the Asian monsoon, with an annual average
Trials were performed over two seasons, the early season of 2008 (from March 8th to
July 12th) and the late season of 2008 (from July 16th to November 1st). The same field was
used for the experiments in both seasons of the study and consisted of a sandy loam soil. The experimental site was left fallow during the winter. The first season was wet with high temperatures and a high humidity index, while the second was mild, dry and sunny as illustrated in Figure 2.3.
Early season of 2008: 5 March - 12 July
Late season of 2008: 12 July - 1 November
Figure 2.3 Temperature evolution during the early and late seasons of 2008 at SCAU experimental farm.
2.2 Chemicals used and their sources
Standard compounds
Authentic compounds used for identification in the headspace analysis were (E)-hexenal, hexanal, 1-nonanol, decanal, benzaldehyde and benzothiazole (Sigma, St. Louis, MO), heptanal, octanal, 3-methyl-1-butanol, 1-pentanol, 1-hexanol (Fluka, Buchs, Switzerland), 2,6-dimethylpyridine (2,6-DMP), 2,4,6-trimethylpyridine (2,4,6-TMP), toluene, 1-heptanol (BDH Chemicals, Poole, England),vanillin, guaiacol, 1-octanol, and nonanal (Merck, Darmstadt, Germany).
Stock solutions of standards were prepared with benzyl alcohol (Fisher, Loughborough, UK) and stored at -80 °C until use.
Synthesis of 2-acetyl-1-pyrroline
For 2-acetyl-1-pyrroline (2-AP) synthesis, 2-acetylpyrrole (Fluka, Buchs, Switzerland) was hydrogenated in methanol solution (Merck, Darmstadt, Germany) using
5% rhodium on an activated alumina catalyst (Fluka, Buchs, Switzerland) at room
temperature under 10 psi of H2 pressure (Buterry et al. 1983). The main product obtained,
2-(1-hydroxyethyl)pyrrolidine, was isolated, weighed and subjected to oxidation by refluxing with a stirred suspension of silver carbonate (Aldrich (Milwaukee, WI) on Celite (Fluka, Buchs, Switzerland) in toluene solution under a nitrogen atmosphere (Buttery et al. 1983). 2-AP was purified from the resulting mixture with the aid of a packed column (3% dimethylpolysiloxane coated on 80/100 mesh solid supports) of a Varian gas chromatograph (GC), model 2000 (Walnut Creek, CA). The principal peak for 2-AP emerging from the GC detector outlet was collected in a 3-mm-o.d. Pyrex tubes which was
sealed under a N2 atmosphere and stored at -20 °C. Chemical structure of the purified 2-AP
was first examined by capillary GC-MS. The major mass spectrum data (MS/El) at m/z 111 (27%), 83 (43%), 69 (21%), 68 (27%), 43 (100%), 42 (23%), 41 (60%) were the same as reported in the literature. Second, the chemical structure was examined by infrared (IR) at the end of which IR were also found to be consistent with what reported in the literature.
The structure of 2-AP was latter confirmed by nuclear magnetic resonance (1H NMR)
spectroscopy by diluting an exact weight of the purified 2-AP in 1.0 mL of deuterated benzene (Merck, Darmstadt, Germany) spiked with a known quantity of tetramethylsilane (TMS) (Aldrich, Steinheim, Germany) used as an internal standard. The quantity of the synthetic 2-AP was obtained by calculating the integrated proton signal of the methyl group of 2-AP against those of the TMS.
Plant growth regulators
Gibberellic acid 90%, paclobutrazol 95%, 3-indole acetic acid 99%, proline, and zinc chloride were purchased from Xiamen Topusing Chemical Co., Ltd (Fujian, P.R. China).
Other reagents
Reagents used for quality evaluation and enzyme activities were all procured from four different sources: Guanghua Chemicals (Guangzhou, P.R. China), Kermel (Tianjin, P.R China), Sinopharm Chemical (Shanghai, P.R. China), and Biocaro International (Hong Kong, P.R China). Pesticides and fertilizers were obtained from the same sources.
Water was purified through an Aquapro AWL-6001-P distillator (EverYoung, Guangzhou, P.R. China).
2.3 Techniques used for extraction and quantification of volatiles
2.3.1 Headspace SPME/GC-MS analysis of overall rice volatiles
Principle
Solid phase micro-extraction (SPME) involves the use of a fiber coated with an extracting phase, that can be a liquid (polymer) or a solid (sorbent), which extracts different kinds of analytes (including both volatile and non-volatile) from different kinds of media, that can be in liquid or gas phase. The quantity of analyte extracted by the fiber is proportional to its concentration in the sample so long as equilibrium is reached or, in case of short time pre-equilibrium, with help of convection or agitation. After extraction, the SPME fiber is transferred to the injection port of separating instruments, such as a GC, where desorption of the analyte takes place and analysis is carried out.
The attraction of SPME is that the extraction is fast and simple and can be done without solvents, and detection limits can reach parts per trillion levels for certain compounds. The method also provides the advantage to incorporate extraction, concentration, and sample introduction in a single step, and coupled to a mass spectrometer
(Figure 2.4) as detector, can easily help identify the compounds of interest (Pawliszyn,
1997).
Figure 2.4 A schematic representation of a mass spectrometer. Rice samples preparation
All samples were dehulled and milled with a Jing Mi machine (Guangzhou, P.R China) to a 85% milling yield, brown rice basis. Only brown grains were analyzed by SPME/GC-MS. Ground samples were prepared by crushing of 30 g portions of rice grains in a household blender (Moulinex, Caen, France) for 30 s, and then screening the flour
obtained through a 0.2-mm diameter mesh sieve (Endecotts Ltd., London, UK). Rice flour samples obtained were subjected to analysis immediately.
Extraction and collection of volatiles
Extraction was carried out in an Autotherm heater (Walnut Creek, CA) with agitation
(Figure 2.5).
Brown rice in a PDMS Extraction of volatiles in GC/MS analysis 27-mL bottle fiber an Autotherm heater
Figure 2.5 Procedure for headspace SPME/GC-MS analysis of rice volatiles.
Optimum operating parameters for the adsorption of rice volatiles using HS-SPME were taken as follow:
SPME Optimum conditions
Brown rice powder size 20.0 g
Bottle size 27 mL
Extraction temperature 60 ºC
Extraction time 20 min
Internal standard (2,6-DMP 0.5 mg/L) 10.0 µL
Fiber type PDMS
Fiber length 1 cm
A portion of brown rice powder weighted exactly 20.0 g was placed in a 27-mL bottle, and added with 10.0 µL of 2,6-DMP. The sample bottles were then sealed with an aluminum cap with hole placed on top of a PTFE/Silicone septa (Restek Corp., Bellefonte, PA). Volatile components from the headspace were collected by adsorption on the SPME fiber (Supelco, Bellefonte, PA), which was preconditioned in the GC injection port at 250
ºC for 1 h before use. Extractions of all rice samples were performed in triplicate. Inside
the bottle, the fiber was lowered from its protective sheath and exposed to the headspace of the sample for 20 min.
Gas chromatography analysis
After concentration of the volatiles, the fiber was pulled into the needle sheath and the syringe assembly of SPME was removed from the vial and inserted into the injection port of a GC instrument (HP6890, Agilent Technologies, DE) with the following characteristics:
Oven parameters
OVEN Optimum conditions
Maximum temperature 325 °C
Equilibration time 0.50 min
Initial temperature 40 ºC for 0 min
First ramp 4 °C/min to 150°C
Second ramp 3 °C/min to 220°C
Final temperature 250 °C for 5 min
Run time 50.83 min
Inlet parameters
INLET Optimum conditions
Mode Splitless
Equilibration time 0.50 min
Initial temperature 250 ºC
Pressure 7.00 psi
Purge flow 99.4 mL/min
Purge time 0.00 min
Total flow 103.5 mL/min
Saver flow 20.0 mL/min
Saver time 2.00 min
Gas type Helium ON
Column parameters
COLUMN Optimum conditions
Column type Capillary AT-5MS
Maximum temperature 325 ºC
Nominal length 30.0 m
Nominal diameter 250.00 µm
Nominal film thickness 0.25 µm
Flow mode Constant
Initial flow 1.0 mL/min
Nominal init pressure 7.00 psi
Average velocity 36 cm/s
The fiber was left there for reconditioning (15 min) before it was exposed to the headspace volatiles of the next sample.
Mass spectrometer parameters
An HP5973 mass spectrometer (Agilent Technologies, DE) equipped with an Agilent ChemStation software D.01.01.SDK for data collection was used in the electron ionization mode with the following parameters:
MS parameters Optimum conditions
Injection port temperature 250 ºC
MSD transfer line 280 ºC
Acquisition mode Scan
EM absolute False EM offset 1365.0 Resulting EM voltage 2729.4 Low mass 35 High mass 400 Threshold 150
Acquisition rate 6.35 spectra/s
Turbo speed temperature 100 ºC
Quadrupole tremperature 150 ºC
Ion source temperature 230 ºC
Ionization energy 70 eV
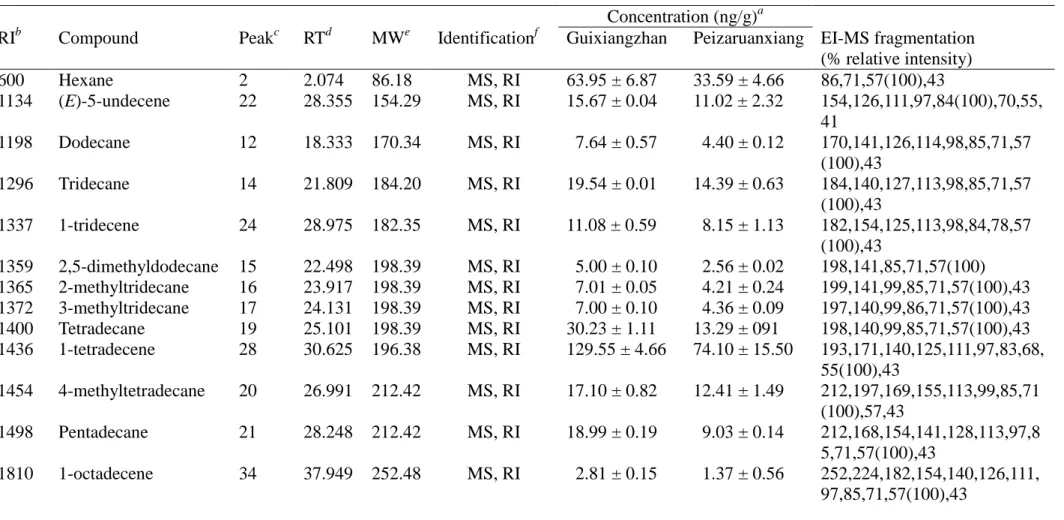
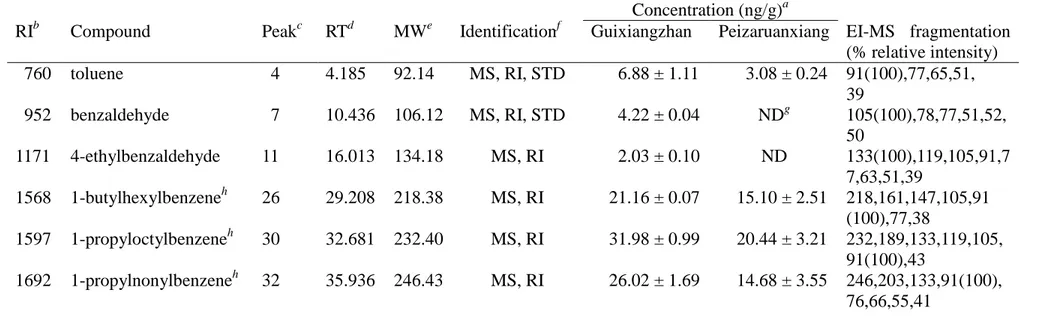
Volatiles identification
Identification of most volatile compounds was performed tentatively according to their corresponding mass spectra, comparing them with the spectra of reference compounds in both the Wiley mass spectral library (6th Ed) and the NIST mass spectral library (v. 1.5a), and verified on the basis of mass spectra, and GC retention time values reported in the literature when available. Other compounds were positively identified by comparing their mass spectra and RI values with those of authentic compounds using the standard addition technique.
Retention time of each volatile was converted to the Kovats retention index (RI)
using an alkane mixture (Fluka, Buchs, Switzerland) consisting of C8–C20 alkanes
(concentration of 40 mg/mL in hexane) as the references. Loading the alkane mixture onto the fiber was carried out by 5 min headspace extraction from a 27-mL SPME vial, including 1.0 mL HPLC-grade water spiked with 10 µL of the above-mentioned mixture. The Kovats index was calculated by the equation:
log(tr(unknown)) – log(tr(n))
RI = 100 × [n + (N – n) ---] log(tr(N)) – log(tr(n))
where RI = Kovats retention index; n = the number of carbon atoms in the smaller alkane;
N = the number of carbon atoms in the larger alkane; tr = the adjusted retention time.
Expression of the relative concentration
The chromatograms obtained from the total ion current were integrated and the abundances of the volatiles of interest were recorded as the area under the peak. Quantification was performed based on an internal standard method using the formula:
Compound area × 2,6-DMP concentration (ng/µL) × Injection volume (µL) Concentration (ng/g) = ---
2,6-DMP area × Rice sample weight (g)
The results were expressed as the average of three replicates of each rice cultivar.
2.3.2 Static headspace (SHS-GC/NPD) for quantitation of 2-acetyl-1-pyrroline
Principle
In static headspace, the sample is sealed into a vessel, warmed, and then a sample of the atmosphere surrounding the sample is withdrawn and injected into the injection port of the GC. For quantitative analysis of 2-AP, static headspace coupled to a nitrogen phosphorous detector (NPD) was validated to extract, both efficiently and conveniently, micro-volatile organic nitrogen-containing heterocyclic compounds from rice plants (Sriseadka et al. 2006). NPD is based on the flame ionization detector (FID) but differs in that it contains a rubidium or cesium silicate (glass) bead situated in a heater coil, a little distance from the hydrogen flame. The heated bead emits electrons by thermionic emission, hence the name thermionic detector. These electrons are collected under a potential of a few volts by an appropriately placed anode, and provides a background current. When a solute containing nitrogen or phosphorous is eluted from the column, the partially combusted nitrogen and phosphorous materials are adsorbed on the surface of the bead. The adsorbed material reduces the work function of the surface and, as consequence, the emission of electrons is increased which raises the current collected at the electrode
(Figure 2.6). The sensitivity of the detector to phosphorous is about 10-12 g/mL and for
Figure 2.6 Schematic of a Nitrogen Phosphorus Detector (NPD).
Rice samples preparation
Both brown and white rice sample were ground (Moulinex, Caen, France) into a powder (less than 0.3 mm in diameter) and used immediately. Rice powder weighted exactly 1.0 g was placed into a 20 mL headspace vial, followed by the addition of 1.0 µL of 2,6-DMP in benzyl alcohol.
Sample preparation Optimum conditions
Brown rice powder size 1.0 g
Vial size 20 mL
Internal standard (2,6-DMP 0.5 mg/L) 1.0 µL
Rice powder in Static headspace autosampler GC analysis a 20 mL vial
The headspace vial was sealed immediately with a PTFE/silicone septum and aluminum crimp cap (Restek Corp., Bellefonte, PA), prior to analysis by SHS-GC/NPD as shown in Figure 2.7.
Headspace autosampler conditions
SHS-GC/NPD analyses were carried out using an Agilent 6890N GC model equipped with a G1888 headspace autosampler, both from Agilent Technologies (Wilmington, DE). Data acquisition and evaluation were accomplished using an Agilent ChemStation software A.01.04 and B.01.03. The headspace autosampler conditions were as follows:
Headspace parameters Optimum conditions
Extractions per vial 1
Oven stabilization time 1.0 min
GC cycle time 30.0 min
Injection time 0.40 min
Injection volume 1.00 µL
Syringe size 10.0 µL
Loop equilibration time 0.60 min
Loop filling time 0.01 min
Loop temperature 130 ºC
Oven temperature 120 ºC
Shake High shaking
Transfer line temperature 140 ºC
Vial equilibration time 9.0 min
Vial pressurization time 0.10 min
Sample loop 3.00 mL
Gas chromatography analysis
Sample headspace was collected through a 3 mL sample loop and automatically transferred to the GC via a heated transfer line with the following parameters:
Oven parameters
OVEN Optimum conditions
Maximum temperature 280 °C
Equilibration time 0.10 min
Initial temperature 50 ºC for 0 min
Ramp 5 °C/min to 125 °C
Final temperature 225 °C for 8 min
Inlet parameters
INLET Optimum conditions
Mode Splitless
Equilibration time 0.00 min
Initial temperature 230 ºC
Pressure 3.78 psi
Purge flow 24.8 mL/min
Purge time 0.50 min
Total flow 32.9 mL/min
Saver flow 20.0 mL/min
Saver time 2.00 min
Gas type Helium OFF
Column parameters
COLUMN Optimum conditions
Column type Capillary HP-5MS
Column characteristics Agilent 19095J-323
Maximum temperature 300 ºC
Nominal length 30.0 m
Nominal diameter 530.00 µm
Nominal film thickness 1.50 µm
Flow mode Constant
Initial flow 5.0 mL/min
Nominal init pressure 3.78 psi
Average velocity 37 cm/s
Outlet pressure Ambient
An HP-5MS (5% phenylmethylsiloxane) fused silica capillary column (J&W Scientific Inc., Folsom, CA) was used for the GC when using NPD as detector.
NPD parameters
DETECTOR Optimum conditions
Nature NPD
Temperature 300 ºC
Hydrogen flow 3.0 mL/min
Air flow 60.0 mL/min
Flow mode Constant
Makeup flow 15.0 mL/min
Makeup gas type Nitrogen
Adjust offset 30.00
Electrometer ON
Bead ON
Equilibration time 5.00 min
Identification and quantification of 2-AP
GC retention indexes on HP-5MS columns were calculated and compared with those of the synthetic 2-AP, and enabled us to positively identify 2-AP. Each sample was analyzed in triplicates.
For quantification of 2-AP, a standard curve was constructed from a concentration series of 2-AP (0.02 to 8 µg/g) prepared in benzyl alcohol and subjected to SHS-GC/NPD analysis under conditions identical to those described above. A non-fragrant rice (Pijit) was used as supporting material in the calibration procedure. It was obtained from the Department of Agronomy of Chiang Mai University in Thailand.
Non-fragrant rice size (g) Synthetic 2-AP (µg) Synthetic 2-AP/rice size (µg/g) 2,6-DMP Area Synthetic 2-AP/rice size area 1 0.02 0.02 3800.2 22.4 1 0.05 0.05 3890.9 42.0 1 0.10 0.10 3802.8 86.9 1 0.80 0.80 3913.2 566.6 1 1.60 1.60 3863.8 1091.6 1 2.40 2.40 3569.2 1408.8 1 3.20 3.20 3745.1 2085.1 1 4.00 4.00 3709.2 2505.2 1 6.00 6.00 3472.8 3580.0 1 8.00 8.00 3404.5 4616.9
Plot of concentrations of standard 2-AP (synthetic 2-AP/rice powder size in µg/g) against the corresponding peak areas (synthetic 2-AP/rice size area) divided by peak area of the internal standard (2,6-DMP area) yielded a linear calibration curve (Appendix 1) from which the 2-AP content in the samples was derived. The average concentration of 2-AP was expressed as a weight ratio per dry matter of the rice (µg/g).
2.4 Extraction and quantification of lipid degradation volatile and
non-volatiles products
2.4.1 Static headspace (SHS-GC/FID) analysis of lipid oxidation volatiles
Principle
The deterioration of rice lipids involves autoxidation of unsaturated fatty acids. These oxidative reactions result in the formation of monohydroperoxides, which eventually break down into a variety of products, some of which are volatile. The products include
aldehydes, ketones, alcohols, furanones, acids, lactones, and hydrocarbons. For extraction and semi-quantification of lipid oxidation volatiles, the headspace procedure and conditions were designed to identify a wide range of compounds of interest. Instead of a nitrogen phosphorous detector, a flame ionization detector (FID) was used (Figure 2.8).
Figure 2.8 Schematic of a Flame Ionization Detector (FID).
As the name suggests, FID analysis involves the detection of ions. The source of these ions is a small hydrogen-air flame producing at high temperature positively charged ions and electrons. In order to detect these ions, two electrodes are used to provide a potential difference. The positive elementary doubles as the nozzle head where the flame is produced. The other, negative electrode is positioned above the flame. The ions thus are attracted to the collector plate (negative electrode) and upon hitting the plate, induce a current. This current is measured with a high-impedance pico-ammeter and fed into an integrator.
Rice samples preparation
Paddy grains were sun-dried, dehulled, and milled in the laboratory to remove approximately 15% bran. Only brown rice samples were used for the analysis. The rice
samples were chilled at 4 ºC for 24 h before they were ground (Moulinex, Cean, France)
into a powder (less than 0.3 mm in diameter) and used immediately. Rice powder weighted exactly 3.0 g was placed into a 20 mL headspace vial, followed by the addition of 5.0 µL of 2,6-DMP in benzyl alcohol. The headspace vial was sealed immediately with a PTFE/silicone septum and aluminum crimp cap (Restek Corp., Bellefonte, PA), prior to analysis by SHS-GC/FID.
Sample preparation Optimum conditions
Brown rice powder size 3.0 g
Vial size 20 mL
Internal standard (2,6-DMP 0.5 mg/L) 5 µL
Headspace autosampler conditions
SHS/GC analyses were carried out using an Agilent 6890N GC model equipped with a G1888 headspace autosampler, both from Agilent Technologies (Wilmington, DE). Data acquisition and evaluation were accomplished using an Agilent ChemStation software A.01.04 and B.01.03. The headspace autosampler conditions were as follows:
Headspace parameters Optimum conditions
Extractions per vial 1
Oven stabilization time 1.0 min
GC cycle time 30.0 min
Injection time 0.40 min
Injection volume 1.00 µL
Syringe size 10.0µL
Loop equilibration time 0.60 min
Loop filling time 0.01 min
Loop temperature 130 ºC
Oven temperature 120 ºC
Shake High shaking
Transfer line temperature 140 ºC
Vial equilibration time 9.0 min
Vial pressurization time 0.10 min
Sample loop 3 mL
Gas chromatography analysis
Sample headspace was collected through a 3 mL sample loop and automatically transferred to the GC via a heated transfer line with the following parameters:
Oven parameters
OVEN Optimum conditions
Maximum temperature 280 °C
Equilibration time 0.10 min
Initial temperature 50 ºC for 0 min
Ramp 5 °C/min to 200 °C
Final temperature 225 °C for 3 min
Inlet parameters
INLET Optimum conditions
Mode Splitless
Equilibration time 0.00 min
Initial temperature 230 ºC
Pressure 22.07 psi
Purge flow 29.6 mL/min
Purge time 0.50 min
Total flow 35.4 mL/min
Saver flow 20.0 mL/min
Saver time 2.00 min
Gas type Helium OFF
Column parameters
COLUMN Optimum conditions
Column type Capillary HP-5MS
Column characteristics Agilent 19091J-216
Maximum temperature 325 ºC
Nominal length 60.0 m
Nominal diameter 320.00 µm
Nominal film thickness 1.00 µm
Flow mode Constant
Initial flow 3.0 mL/min
Nominal init pressure 22.05 psi
Average velocity 37 cm/s
Outlet pressure Ambient
FID parameters
DETECTOR Optimum conditions
Nature FID
Temperature 250 ºC
Hydrogen flow 30.0 mL/min
Air flow 300.0 mL/min
Flow mode Constant
Makeup flow 10.0 mL/min
Makeup gas type Nitrogen
Lit offset 2.0
Electrometer ON
Flame ON
Signal data rate 20 Hz
An HP-5MS (5% phenylmethylsiloxane) fused silica capillary column (J&W Scientific Inc., Folsom, CA) was used and each sample was analyzed in triplicate.
Choice of standard lipid-derived products
A reference mixture consisting of a known amount of the standard volatile compounds and internal standard (2,6-DMP) was also subjected to the SHS-GC/FID analysis. The choice of standard compounds was based on the major lipid-derived compounds previously identified in rice and covered a wide range of alcohols and aldehydes.
Volatile identification
Rice sample volatiles were identified by their GC retention times relative to those of standards run under the same conditions, and by comparison of the retention indices (RI) with the literature data. RI of the analytes of interest were calculated based on the linear temperature programme retention index (LTPRI) method, using the mixture of alkanes
C8–C20 (concentration 40 mg/mL in hexane) as retention index probs (Fluka, Buchs,
Switzerland). RI probes were loaded onto the headspace vial prior to the sample extraction and the Kovats index was calculated by the equation:
log(tr(unknown)) – log(tr(n))
RI = 100 × [n + (N – n) ---] log(tr(N)) – log(tr(n))
where RI = Kovats retention index; n = the number of carbon atoms in the smaller alkane;
N = the number of carbon atoms in the larger alkane; tr = the adjusted retention time.
Expression of the relative concentration
The concentration of the volatile components was calculated using the response factor determined for each volatile compound. To obtain recovery factors for individual volatile components, a reference mixture consisting of a known amount of the standard volatile compounds and internal standard (2,6-DMP) was subjected to SHS-GC/FID analysis. The relative recovery factor of compounds of interest was determined relative to the internal standard:
Compound area (extract) × 2,6-DMP area (direct injection) Recovery factor = ---
Peak areas were obtained with the aid of the instrument’s digital integrator and the concentration expressed as:
Compound area × 2,6-DMP concentration (ng/µL) × Injection volume (µL) Concentration (ng/g) = ---
2,6-DMP area × Rice sample weight (g) × Recovery factor
The results were expressed as the average of three replicates of each rice cultivar with most of the components showing satisfactory recoveries ranging from 0.9 to 1.0.
2.4.2 Determination of malondialdehyde (MDA) content
Principle
Lipid peroxidation has been established as a major mechanism of cellular injury in many biological systems of plant and animal origin. The mechanism involves a process whereby unsaturated lipids are oxidized to form additional radical species as well as toxic by-products that can be harmful to the host system. Polyunsaturated lipids are especially susceptible to this type of damage when in an oxidizing environment and they can react to form lipid peroxides. Lipid peroxides are themselves unstable, and undergo additional decomposition to form a complex series of compounds including reactive carbonyl compounds. Polyunsaturated fatty acid peroxides further react to form malondialdehyde (MDA). MDA can be found in most biological samples as a result of lipid peroxidation, and has become one of the most widely reported analytes for the purpose of estimating oxidative stress effects on lipids. In our study, MDA content was measured as an additional lipid peroxidation marker in growing rice grains. The assay is based on the reaction of
MDA with thiobarbituric acid (TBA), forming a MDA-TBA2 adduct (white color for
grains and orange color for leaves) that absorbs strongly at 532 nm.
Chemicals
Extraction buffer: 0.05 M potassium phosphate buffer, pH 7.8 (checked with a Mettler Toledo Delta 320 pH, Mettler Toledo Inc; Columbus, USA); 1% insoluble polyvinylpolypyrrolidone (PVPP).
Reagents: 0.5% thiobarbituric acid (TBA) (light yellow; not to be refrigerated; stable at least one week; and dissolved with heating).
Harvesting and extraction of MDA from samples
Two panicles and 10 flag leaves from the centre four rows of paddy plots were selected and transported to the laboratory under dry ice. Fresh rice grains were separated by shaking and immediately dehulled by hands. The midrid and petioles of leaves were discarded. Cooled tissues (three samples of approximately 0.2 g fresh weight per treatment) were then ground to a fine powder in a chilled mortar and pestle, in the presence of 0.3 g washed quartz sand, and then homogenized for 1 min in 3 mL of extraction buffer. All operations were carried out at 4 °C. The homogenates were centrifuged at 20,000 × g for 15 min at 4 °C (Hema TGL-16 R refrigerated centrifuge, Shanghai, P.R China), and the white supernatant fraction kept at 4 °C in a Haier BCD 195K refrigerator (Haier, Qingdao, P.R China) until analysis.
MDA colorimetric assay
The method used was modified from the one proposed by Buege and Aust (1978). The total volume of reaction mixture of 3.5 mL was heated in a KW-1000 DA boiling
water bath (Guangzhou Sinosource co., Ltd, Guangzhou, P.R China) for 20 min at 100 ºC
and allowed to cool rapidly in an ice bath (development of a light white color with the grains and an orange color with the leaves). The assay mixture consisted of the following:
Reagent Assay Blank
0.5% TBA (mL) 2.5 2.5
Supernatant (mL) 1.0 0.0
0.05 M Phosphate buffer pH 7.8 (mL) 0.0 1.0
Heating in a boiling water bath at 100 ºC for 20 min
Centrifugation at 10,000 × g for 10 min
Spectrophotometric determination at 532, 600, and 450 nm
After a second centrifugation at 10,000 × g for 10 min, and at 25 ºC (HIMAC
centrifuge, Hitachi SCR20BC, Japan), the resulting supernatant was incubated at room temperature for 5 min, and was used for spectrophotometric determination of MDA using a Shimadzu UV-2450 spectrophotometer (Tokyo, Japan). Absorbance at 532 nm (representing the maximum absorbance of the TBA-MDA complex) was recorded and corrected for non specific turbidity at 600 nm and interference generated by TBA-sugar complexes at 450 nm. MDA concentrations were calculated by means of an extinction
coefficient of 156/mM/cm and expressed in µmol/g fresh weight using the equation:
Extraction volume (mL) × [6.45 × (OD532 – OD600) – 0.56 × OD450] MDA content (µmol/g) = ---
Sample weight (g) × Supernatant volume (mL)
2.5 Sensory evaluation protocol
For sensory analysis, 2 trained panelists and 12 untrained students were selected. The profile used by the panelists included only one attribute that described rice odor of brown rice powder and of cooked milled rice. Three samples were chosen for each treatment and each sample was exposed to the panelists twice.
2.5.1 Sniffing test for warmed brown rice powder
In the first test, a portion of brown rice powder weighted exactly 20.0 g was placed in a 27-mL bottle and sealed with an aluminum cap. Cooking without water was carried out
in an Autotherm heater (Walnut Creek, CA) with agitation for 20 minutes at 80 ºC. The
warm cooked rice powder was filled into sniffing bottles presented to the panelists who were required to smell and tell which of the samples has the most intense odor.
2.5.2 Hedonic text for cooked milled rice
In the second test, portions of milled rice were rinsed, and then cooked using a QLT-3651 rice cooker (Taiwan Quality Group CO., Taiwan) with a rice:water ratio of 1:2. The amount of time the red light of the cooker was on was considered as the cooking time. After cooking, samples were held for 10 min in the cooker before testing. The aroma intensities of all rice samples were rated on a hedonic scale of 5 points as shown below.
Score Description
0 non-aromatic
1 subtle aromatic
2 clearly aromatic but not as strong as Guixiangzhan/Peizaruanxiang
3 aromatic and strong as Guixiangzhan/Peizaruanxiang
4 more aromatic than Guixiangzhan/Peizaruanxiang
The reference samples of Guixiangzhan and Peizaruanxiang grown without growth regulators were presented to the panelists before test, and the two cultivars were tested in different sessions.
2.6 Yield and yield components evaluation
Yield and yield components were estimated as outlined by Yang et al. (2007). The following attributes were taken into consideration:
2.6.1 Number of panicles per hill
Tillers were counted and separated into panicle bearing and non-bearing plants. Panicle stand counts of each hill were taken at physiological maturity by counting the number of effective tillers (main stems) in the centre two rows from an area 2.8 m in length in each plot. Twenty hills were chosen the result recorded as panicle number per hill using the formula:
Effective tillers for hill 1 +…Effective tillers for hill 20 Number of panicles/Hill = --- 20
2.6.2 Number of spikelets per panicle
All panicles of two hills were collected and hand threshed in the laboratory. The total number of spikelets was counted and recorded as the total number of spikelets per panicle:
Spikelet number for hill 1 + Spikelet number for hill 2 Number of spikelets/Panicle = ---
Number of panicle per hill × 2
Filled spikelets were later separated from unfilled spikelets by submerging them in tap water. Filled spikelets were taken to count the number of ripened spikelets per panicle.
Number of ripened spikelets/Panicle = Total spikelets per panicle – Unfilled spikelets
2.6.3 Grain-filling percentage
Grain-filling percentage was calculated according to the formula:
Ripened spikelet number
Grain-filling percentage (%) = --- × 100
2.6.4 Weight of 1000-grains rough rice
Panicles were threshed to separate seeds. The separated seed were weighed, and the resulting 1000-seeds weight recorded using a Sartorius BT 124S scale (Sartorius scientific instruments, Beijing, P.R China).
2.6.5 Average grain yield
Grain yield was determined from the 5-m2 area in each plot and collected by
harvesting the center four rows with a small plot combine (200 hills in total). Yield samples from the 200 hills were weighed and adjusted to the standard moisture content of 12-14%. The moisture content of the paddy at maturity was determined by the standard oven method. Approximately 5 g of rice grain was accurately weighed into a moisture dish. The sample was dried in a vacuum oven (Bluepard DHG-9240A, Shanghai, P.R China) at 70 °C until a constant weight was reached. The dishes were taken from the oven and cooled for 10 min in a desiccator. The moisture content was calculated as a percentage with the weight lost corresponding to moisture lost using the equation:
Weight sample before drying (g) – Weight sample after drying (g) Moisture content (%) = --- × 100
Weight sample before drying (g)
After a constant weight was attained, the average grain yield was calculated using the
following formula in which “10” represents the conversion factor from kg/m2
to t/ha:
Total hills per plot x Yield of selected hills (kg)
Yield (t/ha) = --- × 10
Number of hills selected x Plot area (m2)
2.7 Milling quality evaluation
The milling quality of rice may be defined as the ability of rice grain to stand milling and polishing without undue breakage so as to yield the greatest amount of total recovery and the highest proportion of head rice to broken (Juliano and Villareal, 1993). The milling process generally consists of five fundamental operations which are (1) cleaning the rough rice to remove leaves, rice stems and other foreign matter, (2) shelling or dehulling the cleaned rice to remove the hulls and form the brown rice (3) cleaning the brown rice to remove hulls not totally removed by dehulling (4) milling or polishing the brown rice to
remove the bran and produce milled rice, and (5) separating whole grains from broken kernels. Prior to milling and in order to prevent deterioration after harvest, paddy is usually dried down to a level of water activity that will enable safe storage by reducing respiration, inhibiting mould growth and preventing production of mycotoxins. This corresponds to a moisture content of about 12-14%, which is considered adequate for safe storage, milling and further storage as milled rice. In our case, samples of Guixiangzhan and Peizaruanxiang were threshed and sun-dried to about 14% moisture content for two weeks. Seeds of each cultivar for individual plots were then packaged, labelled and stored for 3 months at ambient temperature before processing to ensure stable milling yields.
2.7.1 Brown rice rate
Duplicate 80-g rough rice samples for each plot were dehulled with a SDL-A type testing husker, model JY7134 (Shanghai, P.R. China). First, the roller distance of the dehusking machine was adjusted to 0.90 mm and this for the two cultivars. The samples were then poured into the hopper with two passes per sample. The weight of the cleaned brown rice as well as the weight of the remaining rough rice (hulled samples) was recorded. Average brown rice rate was calculated from three replications of each treatment using the formula:
Weight of brown rice (g)
Brown rice rate (%) = --- × 100 Weight of original rough rice (g) – Weight of remaining rough rice (g)
2.7.2 Milled rice rate
A representative sample (40 g) of the brown rice obtained as described above was then polished by an abrasive JNMJ-6 type polisher (Guangzhou, P.R. China) with the 680 g added weight on the pressure cover for 50 sec, followed by 20 sec without the added weight, to obtain a typical degree of polish of c. 8%. The fraction removed was considered bran in the first milling and that after the second milling, polish. All samples were replicated three times. The milled rice sample was collected in a jar or thick paper bag and sealed immediately. The weight of the cleaned polished rice was recorded. Milled rice yield was expressed as the percentage ratio of milled rice after husking and polishing, to the weight of unmilled paddy (brown rice).
Weight of total milled rice (g)
Milled rice rate (%) = --- --- × 100