Collecting and
processing geographic
coverage information
of mobile networks
José Miguel de Carvalho Branco Maia
Mestrado Integrado de Engenharia de Redes e Sistemas Informáticos
Departamento de Ciência de Computadores 2015
Orientador
Sérgio Crisóstomo, Professor Auxiliar,
Faculdade de Ciências da Universidade do Porto
Coorientador
Rui Prior, Professor Auxiliar,
Todas as correções determinadas pelo júri, e só essas, foram efetuadas.
O Presidente do Júri,
Thanks to all my friends throughout all these years who have done their part to make me who I am.
Thanks to my family, for always being there.
Thanks to my supervisors, Professor Rui Prior and Professor Sérgio Crisóstomo, for giving me the opportunity to work with them and to learn from them.
Obrigado, Muchas gracias, Merci Bien, Tudo é Kanimambo (João Maria Tudela)
Abstract
Over the last two decades, we have seen an exponential growth in the use of mobile phones. This growth was accompanied by a change in their usage pattern — the access to data services has overtaken voice calling, which was the almost exclusive use of mobile phones. It was also accompanied by a change in the devices themselves, with the market shifting to smartphones.
The selection of a mobile service provider can be difficult for the end users, given the lack of unambiguous, accurate and independent information on coverage and quality of the wireless access, including voice and data, with every provider claiming their particular signal quality, network speed and/or pricing is the best.
This motivated us to develop a service for measuring mobile network parameters using Android smartphones, and display the data, adequately processed, to the users in a mapping application. The service is based on crowdsourcing, an attractive approach due to the pervasiveness of smartphones equipped with both cellular and Wi-Fi hardware and with Global Positioning System (GPS) receivers that allow us to associate obtained measurements with its geographical locations. Users worldwide can contribute to the database, increasing the availability and the quality of the data, obtained independently from the service providers.
We adopted a client/server architecture for the service, based on three main components: a mobile client application that obtains data from the devices, a server that receives that data and processes it, and a web application that displays the processed data to the end-user.
In this work we describe the service and its different components and discuss our solutions to the technical problems that emerged during the design and implementation of the service.
Keywords: Cellular networks, WI-FI, monitoring, Mobile crowdsourcing, Android
Resumo
O papel dos dispositivos móveis na experiência do dia-a-dia da humanidade tem vindo a crescer exponencialmente ao longo das últimas duas décadas — o acesso a serviços de voz, anteriormente, o principal uso dos telefones móveis, foi ultrapassado pelo acesso a serviços de dados. Este crescimento também foi acompanhado por alterações nos dispositivos em si, com o mercado a evoluir para smartphones.
A seleção de um provedor de serviços móveis pode ser difícil para o utilizador final, dada a falta de informação independente, precisa e não ambígua sobre a cobertura e qualidade do acesso sem fios, incluindo voz e dados, uma vez que cada provedor alega ter a melhor qualidade de sinal, velocidade da rede e/ou preço.
Isto motivou o nosso desenvolvimento de uma aplicação que possa medir parâmetros das redes móveis em smartphones Android e mostrar esses dados, adequadamente processados, aos utilizadores, através de um mapa. O serviço é baseado em crowdsourcing, uma hipótese atrativa, dado a disseminação de smartphones equipados com hardware celular e Wi-Fi e com recetores GPS que nos permitam associar medições à localização geográfica onde foram obtidas. Utilizadores por todo o mundo podem contribuir para a base de dados, aumentando a disponibilidade e qualidade dos dados, que serão obtidos de forma independente dos provedores de serviços.
Adotámos uma arquitetura cliente/servidor para o serviço, baseada em três principais componentes: uma aplicação móvel (o cliente) que obtém dados dos dispositivos móveis, um servidor que recebe esses dados e processa-os, e uma aplicação web que mostra os dados processados ao utilizador final.
Neste trabalho descrevemos o serviço e os seus diferentes componentes e discutimos as nossas soluções para os problemas técnicos que surgiram durante o desenho e implementação do serviço.
Palavras-chave: Redes celulares, WI-FI, monitorização, crowdsourcing móvel, Android
Contents
Abstract iii
Resumo v
List of Tables xi
List of Figures xiv
Listings xv Acronyms xviii 1 Introduction 1 1.1 Objectives . . . 3 1.2 Structure . . . 4 2 Background 5 2.1 Network technology parameters . . . 5
2.1.1 Cellular network parameters . . . 5
2.1.2 Wi-Fi technology parameters . . . 10
2.2 Alternative ways to collect data . . . 12
2.3 Measurement techniques . . . 14 vii
2.4 Existing applications . . . 17 2.4.1 Sensorly . . . 18 2.4.2 OpenSignal . . . 18 2.4.3 4gmark . . . 18 2.4.4 Rootmetrics . . . 19 2.4.5 Netradar . . . 19 2.4.6 Ookla Speedtest . . . 19 2.4.7 MobiPerf . . . 19 2.4.8 Mozstumbler . . . 20 2.4.9 Global comparison . . . 20 2.5 Chapter Summary . . . 21 3 Design 23 3.1 Overview . . . 23
3.2 Mobile data collection . . . 24
3.2.1 Cellular measurements . . . 25 3.2.2 Wi-Fi measurements . . . 25 3.2.3 Other measurements . . . 26 3.3 Data processing . . . 26 3.3.1 Client-Server communication . . . 26 3.3.2 Database design . . . 27 3.3.3 Visualization processing . . . 29
3.3.4 External data import/export . . . 30
3.4 Data display . . . 31 viii
3.5 Chapter summary . . . 31
4 Implementation 33 4.1 Mobile data collection . . . 33
4.1.1 Generic data . . . 33 4.1.2 Cellular data . . . 35 4.1.3 Wi-Fi data . . . 38 4.1.4 Connection speed . . . 39 4.2 Data processing . . . 42 4.2.1 Client-server communication . . . 42 4.2.2 Visualization processing . . . 43 4.3 Data display . . . 44
4.3.1 Web server display . . . 45
4.3.2 Android-side display . . . 47
4.4 Chapter summary . . . 47
5 Discussion 49 5.1 Dedicated measurement hardware . . . 49
5.2 Mobile Operating System . . . 50
5.3 Mapping tools . . . 51 5.4 Geographical databases . . . 52 5.5 Backend Database . . . 54 5.6 Server-side technologies . . . 57 5.7 Geographical options . . . 57 5.8 Chapter Summary . . . 60 ix
6 Conclusion 61
Bibliography 63
A Mozilla Ichnaea import/export 71
B Data smoothing 75
C Application API description 77
List of Tables
2.1 A comparison of mobile network measuring applications. . . 21
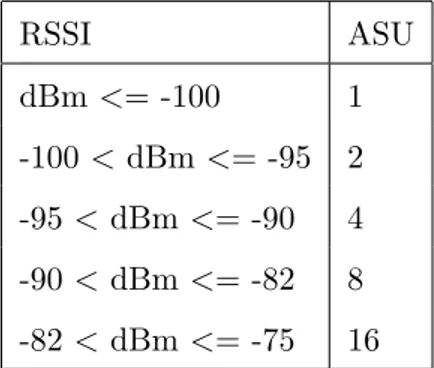
4.1 How to convert CDMA’s received signal strength from dBm to ASU . . . 36
4.2 Classification of signal strengths . . . 44
List of Figures
2.1 Diagram of Time Division Multiple Access’s structure, by Mozeratti via Wikimedia
Commmons (CC-BY-SA 3.0). . . 6
2.2 Cells in different location areas. . . 7
2.3 Graphical representation of 2.4 GHz band channels overlapping, by Michael Gauthier via Wikimedia Commons (CC-BY-SA 3.0). . . 11
2.4 The original Turk, represented in a copper engraving by Karl Gottlieb von Windisch, via Wikimedia Commons (public domain). . . 14
3.1 General overview of the structure of the planned system. . . 23
3.2 UML diagram representing synchronization of a single measurement. . . 27
3.3 Chen’s Entity-Relationship diagram representing our database. . . 28
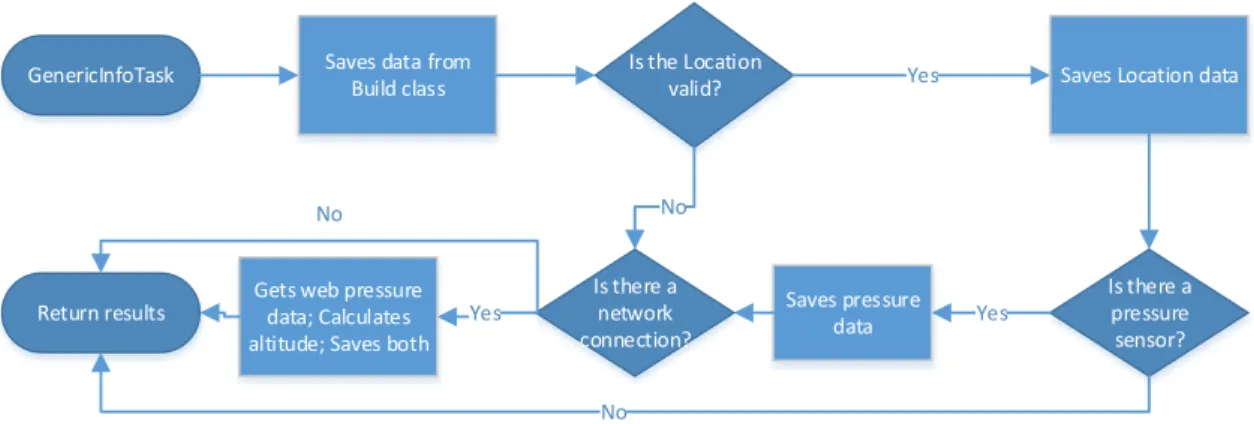
4.1 How the generic information is obtained via GenericInfoTask. . . 34
4.2 How the cell tower info is obtained . . . 37
4.3 How the Wi-Fi scans are performed . . . 38
4.4 List of Java applications on the server, including data processing and data display servlets, and data processing external components. . . 43
4.5 A sample of the grid cells map. . . 45
4.6 A sample of the cell tower map. . . 46 xiii
5.1 How close will a flight from Los Angeles to Paris come to Iceland, by Boundless
via Boundlessgeo.com (CC-BY-NC-SA 3.0). . . 55
5.2 What is the shortest route from Los Angeles to Tokyo, by Boundless via
Bound-lessgeo.com (CC-BY-NC-SA 3.0). . . 56
5.3 A version of the Lambert cylindrical equal-area projection, by Strebe via Wikimedia
Commons (CC-BY-SA 3.0). . . 58
5.4 An example of what a Lambert-projected grid square could look like compared to
a 500x500m square in Google Web Mercator. . . 59
Listings
4.1 Simplified excerpt of regular speedtest code’s main loop . . . 40
4.2 Simplified excerpt of torrent-based speedtest code’s main loop . . . 41
C.1 Complete description of the generic measurements’ fields. . . 77
C.2 Complete description of the Wi-Fi measurements’ fields. . . 78
C.3 Complete description of the cellular measurements’ fields. . . 79
Acronyms
2G Second generation mobile network
3G Third generation mobile network
4G Fourth generation mobile network
AJAX Asynchronous JavaScript and XML
API Application Programming Interface
ASU Arbitrary Signal Units
BID Billing Identification
BSSID Basic Service Set Identifier
BSS Basic Service Set
CCMP Counter Mode CBC-MAC Protocol
CDMA Code Division Multiple Access
CID Cell ID
CI Cell Identification
CSS Cascading Style Sheet
CSV Comma-separated Values
dBm Decibel-milliwatts
DBMS Database Management System
DNS Domain Name System
EAP Extensible Access Protocol
EDGE Enhanced Datarates for GSM
Evolution
ESS Extended Service Set
FDD Frequency Divided Duplexing
GIS Geographical Information System
GPL GNU General Public License
GPRS General Packet Radio Service
GPS Global Positioning System
GSM Global System for Mobile
Communications
HSDPA High-Speed Downlink Packet Access
HSPA High-Speed Packet Access
HSUPA High-Speed Uplink Packet Access
HTTP Hypertext Transfer Protocol
IBSS Independent Basic Service Set
IMSI International Mobile Subscriber
Identity
ISP Internet Service Provider
JSON JavaScript Object Notation
LAC Local Area Code
LTE Long Term Evolution
MAC Media Access Control
MBR Minimum Bounding Rectangle
MCC Mobile Country Code
MIMO Multiple Input Multiple Output
MLS Mozilla Location Services
MMS Multimedia Messaging Service
MNC Mobile Network Code
MVC Model-View-Controller
NID Network Identification Number
ORM Object-relational mapping
OSM OpenStreetMap
OS Operating System
PCI Physical Cell Identification
PSC Primary Scrambling Code
PSK Pre-Shared Key
QoS Quality of Service
RSCP Received Signal Code Power
RSRP Reference Signal Received Power
RSRQ Reference Signal Received Quality
RSSI Received Signal Strength Indicator
RTT Round-trip Time
SDBMS Spatial Database Management
System
SDR Software-Defined Radio
SID System Identification Number
SIM Subscriber Identity Module
SMS Short Message Service
SQL Structured Query Language
SSID Service Set Identifier
TAC Tracking Area Code
TCP Transmission Control Protocol
TKIP Temporal Key Integrity Protocol
UDP User Datagram Protocol
UMTS Universal Mobile
Telecommunications System
URL Uniform Resource Locator
USRP Universal Software Radio Peripheral
UTC Coordinated Universal Time
WEP Wired Equivalent Privacy
WGS World Geodetic System
WLAN Wireless Local Area Network
WPA Wireless Protected Access
WPS Wi-Fi Protected Setup
Chapter 1
Introduction
Mobile phones have gained an important place in our lives throughout the years, and as their usage grew, so did their data services. According to the Pew Research Center, as of January 2014, 90% of American adults have a cell phone, and 63% of adult cellular service subscribers use their phones to go online [1]. Additionally, one third of these cell Internet users mostly use
their phone to access the Internet.
In Portugal’s case, as of the third quarter of 2014, the penetration rate of cell phones (not considering unused mobile stations and other devices such as cellular internet modems) is 112.9 per 100 inhabitants - furthermore, out of 11 931 thousand mobile users who have potential access to mobile broadband services, 4 824 thousand (40%) have utilized Third generation mobile network (3G) or better services in the last month of the quarter [2].
The report also mentions that, gradually, less users have been claiming as the main reason to choose an operator the fact that people they contact are in that same operator, 7.2% down from last year. From this it can be deduced that people have started valuing other factors - such as packages with multiple services (including any combination from Internet, phone, television and mobile phone), the third main reason cited, at 6.3%.
Naturally, associated to this growth there is an increase in complaints: in the first quarter of 2014, the Portuguese communications regulator ANACOM’s most complained-about service was the mobile service [3].
Taking all of this into account, it is clear that the place of mobile networks is more important than it used to be and, therefore, it is necessary for experts to help people process the large
Chapter 1. Introduction
amount of information around them. Every mobile operator is going to look at the data they have and filter it so that they always appear to be the best choice - whether it’s 3G or Fourth generation mobile network (4G) access speed, signal strength, or coverage. Looking at the Portuguese case:
• MEO claims they have the best 4G coverage on their website [4]; • NOS also claims they have the best 4G coverage [5];
• Vodafone, however, doesn’t claim they have the best 4G coverage; instead, they claim best Second generation mobile network (2G) and 3G coverage [6], as well as the best 4G speed [7].
Consequently, an average user cannot be certain which choice is the best for him if he wants better coverage in his area, and that’s one of the motivations behind this project - enabling people to figure out, independently, which is the best network operator for them.
People can generally trust external analysis by market researchers or regulators, like the ANACOM data previously cited, but a more interesting alternative is the ability to give power
to the people via crowdsourcing information, to allow them to collect data from real, every-day
usage phones that reflects real use cases, and to measure the speed and signal strength they have on those phones, so that the data is processed and made available to everyone interested.
On top of that, advantage can be taken of the fact that mobile data needs to be collected to analyze an area that’s also directly related to mobile networks, which is Wi-Fi. Even without resorting to hard data, it is easy to tell how popular public Wi-Fi is, just by walking into an average restaurant or café in a big city and seeing just how frequent it is that they have a sign posted somewhere with their Wi-Fi password.
Cisco claims [8] that 70% of mobile users are now using public hotspots, with 57% of those users accessing one at least weekly. Furthermore, while e-mail is the primary communications application used, for 53% of smartphone users, web browsing is the most popular activity in general, for 55% of those users.
It’s also important to consider some particular public Wi-Fi networks, such as the international eduroam Wi-Fi network, which is available in 54 countries and allows students, researchers and staff from participating institutions to obtain Internet connectivity not only across campus, but also across the other participating institutions [9]; or the FON access sharing system, which
3 FCUP
1.1. Objectives
allows users to share (part of) their network with the public and thereby obtain access to the Internet of other FON users around the world (often with partnerships with a preexisting Internet Service Provider (ISP)) [10].
If the capabilities of smartphone networks are being measured, it seems that Wi-Fi cannot be dissociated from the cell networks - they are complementary, and advantage should be taken of the fact one is being researched to also research the other.
In this project, a system that provides these capabilities is proposed and tested. The data is obtained through an Android smartphone application that measures a number of factors (to be detailed later on in this dissertation) and sends that information to a centralized server, which processes that data and makes parts of it available for public consumption, notably in the form of a web application which represents on a map the mobile coverage information.
1.1
Objectives
The main objective is to develop an application that can collect data from mobile cellular and Wi-Fi networks. From that main objective, the secondary objectives and the requirements of the application can be derived.
Firstly, the application must be able to obtain data relating to the device’s Wi-Fi and cellular hardware. The data should be collected, either actively or passively, by it, and stored locally until it can be moved to a server.
The second objective is to be able to move that data from the local storage to a server, and use the server’s processing power to collate the data and perform basic analysis on it, such as geographic aggregation.
Finally, the third objective is for the server to be able to display the processed data to the users in an understandable way, since reading raw data is not easy.
Furthermore, we defined a few requirements that it should also fulfill, secondary to those objectives:
• Making sure the application is transparent: An important goal to keep in mind is the necessity to make the application transparent: whether the source code is publicly available or not, a user needs to be aware of exactly what is being collected and sent - there
Chapter 1. Introduction
should be a way, from the mobile device, to see the data that will be sent to the server. • Collecting as much data as we can, even though we may not need it: Since the
users’ battery (and time, and goodwill) are already being used, it follows that all the data that may be relevant should be collected. Even if there is no immediate use for it, there is always the potential to keep it in the database for possible future queries.
• Displaying the data in an easy-to-read way via a mapping web app: As previously mentioned, it will be necessary to implement a more high-level way to view the data than directly: a web application that shows some form of processed data overlaid on a real world map is the one chosen, as it allows users to get a lot of information at a glance.
• Guaranteeing that the web app runs well on mobile browsers: A secondary requirement when designing the web application is to make sure it works well on a mobile browser, as users may want to see the map directly from within our mobile application -even outside of that, the previously mentioned Internet navigation patterns that have more and more people using smartphones for access need to be considered.
• Granting users alternate methods to access the data: Finally, it is a good idea to guarantee that the map is not the only way to get data. A possible solution would be to have (part of) the same Application Programming Interface (API) used for the web app to obtain its data available to the public, so that people can query the server in a less abstracted fashion (though not with direct queries to the database).
1.2
Structure
The rest of this dissertation is structured along the following lines: Chapter 2 describes the existing solutions for the problems treated. Chapter 3 has the details on the architectural considerations of this work, while Chapter 4 discusses the actual problems and details of the implementation of that architecture; Chapter 5 is an analysis of the technologies used to accomplish the proposed goals, as well as other issues where a decision had to be made from multiple options; Chapter 6 presents the main conclusions and results of the project.
Chapter 2
Background
The commonplace use of mobile Internet and, specifically, smart devices, makes them a frequent focus of research. This chapter describes various ways of obtaining data of interest to this project, and gives examples of already existing software in the area. It also explains some of the basic terms that will be repeatedly used throughout the dissertation, such as the different network technology parameters.
2.1
Network technology parameters
We are interested in collecting as much information as possible, even if we will not use it all immediately, therefore, a careful study of what parameters are available to be measured both on the cellular network and on the Wi-Fi network side of things is necessary.
2.1.1 Cellular network parameters
This work focuses on four particular technologies, as they are the most common, and the ones explicitly differentiated by Android in their API: Global System for Mobile Communications (GSM) (considered a 2G technology [11]), Code Division Multiple Access (CDMA) (both 2G and 3G, with CDMA2000), Universal Mobile Telecommunications System (UMTS) (3G) and Long Term Evolution (LTE) (4G).
GSM is a standard, developed in Europe, that established itself in the beginning of the 1990s, and is still the most widely used technology around the world [12, Chap. 1]. It forms the basis
Chapter 2. Background
for many of the subsequent technologies, such as UMTS and LTE, and is still actively developed to this day, despite its age.
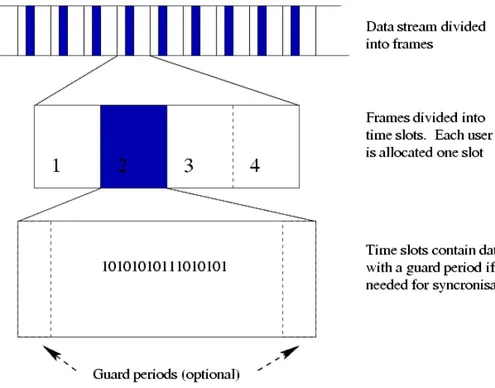
GSM subscribers are identified by their International Mobile Subscriber Identity (IMSI), an internationally unique number that is stored in a physical Subscriber Identity Module (SIM) card. This IMSI includes two sections that store information about the subscriber’s network -the Mobile Country Code (MCC) and Mobile Network Code (MNC), and -the rest of -the number uniquely identifies a user within that network. As the IMSI is internationally unique, it enables the subscriber to utilize their phone abroad, if there is a GSM operator that has an agreement with theirs. GSM frequency bands are very disparate, as the original assigned bandwidth was too small initially (25 MHz) to match growing demand; furthermore, when the technology expanded to North America, the frequency bands used in Europe were already in use by other systems, making the regulators open frequency bands in different frequencies, which made it so that many North American phones could not be used in Europe, and vice versa. The way GSM separates its users is by simultaneously dividing the possible channels into multiple slots both at a frequency and a time level - a user is assigned one of eight timeslots on a specific frequency, similarly to Figure 2.1 [12, Chap. 3.2].
Figure 2.1: Diagram of Time Division Multiple Access’s structure, by Mozeratti via Wikimedia Commmons (CC-BY-SA 3.0).
7 FCUP
2.1. Network technology parameters
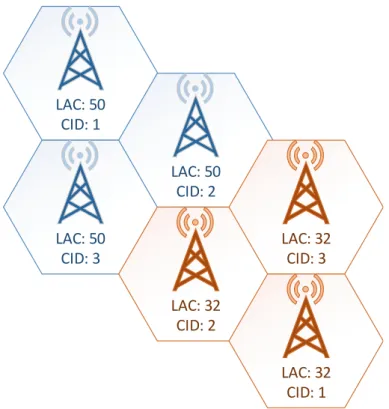
for the communication containing this information to be reduced, as to save power consumption and signaling load on the network. GSM solves this by grouping its cells in what is called location areas - usually, 20 to 30 cells have the same Local Area Code (LAC), and the mobile device does not need to signal the network its new location if it is within the same location area.
Figure 2.2 shows a sample of a GSM cell network - in this case, if a device moved from the area identified by the LAC of 50 and Cell ID (CID) of 1 to the area identified by LAC 50/CID 2, it would not require a location update, but one would be necessary from that area to the one covered by the tower identified by LAC 32/CID 2.
LAC: 50 CID: 1 LAC: 50 CID: 3 LAC: 50 CID: 2 LAC: 32 CID: 2 LAC: 32 CID: 3 LAC: 32 CID: 1
Figure 2.2: Cells in different location areas.
One of GSM’s weaknesses is that it was designed for a time where voice calls were the most important service, hence, it was optimized for voice transmission [12, Chap. 2]. However, considering that the importance of the Internet has been increasing since its creation, multiple technologies were developed to enhance the GSM standard and allow it to transport data in an efficient manner - first General Packet Radio Service (GPRS) and later Enhanced Datarates for GSM Evolution (EDGE). Their primary difference is that they function via packet-switching (collecting data in packets before it is sent over the network), as opposed to GSM’s
Chapter 2. Background
The successor to GSM and GPRS was UMTS, a 3G system designed to combine packet-switching for data and circuit-packet-switching for voice, reusing many of GSM’s systems [12, Chap. 3]. Compared to GSM, UMTS’s major improvement in terms of user access is that it replaces GSM’s separation of users by frequencies and timeslots by the assignment of a unique code, which, combined with carrier bandwidth increases, allowed much faster data transfers than were previously possible. UMTS has also had improvements throughout the years, such as the introduction of High-Speed Downlink Packet Access (HSDPA) and High-Speed Uplink Packet Access (HSUPA), commonly referred to together as High-Speed Packet Access (HSPA).
Thanks to the code division, frequencies of cells in the same area are often the same in UMTS, this causing the mobile device to require the Primary Scrambling Code (PSC) of all cells it can detect, in order to read their identifying information and decide whether or not it is worth it to switch over to those neighbouring cells - a process called cell reselection.
The following evolution of these designs is LTE [12, Chap. 4], which implements an entirely new air interface - while UMTS spreads one signal over the complete carrier bandwidth, LTE transmits the data via many narrowband carriers, splitting the data into many slow data streams that are transmitted simultaneously. This makes the data rate it provides comparable to UMTS, but reduces multipath fading - the effect caused by radio waves bouncing off objects on the way from the transmitter to the receiver, making the receiver get multiple copies of the same signal, arriving at different times. Combined with forcing every LTE device to support Multiple Input Multiple Output (MIMO) transmissions, which allow the transmission of multiple data streams simultaneously, the data rates are beyond those that can be achieved in previous technologies. LTE supports both frequency division (LTE-FDD) and time division (LTE-TDD), although Frequency Divided Duplexing (FDD) is the more common of the two - in the case of time division, an important parameter is timing advance, a value also used by GSM in order to avoid overlapping when communicating in a timeslot-separated channel [12, pp. 34, 226].
LTE isn’t just a successor to GSM/UMTS, it’s also a successor to CDMA technologies. IS-95A, also referred to as CDMAOne, was a voice-centric 2G network designed in the 1990s as an alternative to GSM [12, Chap. 3.14]. Like GSM, it is circuit-switched, and it was the most common 2G network type in North America. CDMAOne also has a 3G evolution which parallels the relationship between GSM and UMTS - CDMA2000, which was developed in parallel to UMTS and is still the most common 3G technology in North America; however, further enhancements of the CDMA standard were discarded in favor of LTE, which made it
9 FCUP
2.1. Network technology parameters
so that LTE had to be backwards compatible not only with UMTS, but also with the latest versions of CDMA.
Depending on the technology used, the way individual cell towers are identified varies: [13]: In GSM (and UMTS), the parameters are MCC, MNC, and LAC, while in CDMA, they are System Identification Number (SID), Network Identification Number (NID), and Billing Identification (BID). However, in terms of functionality, they are similar, as, for the same tower,
the BID or CID are typically related numerically, in groups of three, each covering an 120o sector,
with the sector number 1 representing North, and 2 and 3 clockwise rotations. In the case of omni-directional antennae, the sector number 0 may be used. The way these sector numbers are used, however, varies - in GSM/UMTS’s case, the most common positions to include the number are either the CID’s fifth digit from the right (e.g. tens of thousands) or the last digit; in CDMA, since the BID is treated as a hexadecimal number, it may be the least significant digit
(e.g. 444116, 444216, 444316) or the third hexadecimal digit from the right, so as to separate
related stations by 25610 (e.g. 414416, 424416, 434416).
In the case of LTE, however, the unique IDs are different fields, the Tracking Area Code (TAC), Cell Identification (CI) and Physical Cell Identification (PCI). PCI is the least useful of the three for unique identification, as it may be reassigned to avoid interference, although we can obtain from it the sector number, after dividing the PCI by three and adding one to the remainder. CI is a 28 bit number, where the first 20 bits are the eNodeB number, and the last eight are the aforementioned sector number. The last two digits, when expressed hexadecimally, represent a particular antenna in a group, and are attributed in a similar way to the GSM/CDMA systems mentioned above. The TAC can also be used for regional identification purposes - [13] mentions the case of Verizon Wireless utilizing the low order 8 bits of the TAC to encode a super region covering a small state or a large city; in this case, they also encode this super region in the
eNodeB number in the CI, where dividing eNodeB by 100010 returns the super region part of
the TAC. This partial redundancy of LTE’s identification may be used to reject invalid base station IDs that can occur through inaccurate decoding or through asynchronous updating of the components of the antenna’s ID in the mobile device’s telephony software.
After the identification parameters, another very important parameter - perhaps the most important, from a user perspective - is signal strength. The signal strength values are typically expressed in Decibel-milliwatts (dBm) (logarithmic scale). As in the last case, each technology has their particularities, but the values used are often common to several of them [12]:
Chapter 2. Background
• Received Signal Strength Indicator (RSSI) represents the total signal power received in milliwatts. Used in all the network types.
• Received Signal Code Power (RSCP) is the power the pilot channel of a base station is received with. Exclusive to UMTS.
• Reference Signal Received Power (RSRP) is the LTE-exclusive parameter used for deciding whether to perform operations such as handover or cell reselection.
• Reference Signal Received Quality (RSRQ), also LTE-exclusive, is the RSRP divided by the RSSI, and the better this value, the better the signal of the cell can be received compared to the interference generated by the other cells. Expressed in decibel (dB).
These measurements are often reported in Arbitrary Signal Units (ASU) as well, an arbitrary unit that is obtained differently for each technology, detailed in Subsection 4.1.2.
A final relevant parameter is the mobile device’s reported operator name, which can be associated with the reported MCC and MNC for categorization purposes.
2.1.2 Wi-Fi technology parameters
Wi-Fi is a lot less variable than cellular technologies, as it is defined by a single standard, 802.11, and all of the variations of that standard differ mostly in their data rate [12, Chap. 6]:
• 802.11b was the first breakthrough for Wi-Fi, and offers a data rate between 1 and 11 Mbit/s.
• 802.11g, backwards compatible with the b standard, achieves data rates up to 54 Mbit/s. • 802.11a also has the same data rate, but it works in a different frequency band, 5 GHz, as
opposed to the 2.4 GHz band used by b/g.
• 802.11n works in both frequency bands and can theoretically support data rates up to 600 Mbit/s, as well as supporting MIMO antennas [14].
• 802.11ac [14] is the latest amendment to the standard, capable of achieving gigabit transmission rates, due to new features such as its multiple-user MIMO antennas.
11 FCUP
2.1. Network technology parameters
There are two ways of establishing a Wi-Fi network, namely the ad-hoc, or Independent Basic Service Set (IBSS) mode, where two or more wireless devices communicate directly, and the infrastructure mode, where multiple stations connect to a single access point, forming a Basic Service Set (BSS) - a group of BSS that share the same network name and security credentials is called an Extended Service Set (ESS). The network name is also called an Service Set Identifier (SSID) - usually human-readable, for ease of configuration.
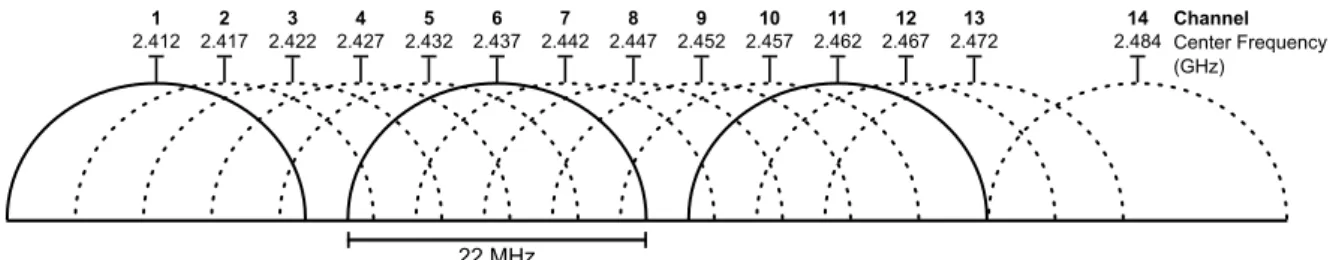
On top of the SSID, when configuring an access point, the frequency, or channel number, also has to be defined. A Wi-Fi channel consists of a subdivision of the valid frequency range (whether 2.4GHz or 5) in 5 MHz slices. In the 2.4GHz band, this corresponds to 11 channels in America and 13 in Europe. When configuring a Wi-Fi network, care should be taken to avoid selecting a channel that is too close to other BSS operating nearby, as a Wireless Local Area Network (WLAN) channel requires a bandwidth of 22 MHz to operate, therefore requiring a separation of at least five channels (except in channel 14’s case) to avoid interference (as seen in Figure 2.3). 12 2.467 1 2.412 22 MHz Channel Center Frequency (GHz) 2 2.417 2.4223 2.4274 2.4325 2.4376 2.4427 2.4478 2.4529 2.45710 2.46211 2.47213 2.48414
Figure 2.3: Graphical representation of 2.4 GHz band channels overlapping, by Michael Gauthier via Wikimedia Commons (CC-BY-SA 3.0).
Another important Wi-Fi parameter is security. The oldest security standard, available in 802.11a/b/g, is Wired Equivalent Privacy (WEP), which is considered not to provide enough security, as the key can be trivially obtained by an attacker through obtaining enough data from the frames transmitted in the network. [12, p. 349] estimates 5 million frames of information are necessary, though attacks such as [15] succeed in 95% of cases.
Some additional security features were added to the access points that strengthen WEP, such as a Media Access Control (MAC) address filter, which prevents devices that have not been previously authorized by an administrator to connect, or hiding the network’s SSID. However, these features are not very secure, as a MAC address filter can be circumvented by manually changing the hacker’s device’s MAC to an accepted one, and the SSID can be obtained even if
Chapter 2. Background
not broadcasted.
To solve these problems, the industry developed the Wireless Protected Access (WPA) standard, which offers an improved authentication scheme and a new encryption algorithm. WPA also has a more secure and more restrictive specification, WPA2, which is backwards-compatible with WPA-only devices [12, Chap. 6.7.2].
WPA has two forms of authentication: Pre-Shared Key (PSK), which uses a pre-shared key in the access point and all client devices, in a similar way to WEP, and Extensible Access Protocol (EAP), which is the name given to all protocols that include communication with external authentication servers.
In terms of encryption, WPA supports two different algorithms, Temporal Key Integrity Protocol (TKIP), designed to replace WEP’s weak algorithms, and Counter Mode CBC-MAC Protocol (CCMP), which is mandatory in WPA2.
2.2
Alternative ways to collect data
If a consumer wants to obtain information on mobile network statistics, there are two alternatives: resort to already completed studies (which can be done by entities like market regulators such as ANACOM or by external analyst companies such as Gfk, Marktest [2] or Pew [1]), or performing their own studies.
In the case of market studies, their data can be, at least in part, provided by the operator. In [16] an example can be seen: that’s the current form that all mobile service providers in Portugal must submit to ANACOM every trimester, and it includes various types of data, such as the origin of the income from each type of service provided, the amount of subscribers of every type of service (Short Message Service (SMS), Multimedia Messaging Service (MMS), broadband, 3G), or the megabytes transmitted by different Internet services.
Other than that data, ANACOM also uses external information (for example, for population data, or to confront their data with other reports such as Marktest’s).
A weakness of industry data, however, is exactly what the provided data means - “If one individual actively uses two SIM connections, that person will be counted by the industry as two mobile connections although he or she is only one mobile subscriber” [17]. This is especially
13 FCUP
2.2. Alternative ways to collect data
relevant if you’re dealing with data from developing countries, as device sharing is a reality there - the survey in [17] found that the number of phones per respondent was lower than the number of SIM cards per respondent, in contrast to a ratio that is closer to 1:1 in developed markets.
However, if you want to perform your own studies, there are several ways to do so. For example, in the aforementioned Marktest’s case, they obtain data through phone (mobile and land-line) interviews, taking into account the usual sampling methods (geographic, gender, age, etc.). After gathering these interviews, at a rate of 1250/month, they process the data and release it to their customers [18]. Gfk also utilizes surveys, but they are from retail data instead of interviewing [19]. The Pew Research Center also collects its data via surveys in the aforementioned report [1].
Surveys are not always the most adequate way to handle things, though. In the case of this dissertation, for example, they would not be sufficient, as an objective way of measuring mobile network quality is necessary.
A way to do that would be obtaining manual measurements throughout the area that the consumers are interested in. In 2010, German consultant P3 was hired by the magazine Exame
Informática [20] to evaluate the quality of 3G networks in the biggest cities of Portugal. Their
methodology is relevant to this project, as they were specifically evaluating conditions that common users would encounter: monitoring download and upload speeds, ping, e-mail sending and reception, and web navigation.
It is certainly a correct way to perform measurements, but it is definitely inefficient. In this project’s case, as the data should be obtained without specific geographical constraints, it would imply traveling all around the world with smartphones or tablets - definitely not within the realm of plausibility.
A way to counter some of the aforementioned issues is to pass the geographical burden on to the users - if people are collecting data from around the globe, the people designing the application do not have to travel to obtain that data. That kind of strategy is usually called crowdsourcing - “a form of peer production that outsources works to a large group of people” [21].
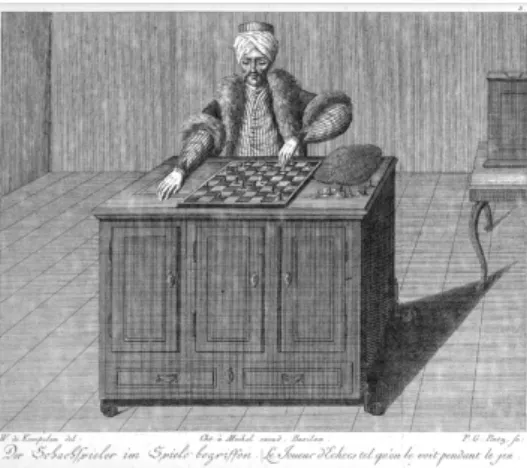
In the 1760s, a Hungarian nobleman build the first machine capable of beating a human at chess, the Turk (Figure 2.4). Although the Turk toured Europe and beat famous people such as Benjamin Franklin and Napoleon, it was not really technology - it had a cabinet that hid the human intelligence moving the machine. Amazon’s crowdsourcing marketplace, Mechanical
Chapter 2. Background
Turk, was named after this machine, for the way it uses human mental power to solve complex tasks [22].
Figure 2.4: The original Turk, represented in a copper engraving by Karl Gottlieb von Windisch, via Wikimedia Commons (public domain).
However, Mechanical Turk functions by providing monetary rewards via micro-payments, which are paid directly by the requester to the users who complete the tasks, and when monetary rewards are involved, things become significantly more complex - [21] shows an example of several strategies that are required to fight problems such as “free-riding”, where if the payment is granted before the task is solved, the user can take the payment and provide no effort to solve the task, or “false-reporting”, where the requester can refuse payment by lying about the outcome of the task.
The cited paper’s primary contribution is to propose incentives based on social norms, notably integrating reputation mechanics to provide better service, e.g., by granting a higher chance to participate in tasks to a worker with a higher reputation.
2.3
Measurement techniques
We surveyed multiple different publications that performed types of measurements with objectives similar to ours, and this section describes their techniques.
A team from the University of Michigan [23] developed a cross-platform application for 3G measurements called 3GTest that was “executed by more than 30,000 users throughout the world”, and which was used to measure real world performance, by resorting to devices that consumers use in the four major cellular carriers in the U.S.
15 FCUP
2.3. Measurement techniques
Their technique consists of measuring actual performance (Transmission Control Protocol (TCP) throughput, ping latency, Domain Name System (DNS) lookup delay) that they decided
reflected real world usage.
They also reached some conclusions with regards to time of day and signal strength’s correlation with 3G quality:
• There are noticeable time of day patterns, for example, Round-trip Time (RTT) varying from 300 ms during late nights to as high as 700 ms during peak times for the AT&T carrier;
• However, the time of day effect is less pronounced for uplink throughput compared to downlink throughput, likely due to higher demand for downlink capacity;
• As it is not easy to control signal strength, they monitored it during a week, and they concluded that the most important thing was the signal strength not being too weak -below a certain value, TCP connections would disconnect;
• Above that threshold, there is a correlation between signal strength and downlink throughput until a specific point, above which additional signal strength does not make a difference.
Many other conclusions from the paper depend on the hardware used, and, as such, are outdated (tests were done with iOS 2.1, Windows Mobile 6.1 and Android 1.6).
A different technique was done in [24], where the used metrics were to measure both TCP goodput (defined as the actual throughput at an application level, i.e., excluding protocol overhead and retransmissions) and signal strength, and the main objective was to measure TCP goodput’s correlation with signal strength.
To achieve this, they designed a mobile network measurement platform called Netradar, which is available for a very wide variety of smartphones and tablets (details on the application are further ahead in this chapter).
They propose that in client-server measurements, the server side should not be the bottleneck - in their case, they decided to implement a ticketing system that makes users wait in a queue
when the server is over capacity.
Chapter 2. Background
• There is a strong signal strength/TCP goodput correlation; however, the correlation slows down above 40% signal strength;
• When the phones report greater than 90% signal strength, the TCP goodput tends to be lower. This may be due to having a very high number of measurements for this signal strength, causing secondary effects such as network congestion to be more pronounced; • The size of the areas chosen for grouping measurements is very important: while GPS has
an average accuracy of 52 meters, network positioning has an average of 1125 meters - still, with 500x500m tiles, the standard deviation they found for the average tile size is 15%, thus allowing three separate non-overlapping classes of signal strength to be displayed.
Their most important conclusion is that signal strength measurements are not enough to draw coverage maps by themselves, thus making it important to collect other measurements too. Another relevant related work is [25], an end-of-degree paper produced by a student of the Universitat Politècnica de València, which talks about two applications: a crowdsourcing one and a 3G measurement one.
The first application is an Android application that interacts with a pre-existing server to register for appointments in several areas (pharmacies, hairdressers, etc.). Since the application has cloud computing features, the most essential feature in the phone is the Internet connection; therefore, it is dependent on the cell phone’s coverage.
A way to mitigate those problems is to have a server that contains information related to the mobile network quality in a given location, so that applications can take that quality into account for Quality of Service (QoS) purposes.
The author then developed a crowdsourcing-based mobile application to measure 3G/HSDPA network bandwidth which connects to a server via User Datagram Protocol (UDP).
His methodology consisted of obtaining a packet train with different sizes and calculating the downlink bandwidth. Afterwards, he compared the obtained results with the commercial tool Speedtest.net mobile. Although the 100 byte, 500 byte and 1400 byte packets all performed in a very similar way to Speedtest.net’s test, the comparison may be inconclusive, as Speedtest also uses multiple file sizes in its speedtests (“Small binary files are downloaded from the web server to the client to estimate the connection speed (...) Based on this result, one of several file sizes is selected to use for the real download test” [26]).
17 FCUP
2.4. Existing applications
The data collected by this application is pretty much only that which is necessary for the aforementioned technique to work: device/operator/base station identifiers, location data, and the network connection information (bandwidth and signal strength).
Furthermore, and within the realm of Wi-Fi only, researchers from the University of Michigan designed a solution to measure network performance in large networks, such as corporations and universities, via crowdsourcing [27].
The application they created, MCNet, uses a mobile crowd sensing approach. Rather than relying on technicians carrying out expensive manual measurements, they take advantage of crowdsourcing. Since users have a vested interest in having better Wi-Fi performance, using this approach is likely to have high participation.
It runs on Android devices only, and it has both active and passive components: while metrics such as latency and throughput have to be done actively, they find it is important to also collect data such as connection RSSI and data rate from the device’s already registered data, in order to minimize power consumption.
The conclusions to be taken from these techniques are:
• Signal strength alone is not enough, making it a good idea to enable association with other data;
• Measuring real world usage provides accurate results that relate to users’ experience, while also being a lot less costly to implement compared to performing manual measurements; • Bottlenecks should be avoided on the server side;
• When performing speed tests, there is not enough information on whether or not multiple file sizes are an advantage over a single file;
• It is viable to collect data that is already on the device in order to avoid extra power consumption.
2.4
Existing applications
There is a large number of applications already on the market that take measurements from mobile networks. However, the way that they perform them, the way they display them and
Chapter 2. Background
even the software they use is interesting to examine for comparative purposes.
2.4.1 Sensorly
Sensorly [28] is a free, crowdsourced coverage mapping service for wireless networks, developed by a French startup in 2010. It collects mobile cellular and Wi-Fi network information, namely related to the geographical location, the mobile terminal and its connections, including (but not limited to) signal quality, terminal device model, Operating System (OS) version, network speed, call logs, and Wi-Fi SSID [29].
It also provides some interesting features, such as mapping the environment for a planned trip, or comparing to neighboring operators.
2.4.2 OpenSignal
OpenSignal [30] is an application designed to create a comprehensive database of cell phone towers, cell phone signal strength readings, and Wi-Fi access points around the world. They claim to collect data from their application that is stripped of any identifying information and is made available online for free, both in a coverage map form and in an API form. The API has the ability to get mobile network data via latitude/longitude in a bounding box or to collect tower information based on the cell id and local area code [31]. It also collects Wi-Fi data, but it is not visible either in the coverage maps or via an API.
2.4.3 4gmark
This tool [32] was designed for quality of service testing, and it allows users to either do a simple speed test or a more complete test that evaluates real use cases (web browsing, YouTube) and compare the results with other users in the same country, zone or with the same smartphone. It also allows them to configure their own custom test.
The data collected by the application is not publicly available, in either API or coverage map form.
19 FCUP
2.4. Existing applications
2.4.4 Rootmetrics
Rootmetrics [33] is yet another measurement tool, but it differentiates itself from the others seen so far by having a very concrete focus on the United States - on top of a (fairly sparse) international coverage map created via a combination of crowdsourcing and their professional testing, they perform manual, individualized testing throughout all 50 states and publish regular reports on network quality within the USA.
2.4.5 Netradar
The previously mentioned Netradar [34] is the Aalto University-developed system that allows users to measure and share the quality of their mobile Internet connection. There is a coverage map available, although not an API. The application measures only 3G and 4G networks, and it allows the users to utilize Google’s login to keep record of their own measurements or browse them.
2.4.6 Ookla Speedtest
On top of being one of the most popular of the speedtest sites [35], speedtest.net has a dedicated mobile application that tests the performance of both cellular and Wi-Fi mobile networks. Its methodology is public [26], as well as the exact type of the data the application collects [36]. It is interesting to note just how much data they collect that is not directly related to the speedtest, for later processing and publishing under their (paid) NetMetrics service.
2.4.7 MobiPerf
Developed mostly in the University of Michigan, by the Robust Net Research Group (same research group as [23]), MobiPerf [37] is an open source application for measuring network performance on mobile platforms. The data is collected either anonymously or from a selected account, which allows users to see their own data. The user credentials collected are not shared outside of this site, and any data used in research projects in universities is anonymized before use.
Chapter 2. Background
measurements if they are logged in, as well as view a coverage map that shows the data collected in the past 48 hours. The (anonymized) data is also available for researchers. Furthermore, this application measures the Radio Resource Control states in the phone, and the implementation of those measurements is detailed in [38].
MobiPerf won two awards from the US Government’s Federal Communications Commission in 2011, the Open Internet App Award and the People’s Choice App Award [39].
2.4.8 Mozstumbler
The most recent of the applications mentioned (released in October 29th 2014), Mozstumbler [40], is a Mozilla-developed Android application which collects GPS and wireless network data for their crowd-sourced location database (Mozilla Location Service).
The application collects data from Wi-Fi and cellular networks as users move from one location to another, and that data is either used to fill in the coverage map or to improve the precision of areas that have already been filled in.
Mozilla allows you to download data from cell networks [41], but not from Wi-Fi networks, as they may be considered personal data - they also offer an opt-out mechanism for Wi-Fi (hidden SSID or SSID ending with _nomap).
Furthermore, Mozilla incorporates data from the OpenCellID [42] project, which “puts a stronger emphasis on public data compared to possible privacy risks, whereas (mozstumbler) has a stronger emphasis on privacy”.
2.4.9 Global comparison
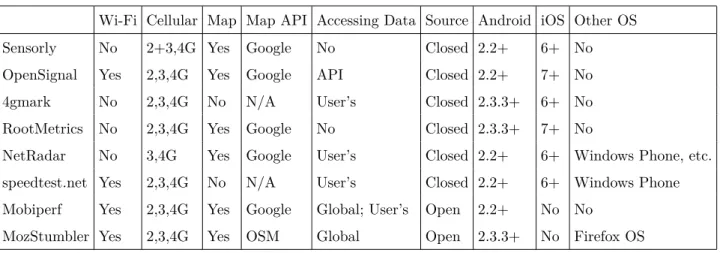
The most important conclusion to take from Table 2.1 is that support for all generations of mobile networks is very important - all applications support 3G and 4G, and most support 2G (even if, as in Sensorly’s case, they group it with 3G). Also interesting is that every application that uses a map to display results utilizes Google Maps’ API and maps, with the sole exception of Mozilla’s - Google Maps’s popularity is easy to surmise from this table.
Another relevant aspect is the multiplatform capability of most of these applications, which leads to the conclusion that it is very important to carefully study what this dissertation’s application should be developed for.
21 FCUP
2.5. Chapter Summary
Wi-Fi Cellular Map Map API Accessing Data Source Android iOS Other OS Sensorly No 2+3,4G Yes Google No Closed 2.2+ 6+ No OpenSignal Yes 2,3,4G Yes Google API Closed 2.2+ 7+ No 4gmark No 2,3,4G No N/A User’s Closed 2.3.3+ 6+ No RootMetrics No 2,3,4G Yes Google No Closed 2.3.3+ 7+ No
NetRadar No 3,4G Yes Google User’s Closed 2.2+ 6+ Windows Phone, etc. speedtest.net Yes 2,3,4G No N/A User’s Closed 2.2+ 6+ Windows Phone Mobiperf Yes 2,3,4G Yes Google Global; User’s Open 2.2+ No No
MozStumbler Yes 2,3,4G Yes OSM Global Open 2.3.3+ No Firefox OS
Table 2.1: A comparison of mobile network measuring applications.
2.5
Chapter Summary
The main purposes of this chapter were to study existing technologies in order to realize what the possibilities are, as well as to figure out where our research can break new ground, and to study different methodologies for obtaining data. The already existing applications share some characteristics between themselves, notably the way a majority of them provide a coverage map and that most of those maps use Google’s mapping API. With regards to methodology, it is observable that crowdsourcing seems to be the best way to obtain the data, although it is not without its flaws, such as the importance of incentives.
Chapter 3
Design
This chapter discusses the architecture of the system that will be implemented, as well as each of its components in more detail.
3.1
Overview
Mobile phones
Desktops
Laptops
Tablets Mobile Phones
Wi-fi antennae
ce
Cell towers
Tablets
Server Web Server
Mobile data collection Data processing Data display
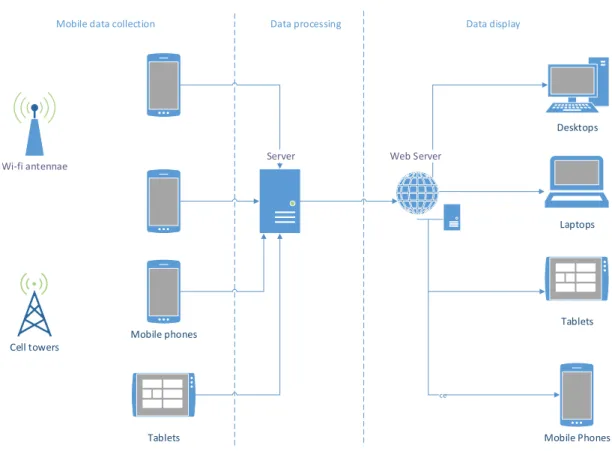
Figure 3.1: General overview of the structure of the planned system. 23
Chapter 3. Design
Figure 3.1 displays the structure of the system, showing the three main components: the crowdsourcing app, running on a mobile device (whether a tablet or a phone) can collect data related to either Wi-Fi access points or cell towers in its vicinity and send it to a server. The server then gathers the data and processes it so as to display it in a Web server. The server’s web pages should be viewable and legible in any form factor possible - desktop computers, laptops, smartphones or tablets.
3.2
Mobile data collection
The component of the application that deals with data collection has to collect measurements from the mobile device’s Wi-Fi components, from its cellular components, and, when possible, from its sensors in order to enrich the wireless information - e.g. utilizing the barometer, combined with the device’s location services, in order to calculate the current altitude level of the mobile device.
On top of obtaining either the cellular or the Wi-Fi data, we couple it with an additional set of parameters that are common to both, which will be referred to as generic measurements. These measurements include the latitude/longitude of the mobile device, as well as the aforementioned pressure from the barometer, and identifying information of the device such as its model and manufacturer.
Obtaining the altitude based on the mobile device’s barometer requires an Internet connection, as the altitude has to be calculated based on the difference between the current atmospheric pressure and the pressure at sea level [43].
Finally, the mobile application also requires a way to synchronize the measurements with the server. We decided that it was unnecessary to perform synchronization at the same time the measurements were made. Users may want to perform measurements while they only have access to mobile data, and wait to send the measurements to the server when they are utilizing Wi-Fi at home; they may not have a mobile data plan at all, and want to avoid the heavy expenditure data usage takes in those conditions.
In order to perform this delayed synchronization, the application needs to store the measure-ments in a local database, and then only communicate with the server at the users’ command. It might also be relevant to warn users if they have not performed a synchronization in a long time.
25 FCUP
3.2. Mobile data collection
3.2.1 Cellular measurements
The cellular measurements can be further divided into two different groups: the general cellular information, which includes the current operator, voice network type, data network type and the signal, and a series of one or more objects containing information on the cells visible by the phone. These cell objects include the location area code and the cell ID of the tower that defines them, coupled with the mobile operator’s unique identifier.
The signal included in these measurements is also not a simple observation of the signal level at the instant the measurements are started. It is the result of listening to the mobile device’s telephony system’s signal level over a short period of time, and then averaging those signals. This is done in order to prevent situations such as the reported signal not being representative of the ’real’ signal within the observed area, due to phenomena such as shadowing (“the received signal power fluctuat[ing] due to objects obstructing the propagation path between transmitter and receiver” [44]).
Cellular measurements are only possible to perform in a device with functional telephony; as such, most tablets and phones without a SIM card will not be able to perform them.
3.2.2 Wi-Fi measurements
The Wi-Fi measurements, unlike their cellular counterparts, are just a group of individual objects containing the information of every Wi-Fi network visible from the mobile device. These contain its identifying information (SSID/Basic Service Set Identifier (BSSID)), a signal strength value, and other details on the network such as its encryption scheme and whether or not it supports Wi-Fi Protected Setup (WPS).
On top of this, if the network is currently active (currently connected to on the mobile device), there are a few extra values we can register, such as the link speed and whether or not the network has a hidden SSID.
Finally, the measurements can be performed either instantly or, similarly to the cellular measurements, over a period of time.
Chapter 3. Design
3.2.3 Other measurements
The application also includes a speedtest function. This speedtest is performed over the mobile device’s network interface - using mobile data, Wi-Fi or Ethernet, depending on which it has got defined as the default route - and it only consists of a download test (upload tests can be added in the future).
This download test can be performed in one of two ways: through a simple Hypertext Transfer Protocol (HTTP) download from a content delivery network (in order to prevent bottlenecking, as well as not having a single point of failure if possible, we decided that it should be avoided to resort to the application’s server exclusively), or through a peer-to-peer system, implemented by using a torrent client and measuring its download speed.
3.3
Data processing
After the data is collected, it will have to undergo some processing. This will be performed by a different part of the application, running on a server, that can receive the previously stored measurements from the mobile application, store them in a backend database, and then run a different component on top of that database in order to prepare the data for easy visualization.
3.3.1 Client-Server communication
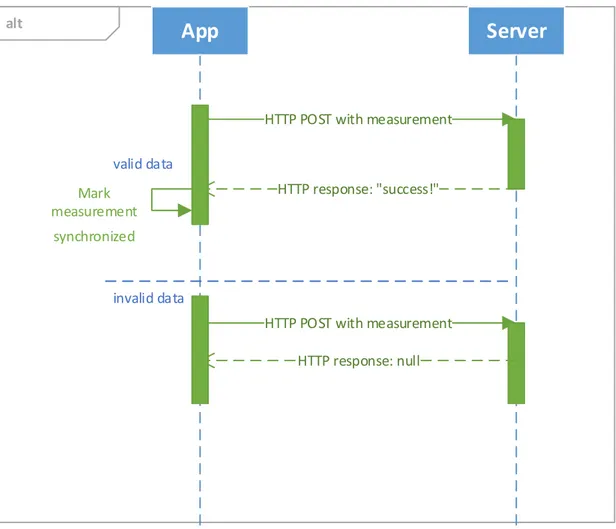
The communication will be handled via HTTP. As seen in figure 3.2, the server will be listening for input on a given HTTP Uniform Resource Locator (URL), and the mobile application will send data there via an HTTP request - after the request is complete, the server will attempt to process the data and send back a message confirming correct reception. If this message is not received by the client after a short period of time, or if it instead receives a message explicitly stating that the data sent was not correct, it will attempt to send it again the next time the user performs a synchronization task. Otherwise, it will mark the measurement as synchronized and will skip it in the next synchronization attempt.
After receiving these measurements, the server processes them and, according to their type (Wi-Fi or cellular), stores them into the backend database in different tables, which will be
27 FCUP
3.3. Data processing
alt
App
Server
HTTP POST with measurement
HTTP response: "success!"
invalid data valid data
HTTP POST with measurement
HTTP response: null
Mark measurement
synchronized
Figure 3.2: UML diagram representing synchronization of a single measurement.
3.3.2 Database design
There are a few requirements the database should fulfill, namely, being able to store the data received from the phone’s Wi-Fi and cellular measurements, being able to store external data that we decide to import, and storing the results of our processing of the phone’s raw measurements.
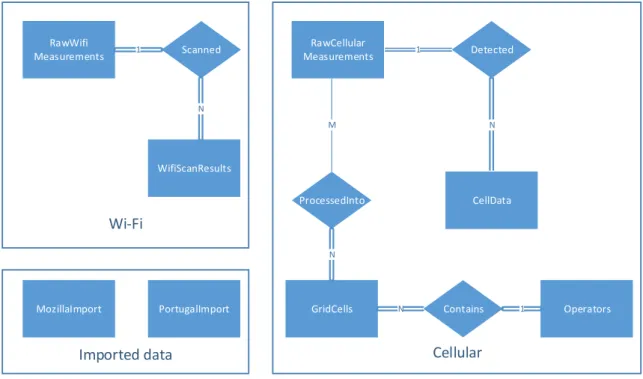
Figure 3.3 shows how our database is organized, which this section will describe in more detail. As we can see from the figure, the two major database entities are RawWifiMeasurements and RawCellMeasurements, as it is from these that many of the other entities derive.
RawWifiMeasurements contains the information on an individual WiFi measurement -almost none of it is specific to Wi-Fi, as it is mostly what we defined in section 3.2 as generic measurements, such as the device’s data, the geographical position (which may be null), and the time at which the measurement was performed. For each RawWifiMeasurement entry, however,
Chapter 3. Design 1 RawWifi Measurements RawCellular Measurements ProcessedInto M GridCells N Scanned 1 WifiScanResults N Detected N CellData N Contains 1 Operators MozillaImport PortugalImport Wi-Fi Cellular Imported data
Figure 3.3: Chen’s Entity-Relationship diagram representing our database.
there is at least one WifiScanResults entity, which contains the actual details of the Wi-Fi data we collected, such as the SSID, BSSID and signal strength of the detected access points.
As for the cellular measurements, RawCellularMeasurements also contains the generic measurement information, but it has additional, cellular-specific attributes, such as the device’s telephony type, network type and operator name and ID. Furthermore, similarly to the raw Wi-Fi measurements, each RawCellularMeasurement entry also has one or more associated entity, in this case, instances of the CellData entity. Every CellData entry consists of information on a single detected tower, containing values such as the tower’s MCC, MNC, CID and LAC.
The cellular measurements are also going to be used for drawing the grid of signal strengths that we will describe in the following section. The relationship between these is unique - every grid cell is defined by containing at least one measurement, but measurements may not be in any grid cell, as there is the possibility that the user has turned off the location services on his mobile device, therefore making it impossible to categorize that measurement.
Finally, an auxiliary entity is obtained from the processed grid cells, the Operators entity, which contains information on every mobile operator. For every operator for which we have data, it contains all the different names that were reported by mobile devices, Possible cases of different names for the same operator are when a mobile operator changes its corporate name, or
29 FCUP
3.3. Data processing
when it has multiple different brand names under the same MNC. The database will concatenate all of these names, for display purposes.
The two other entities in this diagram represent data which can be imported into our database, namely, the Mozilla Ichnaea tower data in MozillaImport (detailed in subsection 3.3.4) and, in PortugalImport, the geographical data of Portugal’s administrative regions which was imported from the GADM administrative areas found in [45].
3.3.3 Visualization processing
After the data is processed into the raw measurements tables, it has to go through an additional step before it is ready for display on the server. We defined that step as the creation of a “grid” covering the whole Earth, where each grid cell corresponds to a subdivision of the Earth’s total latitude/longitude.
The grid building starts when the program initializes the grid by either defining a value for the maximum latitude and longitude we want, as well as the size of the grid cell in degrees, or by utilizing our default values, described in Chapter 5. Then, the program goes through all of the raw cell measurements, and, for each one, determines whether or not there is already a grid cell that matches it (defined here as having the same grid position, the same mobile operator ID and the same network class - 2G, 3G or 4G).
The grid position of a measurement is determined by the following formula, applied once for the x axis (latitude) and once for the y axis (longitude):
indexx = b(x + maxx)/totalx∗ (totalx/deltax)c (3.1)
where x represents either the latitude or longitude, maxx the maximum value of either of those
(necessary, in order to convert from, e.g., in longitude’s case, values from -180 to 180 to values
from 0 to 360), totalx the total size, in degrees, of the geographic coordinate (e.g. 360 for
longitude), deltaxthe size of each cell in degrees and totalx/deltax the number of cells we divided
the world in).
• If there is a matching grid cell, the number of samples in that cell is incremented, and the signal strength in that cell is changed - the chosen way to perform this change, detailed below, is an exponentially weighted moving average (see Appendix B), where the lambda is at 0.6: every time we get a new measurement, the value of the grid cell’s signal
Chapter 3. Design
strength is changed to 0.6 ∗ newV al + 0.4 ∗ oldV al, a value which results in every new measurement having a very large influence over the previous ones.
• Otherwise, there will be a new entry in the table, corresponding to a new grid cell, which stores the cell’s geographical position, its index, its signal strength in three different forms (dBm, ASU and a 0-4 level, used to categorize the cell for viewing in the map), its operator
ID and reported operator name, and its network class.
After going through all the measurements, the program also stores in a different table all the operators that appeared, and concatenates all the different reported names for each one of them. Finally, it defines the color that this operator’s towers will use when being displayed on the map. This color can be either determined programatically, via iteration (each operator from a given country gets the next color in the list), or manually (we know all the available operators in a country and we want the color of the towers on the map to reflect their primary branding color).
3.3.4 External data import/export
Another feature of the program is to import data from external tower databases. We decided to perform imports from the Mozilla Ichnaea API, as all of its cell tower information is available on the Mozilla Location Services page [41], and the description of the data exchange format is also public [46].
Mozilla makes all their data available in a Comma-separated Values (CSV) file containing all of the towers detected up to any given day, as well as smaller diff CSV files containing simply the towers that were added in that day.
In the future, it should also be possible to export our data to Mozilla’s servers, as their API has a function for data submission [47], as our database was designed from the start to be easily converted into that format.
The data exchange format, that Mozilla created in collaboration with the OpenCellID project, is described in Appendix A (taken from [46]).