Procedia Food Science 1 (2011) 1015 – 1025
2211–601X © 2011 Published by Elsevier B.V. Selection and/or peer-review under responsibility of 11th International Congress on Engineering and Food (ICEF 11) Executive Committee.
doi:10.1016/j.profoo.2011.09.152
Dynamic approach for assessing food quality and safety
characteristics: the case of processed foods
Teresa R.S. Brandão, Cristina L.M. Silva
a
*
CBQF / Escola Superior de Biotecnologia, Universidade Católica Portuguesa
Rua Dr. António Bernardino de Almeida, 4200-072 Porto, Portugal
Abstract
Thermal processes applied to foods focus on destruction of target microorganisms. Besides these processes often occur under time-varying temperature environments, microbial inactivation is commonly assessed under isothermal conditions. The development of mathematical models that describe microbial kinetics in dynamic conditions is important for processes design. Another process that occurs under time-varying temperature conditions is frozen storage of foods.Thermal inactivation of Listeria innocua (surrogate of L. monocytogenes) in parsley, and quality degradation of vegetables under frozen conditions were used as case-studies.Developed models that include time-temperature effects accurately described inactivation/degradation of the characteristics analyzed both under isothermal and dynamic conditions.
d/or peer-review under responsibility of ICEF11 Keywords: Food quality and safety; time-varying temperature conditions; thermal processes; frozen storage
1. Introduction
Foods often suffer processing, which has three major aims: to make food safe, to provide products of the highest quality attributes, and to make food into forms that are more convenient or more appellative. Food processes such as thermally based ones (e.g. pasteurization or drying) and/or frozen storage occur in time-varying temperature conditions.
The almost inexistence of isothermal processes in the food industry may compromise the application of kinetic results obtained under constant temperature conditions in dynamic situations. The assessment of time-varying temperature conditions in microbial inactivation is therefore important in the design of safe
* Corresponding author. Tel.: +351-22-5580058; fax: +351-22-5090351.
food processes. When realistic food processing conditions occur, the temperature history used in the process defines the microbial behaviour [1]. Bacteria submitted to a non-isothermal heating process (i.e. in which temperature rises throughout the process time till a target value) are more heat resistant than bacteria treated at constant target temperatures [2].
Aiming at long-term foods preservation, freezing and frozen storage are key processes. However, post-processing temperature conditions and temperature fluctuations throughout storage and distribution greatly affects the rates of quality degradation and shelf-life of frozen foods, particularly important in the case of vegetables. Comprehensive studies on the influence of frozen storage conditions on the quality of vegetables (e.g. green beans, tomato, potato, strawberries and broccoli) have been carried out using measurements of particular compounds/characteristics, such as ascorbic acid degradation, transformation of pigments, and alterations in sensory characteristics, like colour and texture [3-5]. Modelling the degradation kinetics of quality losses during isothermal frozen storage are decisively important, since kinetic parameters estimation will allow products’ final quality prediction and, consequently, improvements may be attained [6,7]. However, the extensive storage times for quality changes assessment in frozen conditions are limitative. The use of accelerated life testing methodology overcomes these difficulties, since experiments are performed at higher than usual stress conditions in order to induce rapid alterations [8].
The use of mathematical models that describe/predict changes of processed foods characteristics with accuracy and precision in such realistic dynamic conditions is an important tool in developing new products and to control systems. The greatest modeller’s effort has been given to data obtained under constant (or static) environmental conditions. From a realistic point of view this is somehow restrictive, since the majority of thermal processes occur under time-varying environmental conditions, and kinetic parameters obtained under such circumstances may differ from the ones estimated at static conditions, which compromises safety control and quality prediction. Researchers are conscious of these difficulties and are trying to extend and structure models to deal with predictions in time-variant domain, since they may constitute a useful tool for industries, universities and regulatory agencies.
The main objective of this work is to study food products in terms of quality and safety characteristics, when they are submitted to processes with time-varying temperature conditions, and to assess mathematical models that adequately describe the observed responses. Several combinations of food/characteristics were used as case studies.
2. Materials & Methods
2.1. Thermal inactivation of Listeria innocua
Safety was evaluated using a non-pathogenic surrogate of Listeria monocytogenes (i.e. Listeria
innocua). Heat treatments were carried out in a thermostatic bath (Julabo® FP40, Seelbach, Germany)
with a temperature programmer (Julabo® HC-E07, Seelbach, Germany). Isothermal experiments were carried out at 60 and 65°C. Three different temperature profiles from 20°C to 65°C were also assumed: (P1) a linear increase in the temperature at a rate of 1.5 °C/min (for approximately 31 minutes till 65°C is achieved; i.e. T(t)=20+1.5t), followed by a period of constant temperature (T(t)=65°C for approximately 20 min); (P2) a linear increase in the temperature at a rate of 1.8 °C/min (for approximately 25 min till 65°C is achieved; i.e. T(t)=20+1.8t), followed by a period of constant temperature (T(t)=65°C for approximately 10 min); and (P3) a linear increase in the temperature at a rate of 2.6 °C/min (for approximately 18 min till 65°C is achieved; i.e. T(t)=20+2.6t), followed by a period of constant temperature (T(t)=65°C for approximately 12 min).
Parsley (Petroselinum crispum) samples were artificially inoculated by immersion in a TSBYE bacterial suspension with approximately 107 cfu/mL. The samples were sealed and vacuum-packaged
thermostatic agitated water bath, suffering a heat treatment corresponding to the temperature condition/profile assumed. Bags were positioned such that entire parsley samples were submerged and each bag was removed at different time intervals and placed in a mixture of ice-water. For each time, 27 mL of sterile peptone water was added to approximately 3 g of parsley and bags were pummelled for 4 min in a stomacher at normal speed. Samples were diluted and plated in duplicate in Palcam Agar plus selective supplement. All plates were incubated at 30°C and counted each 24 h during 5 days, or until the number of colony formation units no longer increased.
Experiments were also carried out using TSBYE as heating medium. Erlenmeyer flasks with 99 ml of TBSYE were immersed in the water bath at the desired temperature. One of the flasks was used for the microbial inactivation experiments while the other was used for temperature control. Once the heating medium temperature had attained stability, it was inoculated with 1 ml of L. innocua cell suspension. Samples were taken at different times and placed in a mixture of ice-water; posterior enumeration was done as described before.
Mean values of bacterial counts, from duplicate plate samples, were converted to log counts normalized in relation to initial values for each combination (which averaged approximately 107 cfu/mL.).
2.2. Quality degradation under frozen conditions
Vegetables were obtained in a local market in Lisbon, Portugal. Pumpkin (Cucurbita máxima L.), in a fully ripe stage, was peeled and cut in cylinders of 50 mm diameter and 15 mm height, using a cork borer. Fresh broccoli (Brassica oleracea L. ssp. Italica) were divided into florets of about 5 cm diameter, cut 2 cm below the lowest ramification. Carrots (Daucus carota L. cv “Nantes”) were mechanically peeled, washed and sliced into 5 ± 1 mm, using a cut machine. All samples were blanched in optimized conditions before being frozen in a vertical forced air freezer (Refriger, Electo-Refrigeração, Portugal) at -40 ºC (average value), until the temperature of the center of cylindrical samples reached -35ºC. Frozen samples (~500 g each) were immediately packed into polyethylene bags (22 x 35 cm) and sealed.
After freezing, two frozen storage regimes (I and II) were considered:
Regime I - Corresponds to isothermal frozen storage conditions at -7, -15 and -25ºC (±1ºC). Frozen samples were distributed into three laboratory freezers (Fitotherm, S550 BT) at the constant temperatures established. Samples were removed at heuristic time intervals (i.e. sampling tended to be equally spaced in the time scale), over a period of 140 d;
Regime II - Corresponds to non-isothermal frozen storage conditions, considering accelerated life testing (ALT) with step-stress methodology (i.e. consecutive increases in temperature, by step levels). Samples were stored in sequence at -30ºC (for 21 d), -20ºC (for 16 d), -10 ºC (for 11 d) and -5ºC (for 9 d), totalling 57 d. Samples were removed at heuristic time intervals (i.e. sampling tended to be equally spaced in the time scale) and analyzed in terms of the following quality characteristics.
Colour. Colour was assessed in pumpkin using a handheld tristimulus colorimeter (Minolta Chroma
Meter CR-300, Osaka, Japan) using CIE colour space co-ordinates, L*a*b* values. Lightness value, L*, indicates how dark/light the sample is (varying from 0-black to 100-white), a* is a measure of greenness/redness (varying from -60 to +60), and b* is the grade of blueness/yellowness (also varying from -60 to +60). The total colour difference (TCD*) was the parameter considered for the overall colour difference evaluation: 2 0 2 0 2 0 L ) (a a ) (b b ) L ( * TCD * * * * * * (1)
L0*, a0* and b0* are the corresponding initial values (determined from defrost samples, after the freezing
operation).The colorimeter was calibrated against a standard white reference tile. Samples were placed in a clear glass Petri dish (ten replicates), and colour measurements were done in triplicate.
Texture. Texture measurements were performed in carrots using a TA.HDi Texture Analyser (Stable
Micro-System Ltd, Godalming, UK). At least 19 measurements were done for each tested condition.
Vitamin C. A modified titrimetric AOAC (1984) method was used for total vitamin C determination
in broccoli. Four independent extractions were performed per sample and results were expressed as mg of ascorbic acid per 100 g of vegetable sample.
Drip loss. Frozen samples were laid over a weighed absorbent paper and let to thaw at room at 4 °C.
Drip loss (DL) was evaluated in broccoli by periodically weighing the absorbent paper until a constant value was reached:
x100 W W W (%) DL s t 0 (2)where W0 is the weight of the dry absorbent paper (g), Wt is the weight of the wet absorbent paper at time
t (g) and WS is the weight of the frozen sample (g). Measurements were made in triplicate per sample.
2.3. Modelling procedures
A Gompertz-based model was assumed to describe microbial thermal inactivation under isothermal conditions [9]:
1 t L N N log e k exp exp N N log N N og l 0 res max 0 res isothermal 0 (3)where N is the microbial cell density at a particular process time, t. The indexes 0 and res indicate initial and residual (or tail) microbial cell density, respectively; L is the initial shoulder and kmax the maximum
inactivation rate. These parameters are temperature dependent.
In relation to shoulder, the following equation was used to express the temperature dependence [10]:
T d
2c
L (4) being c and d parameters.
The dependence of kmax with temperature was expressed by the well-known Arrhenius equation, using
a finite reference temperature (Tref) to reduce parameters’ collinearity [11]:
ref ref max k exp EaR T T k 1 1 (5)
where kref is the inactivation rate at a finite reference temperature, Ea the activation energy and R the ideal
gas constant.
For non-isothermal conditions, temperature varies with time. The number of log-cycles reduction at a particular time can be calculated by encompassing the time-temperature effect as follows:
' dt dt N N log d N N log t isothermal isothermal non
0 0 0 (6)In such conditions, L and kmax are time dependent and the previous expression derives to:
L 't t' dt' N N log e 't k exp exp ' t 't L N N log e 't k exp e 't k N N log t res max res max max isothermal non
0 0 0 0 1 1 (7)If the temperature history T(t) is known, the model valid for non-isothermal conditions can be obtained by merging equations 4, 5 and 7 [1]. The parameters of the Gompertz inspired inactivation model for isothermal (kmax, L and log(Nres/N0)), and non-isothermal conditions (kref, Ea, c, d and log(Nres/N0)), were
estimated by non-linear regression analysis, fitting equations 3 and 7 to experimental data, respectively. The reference temperature in the Arrhenius equation was considered equal to 58.5°C.
Kinetics of quality changes may be described by a zero or first order kinetic models, or by a fractional conversion model, depending on the parameter considered. The dependence of the reaction rate on temperature was also described by an Arrhenius equation (Eq 5). If non-isothermal conditions are imposed, the previous mentioned models are of the form:
zero-order
t ref a ref R Tt T dt E exp k C C 0 0 1 1 (8) first order
t ref a ref R Tt T dt E exp k exp C C 0 0 1 1 (9)fractional conversion model
t ref a ref eq eq C C exp k exp ER T t T dt C C 0 0 1 1 (10)Herein C denotes a quality characteristic (the indexes 0 and eq are initial and equilibrium values). The reference temperature assumed was -15ºC.
In all situations previously presented, model parameters were estimated by non-linear regression analysis. For isothermal conditions, global non-linear regression analyses (i.e. quality factor data versus time, at all temperatures) were performed using Statistica©8 software (Statasoft, 2007). For
00 (2011) 000–000
specially written in FORTRAN 77 language (Fortran 5.1, Microsoft Corporation®, 1990). The simplex
algorithm was used to minimise the sum of the squares of the residuals [12]. Parameters’ precision was evaluated by confidence intervals at 95% or by the standardised half width (SHW) at 95%, i.e. halved
confidence interval divided by the estimate x100
estimate 1 2 interval confidence 95% .
3. Results & Discussion
3.1. Thermal inactivation of Listeria innocua
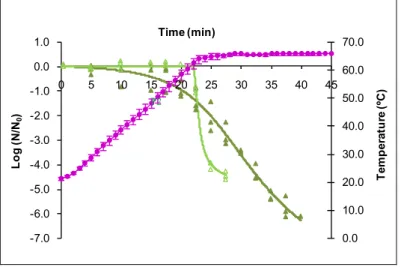
Results of thermal inactivation of L. innocua in parsley and in liquid heating medium (TSBYE) under time-varying temperature conditions are in Figure 1 (for the case where temperature increased from 20°C to 65°C with a heating rate of 1.8°C/min). An initial lag followed by a maximum inactivation rate period was observed, being these characteristics described by model parameters. Besides the sigmoidal tendency observed in both cases, inactivation behaviours were considerably different. In experiments carried out in liquid medium, inactivation started after a shoulder period of 22 min when temperature reached 61°C. When Listeria was artificially inoculated in parsley, the initial shoulder was reduced to 14 min, corresponding to a temperature of 45°C. After these periods, the rate of inactivation was higher in TSBYE medium than in the food.
Results of the Gompertz model parameters estimated by fitting equation 7 to non-isothermal inactivation are presented in Table 1. The adequacy of model fits were tested by residual analysis (i.e. residuals were normally distributed with means equal to zero and constant variance; residuals were random). The coefficient of determination was above 0.97 in all cases. The quality of regression analyses was therefore assessed.
0.0 10.0 20.0 30.0 40.0 50.0 60.0 70.0 -7.0 -6.0 -5.0 -4.0 -3.0 -2.0 -1.0 0.0 1.0 0 5 10 15 20 25 30 35 40 45 T em p er at u re ( ºC ) Log (N /N0 ) Time (min)
Fig. 1. Thermal inactivation data of L. innocua, in liquid medium ( ) and in parsley ( ), using a heating rate of 1.8 ºC/min. Solid lines represent model fits (eq. 5). The bars represent the standard deviation of the temperature history ( )
Table 1. Estimated kref, Ea, c, d and tail parameter of L. innocua, under non-isothermal treatments; Precision assessed by standard half width (SHW) at 95%. Medium Heating rate (°C min-1) kref (min) SHW95% Ea (J mol-1) SHW95% c (min) SHW95% d (K) SHW95% log(Nres/N0) SHW95% 1.5 0.506 8.38x10³ 1.23x1052.81x102 0.122 4.049 350.2 6.496 -20.8 7.1x10² 1.8 2.113 2.55x10⁸ 8.46x1043.99x108 1.020 7.52x106338.8 1.32x10⁶ -49.3 6.48x10⁷ TSBYE 2.6 0.670 2.49x101 6.63x1042.01x102 0.001 1.44x103465.3 2.11x10² -8.6 2.36x10² Parsley 1.8 1.329 4.34x101 5.24x1041.04x102 0.005 9.29x102274.3 1.02x10² -7.4 1.45x10²
It is notorious the effect of the heating rate on the induced heat resistance, assessed by the sigmoidal tendency of the inactivation kinetics. As heating rate increases, the shoulder decreases. Concerning parameters’ precision, it was evident the heating rate effect. The most precise estimates were obtained when the temperature profile with higher heating rate (2.6°C/min) was used. This observation is not unexpected when a non-isothermal methodology is used in kinetic studies [13]. This occurrence may be circumvent by the use of a convenient experimental design, selecting experimental data points and heating rates based on statistical theories [14].
Broth-based experiments highlights the importance of studying the influence of dynamic conditions on the thermal resistance of microorganisms, since the heating up phases can contribute to an increase in cells thermotolerance. Results obtained in parsley demonstrated that the product greatly affects bacteria thermal resistance; although the heat resistance of Listeria increased (when compared to liquid medium), the inactivation began earlier.
Overall it can be said that the model assumed has the ability of dealing with time-varying temperature conditions, which is a key value to predict microbial loads of foods that suffer a thermal process.
3.2. Quality degradation under frozen conditions
Colour. Figure 2a shows the changes in TCD* of pumpkin as affected by storage at different
temperatures, during 140 days. Significant alterations were observed at all temperatures. At the end of frozen storage, TCD* was 19.6, 14.5 and 9.8 (average of experimental observations) at -7, -15 and -25ºC, respectively. An Arrhenius fraction conversion kinetics model was satisfactorily fitted to experimental data (estimated parameters in Table 2; R2=0.85). The equilibrium value was 17.55 1.3.
Under non-isothermal conditions, colour alterations occurred at significant faster rates when compared to isothermal regimes within the same temperature range (Fig. 2b). At the end of the first 21 days of storage at -30ºC, very great differences were observed. The estimated equilibrium value was 24.16, which was significantly higher than the one obtained under isothermal frozen storage. This reveals that higher colour retention was attained under isothermal conditions. The adequacy of the fractional conversion model (eq. 10) was verified (i.e. residuals randomness and normality), being R2equal to 0.60.
Estimated model parameters are included in Table 2. The activation energy for this process is considerable low (2.01x10⁻⁶ kJ mol-1).
Fig. 2. Pumpkin colour degradation during frozen storage: (a) TCD*
at isothermal conditions; (b) TCD*
at non-isothermal conditions (dotted line indicates temperature history of regime II)
Table 2. Kinetic parameters of quality changes due to isothermal and non-isothermal frozen storage Kinetic parameter Frozen storage Quality factor Product C0 Ceq k-15ºC x 103 (days-1) (kJ molEa -1) Colour Pumpkin 0 17.551.31 19.04.00 24.864.97 Texture Carrot 21.910.22 (N) 4.20 0.42 (N) 6.76 0.40 95.06 4.54 Vitamin C 32.910.70 (mg/100g) - 6.800.69 60.247.20 Regime I Drip loss Broccoli 11.260.24 - 42.664.73 42.316.89 Colour Pumpkin 0 24.16† 7.85 x 10⁻²† 2.01 x 10⁻⁶† Texture Carrot 22.54 97.69 7.513.53 31.10 655.43 1.32x10⁻⁶† Vitamin C 34.7346.75(mg/100g) - 7.55† 0.0039† Regime II Drip loss Broccoli 12.15† (%) - 366.80† 0.0047†
†Meaningless large confidence interval; this lack of precision is expected if non-isothermal conditions are imposed [13]
Texture. Isothermal frozen storage of carrots resulted in considerable softening of tissues and firmness
loss (Figure 3a). At the end of storage (160 d), firmness decreases 81.6, 44.5 and 13.8 % at 7, 15 and -25ºC, respectively. Based on the experimental results obtained, it is clear that a rapid firmness degradation occurred at the highest temperature of -7ºC; after 20 d of frozen storage, firmness degraded approximately 30%. A fractional conversion kinetic model, with parameters related to temperature by an Arrhenius expression, was fitted to firmness data (kinetic parameters in Table 2; R2=0.95).
Figure 3b shows the degradation of carrot firmness throughout frozen storage at non-isothermal conditions. At the end of the storage period (57 d), carrot loosed about 63% of its original texture. This values was identical to the one observed at - 7ºC (c.a 66%). However, at lower constant temperatures, carrots firmness decreased 36% (at -15ºC) and 4% (at -25ºC). These results prove the importance of storing frozen carrots at low and constant temperatures.
Carrots firmness degradation under time-varying temperature conditions was also well described by the fractional conversion kinetics model (eq. 10; kinetic parameters included in Table 2; R2 = 0.86). The
firmness equilibrium value was higher than the one estimated isothermally, meaning that overall texture was better retained throughout non-isothermal storage.
( (a)
Fig. 3. Variation of carrots firmness throughout frozen storage under: (a) isothermal conditions; (b) non-isothermal conditions (dotted line indicates temperature history of regime II)
Vitamin C. Total vitamin C is a water soluble vitamin that is widely considered as an appropriate
marker for monitoring quality changes during processing, storage and at the end point of frozen chain. The effect of frozen storage at different temperatures on broccoli vitamin C degradation is in Figure 4. After 121 d of isothermal storage, the vitamin C content significantly decreased 80%, 60% and 29%, respectively at -7, -15 and -25ºC. The major loss of vitamin C occurred during the first 55 days of storage. An Arrhenius first-order kinetic model satisfactorily fitted the experimental data of vitamin C degradation under frozen storage (global fit of data obtained at all temperatures in Figure 4a; kinetic parameters included in Table 2; R2 = 0.96). Figure 4b shows the changes in broccoli total vitamin C through the
frozen storage at non-isothermal conditions (model parameters from fit using eq. 9 are in Table 2; R2 =
0.67). At the end of the storage period considered, broccoli losses around 51% of its vitamin C content.
Fig. 4. Broccoli total vitamin C content degradation during frozen storage: (a) under isothermal conditions; (b) under non-isothermal conditions (dotted line indicates temperature history)
Drip loss. Figure 5a shows the effect of the three different storage temperatures on frozen broccoli
drip loss. As storage time and temperature increase, a significantly increase in drip loss was observed. During storage at -7, -15 and -25ºC, drip loss increased approximately 88%, 43% and 12%, respectively. It was the quality factor mostly affected by the storage temperature. A zero-order kinetic model with Arrhenius temperature dependence fitted well experimental data (parameters in Table 2; R2=0.94). The
(b) (a)
00 (2011) 000–000
quality of the model fit was assessed by analyses of the residuals (i.e. normality and randomness were confirmed). Under non-isothermal conditions, drip loss occurred at a significant faster rate when compared to isothermal regimes. At the end of storage (57 days), broccoli drip loss suffered an alteration of approximately 16%. Comparing this result with the worse scenario obtained under isothermal conditions (drip loss of 5% at the highest temperature of -7 ºC) it can be concluded that non-isothermal storage had a great impact. The broccoli drip loss followed a first-order kinetics (eq. 9; experimental data and model fits in Fig. 5b; estimated parameters in Table 2; R2=0.75).
(a) (b)
Fig. 5. Broccoli thawing drip loss (%) during frozen storage: (a) under isothermal conditions; (b) under non-isothermal conditions (dotted line indicates temperature history of regime II)
Accelerated life tests applied to all vegetables were a satisfactory methodology for studying kinetics of quality changes during frozen storage.
4. Conclusion
Models that include the time-effect on kinetic behaviour were satisfactorily developed. They were efficient in describing thermal inactivation of microorganisms and quality alterations in products stored under frozen conditions. These achievements will be profitable in safety and quality predictions of food processes that occur under realistic dynamic temperature conditions.
References
[1] Gil MM, Brandão TRS, Silva CLM. A modified Gompertz model to predict microbial inactivation under time-varying temperature conditions. J Food Eng 2006;76(1):89-94.
[2] Miller FA, Ramos B, Gil MM, Brandão TRS, Teixeira P, Silva CLM. Heat inactivation of Listeria innocua in broth and food products under non-isothermal conditions. Food Control 2011;22:20-26.
[3] Aparicio-Cuesta P, Rivas-Gonzalo JC, Santos-Buelga C, Garcia Moreno C. Quality of frozen green beans (Phaseolus vulgaris) subjected to different storage conditions. J Sci Food Agri 1989;48(2):249-252.
[4] Lisiewska Z, Kimiecik W. Effect of storage period and temperature on the chemical composition and organoleptic quality of frozen tomato cubes. Food Chem 2000;70(2):167-173.
[5] Gormley R, Walshe T, Hussey K, Butler F. The effect of fluctuating vs. constant frozen storage temperature regimes on some quality parameters of selected food products. Lebensm Wiss Technol 2002;35(2):190-200.
[6] Martins RC, Silva CLM. Kinetics of frozen stored green bean (Phaseolus vulgaris, L.) Quality changes: texture, vitamin C, reducing sugars, and starch. J Food Sci 2003;68(7):2232–2237.
[7] Gonçalves EM, Cruz RMS, Brandão TRS, Silva CLM. Biochemical and colour changes of watercress (Nasturtium officinale R. Br.) during freezing and frozen storage. J Food Eng 2009;93(1):32-39.
[8] Martins RC, Lopes IC, Silva CLM. Accelerated life testing of frozen green beans (Phaseolus vulgaris, L.) quality loss kinetics: colour and starch. J Food Eng 2005;67(3):339-346.
[9] Gil MM, Miller FA, Brandão TRS, Silva CLM. On the use of the Gompertz model to predict microbial thermal inactivation under isothermal and non-isothermal conditions. Food Eng Rev 2011;3:17-25.
[10] Ratkowsky DA, Olley J, McMeekin TA, Ball A. Relationship between temperature and growth-rate of bacterial cultures. J Bacteriol 1982;149(1):1-5.
[11] Haralampu SG, Saguy I, Karel M. Estimation of Arrhenius Model parameters using 3 least-squares methods. J Food Process Pres 1985;9(3):129-143.
[12] Nelder JA, Mead R. A Simplex-Method for function minimization. Comput J 1965;7(4):308-313.
[13] Brandão TRS, Oliveira FAR. The influence of the temperature increase rate on the accuracy of diffusion parameters estimated under non-isothermal conditions. Int J Food Sci Tech 1997;32:63-72.
[14] Brandão TRS, Oliveira FAR, Cunha LM. Design of experiments for improving the precision in the estimation of diffusion parameters under isothermal and non-isothermal conditions. Int J Food Sci Tech 2001;36:291-301.