M
ESTRADO
Monetary and Financial Economics
T
RABALHO
F
INAL DE
M
ESTRADO
DISSERTAÇÃO
S
OVEREIGN
S
PREADS
,
M
ONETARY AND
F
ISCAL
P
OLICY
E
VENTS
:
E
VIDENCE FOR
EU
J
OSÉ
D
IOGO
G
AIVÃO DE
M
ELO
B
EIRÃO
M
ESTRADO EM
M
ONETARY AND
F
INANCIAL
E
CONOMICS
T
RABALHO
F
INAL DE
M
ESTRADO
DISSERTAÇÃO
S
OVEREIGN
S
PREADS
,
M
ONETARY AND
F
ISCAL
P
OLICY
E
VENTS
:
E
VIDENCE FOR
EU
J
OSÉ
D
IOGO
G
AIVÃO DE
M
ELO
B
EIRÃO
O
RIENTAÇÃO:
A
NTÓNIOA
FONSO3
Contents
1. Introduction ... 4
2. Literature Review ... 6
2.1. Sovereign Spreads determinants ... 6
2.2. Event Studies ... 10
3. Monetary and Fiscal Policy in the Context of the EU ... 12
4.Data and Variables ... 15
4.1. Sovereign spread determinants ... 15
4.2. Monetary and Fiscal events ... 16
5. Empirical analysis ... 21
5.1. Panel data estimation ... 21
5.2 Semi-unrelated regression (SUR) estimation ... 26
5.2. Spillover effects ... 28
6. Conclusions ... 29
4
SOVEREIGN SPREADS, MONETARY AND FISCAL POLICY EVENTS: EVIDENCE FOR THE EU
By José Diogo Beirão
This study provides an empirical analysis on how the communication of economic policy conducted by the ECB and the European Commission affects the European bond market. For this purpose, it was collected a set of periodic news from the beginning of the Euro until 2013, related with the monetary and fiscal policy events. The results of the study show that sovereign spreads reflect three sources of risk, credit risk through economic activity and competiveness, liquidity risk and international risk. The monetary events play a role in the bond market and they seem to be anticipated. On the other hand, fiscal policy events related with the “arms” of the SGP do not have a key role in this context.
1. Introduction
In 1989 the European Council reinforced the Commitment of a progressive economic and monetary integration within the European Economic Community member states. To this purpose it was constituted a committee that was represented by Jacques Delors, at that time president of the European Commission. The main goal of this committee was to study and propose an optimal path to develop an economic and monetary union. The study resulted in the report named as “Delors report”, which projected a three step process in order to achieve the monetary and economic union. The three steps were constituted as followed.
On step one, that started in the 1st of July of 1990, the targets were an increase of the economic convergence (price and exchange rate stability as well as sound public finances) between the member states, achieving total freedom of capital circulation, an increase in the co-ordination of central banks and free use of the European Currency Unit, which was created for accounting purposes in 1979 in the development of the European Monetary System.
5
Stage two started in the 1st of January of 1994, and projected the end of the Central Banks’s credit granting, an increase on the coordination of the monetary policies and stronger economic convergence. At this stage, it was created the European System of Central Banks, which presupposes the independence of the national Central Bank. In the preparation of the final step it was presented, in June of 1997, the Stability and Growth Pact (SGP) (the main aim is the surveillance of the member states public finances) and the European Central Bank (ECB), which was founded in the 1st of June of 1998.
The last stage was in the 1st of June of 1999, where the participants in the Euro fixed their exchange rates. The European System of Central Banks started to conduct a single monetary policy and the SGP was already fully implemented.
In line with the literature1 this study provides some insight about the impact of fiscal and monetary policy events on the European Union (EU) sovereign bond market. For this purpose, it is conducted an event study collecting monthly data (from 1:1999 until 12:2012) for 10 EU countries long-term government bond yield.
The empirical analysis is done both in a panel data estimation and for a country-by-country purpose we also use a seemingly unrelated regression (SUR) system of equations. According to the literature, a way to capture the effects of the events on the bond market is to consider the long-term government bond yield of a country vis-à-vis a benchmark. For the EU countries the German long-term yield is generally accepted as the benchmark. On the theoretical side, the control variables considered to explain the sovereign spreads were chosen to reflect essentially three features: Credit Risk, Liquidity Risk and International Risk aversion behavior.
6
Some important results of this study can be outlined as follows: sovereign spreads reflect the three sources of risk, credit risk through economic activity and competiveness, liquidity risk and international risk. Monetary events are playing a role in explaining sovereign spreads and markets seem to anticipate these events. Fiscal policy events related with the SGP are generally non-significant. On the other hand, the ones related with the financial assistance programs not only are affecting the countries where these programs were implemented but also present spillover effects.
This study is organized in five sections. After the introduction, section 2 gives a survey of the literature divided in the determinants of the sovereign spreads and the event studies, section 3 provides some insights about the monetary and fiscal policy conduction in the EU, section 4 presents some stylized facts about the data and variables, section 5 deals with the empirical analysis divided by panel estimation, SUR estimation and a further spillover effects study, finally section 6 concludes.
2. Literature Review
2.1. Sovereign Spreads Determinants
When studying sovereign spreads determinants, there are broadly three main drivers in the literature: a) credit risk b) liquidity risk and c) and international risk aversion.
When referring to credit risk, one can relate to risk of default associated with countries that have no conditions to comply with their financial obligations. This type of risk is linked with the specific country macroeconomic fundamentals, such as the evolution of economic indicators and fiscal soundness. The rational is when a country suffers a considerable worsening of their macroeconomic fundamentals (an abrupt fall of GDP or a rapid deterioration of public finances) that may lead to a default situation.
7
Derived from the problem of default, two more types of risk can be associated to the general category of credit risk. First, a risk associated with the re-pricing of bonds, i.e. the bond price of a country that is suffering from worst macroeconomic fundamentals is expected to fall, as a result of the worsening of the buyers’ perception of the bond value. Second, a risk related with the rating agencies power, which can shape market perception of the bond value, through a country rating downgrade or a worsening of country economic outlook.
The liquidity risk is associated with the ability of a bond to be sold or to be bought easily. The amount of newly traded bonds, national issuing policy and a liquid futures market (so that market participants can hedge their positions) are factors that will shape this type of risk. The common proxies to measure this type of risk are bid-ask spreads or the ratio between the total debt that issuer holds and the total debt issued in the EU market. This type of risk is highly interconnected with the credit risk.
The third type of risk, international risk aversion, is related with uncertainty. A high level of uncertainty tends to reduce the willingness of market participants to take risk. So, in times of great uncertainty one would expect a reallocation of investments from riskier assets towards safer assets, for example, a shift from the corporate bond market to the sovereign market, which is viewed as safer. A way to capture this effect can be done through a spread, such as between the yields of AAA US corporate bonds and the yield of the 10-year US government bonds or through indexes of the US stock market implied volatility.
The literature on the determinants of the sovereign spreads has addressed both the pre-crisis period and the crisis period.
In the group of studies covering the pre-crisis period there is some disagreement in the literature about the importance of the three sources of risk.
8
Evidence shows that credit risk is generally an important source of risk in this period. The macroeconomic fundamentals and the specific fiscal positions of the countries seem to be an important driver of spreads even after the EMU foundation (Afonso and Rault, 2010; Ardagna et al., 2004; Bernoth et al., 2004; and Codogno et al.,
2003). In the work done by Codogno et al. (2003) and Ardagna et al. (2004) the emphasis is on the fiscal position, the debt and deficit level, but Bernoth et al. (2004) pointed out that the main variable explaining the credit risk, more than government debt and the deficit level, is the debt service.
The start of the EMU only gave more power to the debt service, since the other sources of risk such as the debt level have showed a convergence path towards the benchmark. In addition, the work done by the Afonso et al. (2012) and Arghyrou and
Kontonikas (2012), in the pre-crisis period pointed out that markets did not seem to price the macro fundamentals with exception of the fiscal deficits. It appears that in the pre-crisis period for the EU, markets where essentially focused on pricing credit risk based on the fiscal deficit, and the implementation of the SGP only gave more emphasis to the fiscal deficit targets as it is pointed out by Arghyrou and Kontonikas (2012).
In terms of the liquidity risk there is a disagreement in the pre-crisis literature.
Afonso and Rault (2010),Favero et al. (2010) and Manganelli and Wolswijk (2009) report the importance of this source of risk to explain sovereign spreads, while Codogno et al.
(2003), is in disagreement, putting a higher weight in other risk sources. The lack of consensus continued with Favero et al. (2010), arguing that illiquidity is an additional source of risk since it creates transaction costs for investors who are holding less liquid securities, thus they should be compensated with a higher return given that they are bearing higher costs. Bernoth et al. (2004), for the period of the transition for the single currency, found out that after the euro implementation there was a great fall in the
9
importance of liquidity factors. The authors explained this evidence as a result of a higher financial integration within the EMU members.
In terms of international risk aversion for the pre-crisis period, Codogno et al.
(2003),Favero et al. (2010), and Manganelli and Wolswijk (2009) found evidence of an important role of this source of risk. Codogno et al. (2003) report that in some cases the international risk aversion is a function of a specific country debt level, so countries more indebted will be more exposed to this source of risk.
For the period during the international financial crisis, there is a general consensus in the literature that the fiscal position of the countries is one of the main drivers of sovereign spreads (Afonso et al., 2012; Arghyrou and Kontonikas, 2012; Attinasi et al., 2009; Caceres et al., 2010; Haugh et al., 2009; Schuknecht et al., 2010; and
Sgherri and Zoli, 2009). Afonso et al. (2012) and Caceres et al. (2010) argue that since the summer of 2007 markets have been continuously pricing bonds based on the basis of country specific macroeconomic fundamentals. This coincided with a reaction of investors known as “flight-to-quality” where the German Bund and some of the core European countries securities enjoyed a flux of capital arising from riskier securities.
Another agreement in the literature is related with the increased importance of the international risk aversion role (Afonso et al., 2012; Arghyrou and Kontonikas, 2012; Attinasi et al., 2009; Barrios et al., 2009; Caceres et al., 2010; Haugh et al., 2009;
Schuknecht et al., 2010; and Sgherri and Zoli, 2009). As mentioned before, the international risk aversion arises with an increase in uncertainty and in periods of financial tightening as mentioned by Codogno et al. (2003). Haugh et al. (2009) conjectured that in the period before the financial turmoil a low level of international risk aversion was obscuring the importance of the countries fiscal positions. Barrios et al. (2009) and Haugh et al. (2009) found that there was a significant interaction between
10
the international risk aversion and macro fundamentals, amplifying the role of fiscal positions to explain spreads.
2.2. Event Studies
In this section, it is going to be presented some of the latest developments in event analysis available in the literature, which we divide in three major groups: macroeconomic events, monetary events and rating news.
First, regarding macroeconomic events studies (Afonso and Strauch, 2007; Arru et al., 2012; and Andersen et al., 2005), there is a wide range of work done with different methodologies and goals. Arru et al. (2012) conducted a study including six countries from the EMU where the authors gauge about the impact of macroeconomic data releases from several macro-areas such as US, Japan and EU. Using weekly data for the period from 2005 until 2010, the treatment that the authors gave to the macroeconomic data released is an application of a method used by Balduzzi et al. (2001) and Andersen et al. (2005) where they compute the so called standardized news2. Their main findings are firstly a reaction by the sample countries, excluding Spain, from positive news in the US. Secondly, macroeconomic surprises on the Euro-area business cycle affect the volatility of the series for four of the six sample countries and these reactions are only captured by negative surprises.
Andersen et al. (2005) have studied the impact of macro news releases in the prices from six different futures markets3 in EU and US. Using daily data with a time span from 1998 until 2002 for the EU and 1992 until 2002 for the US, they found that bad macroeconomic news, using the same standardized news method as Arru et al.
2 Given by the difference between the news released of some variable from some macro-area at some
point in time minus the median value of the respective forecasts prevailing on financial markets and surveyed by Bloomberg. The result of this calculation it is divided by the historical standard deviation.
3 That includes US Treasure Bonds, S&P500, FTSE 100 index, British 10-year Treasury note, DJ Euro
11
(2012), have a negative impact during contractions, which it is expected, but in times of expansion they have a positive impact. Moreover, they also found significant cross-market and cross-country linkages, which points to the evidence of spillovers between equity markets from the EU and the US. Finally Afonso and Strauch (2007), assembled fiscal policy news released along the year 2002 and evaluated the impact of these news on the long-term bond market for 13 countries from the EU. Using daily data their main finding is that markets were not penalizing default risk premium as a consequence of the fiscal policy events.
Second, on monetary policy events literature gives some important insights about how markets react to central bank’s monetary policy. For the Euro area, Andersson et al. (2009) and Bernoth and Hagen (2004) found evidence in the German long-term bond market and in EURIBOR futures market that agents predict well the ECB´s monetary policy, reflecting transparency in ECB´s monetary policy conduction. Ehrmannp and Fratzscherp (2002) made an empirical analysis during the foundation of the EMU and pointed out that markets went through a learning process about ECB´s monetary policy. In recent years the increased role of M3 and the price level in explaining interest rate on the Euro area, achieved levels very similar to Germany prior the EMU. This suggests that markets have a perception about the ECB´s monetary policy very similar to the Bundesbank’s policies. Attinasi et al. (2009) analyzed the beginning of the crisis, in the period between 31 July of 2007 and 25 March of 2009, and concluded that the main refinancing operations announcements had a positive contribution for the narrowing of the sovereign spreads in the Euro area. Interestingly, Brand et al. (2006), for the money market yield, found that expectations from monetary policy change considerably during ECB´s press conferences. These changes apparently have a significant impact on the medium to long-term interest rates and immediate
12
policy decisions only affect shorter-term maturities. Andersson (2007), compares the ECB and FED monetary policy and concludes that both US bond and stock markets react more to the FED´s monetary policy decisions than respectively the Euro area bond and stock market react to the ECB´s monetary policy decisions.
Third, the literature about rating news for the Euro area presents evidence that there is a significant linkage between the long-term government bond market and rating revisions (Afonso et al., 2011; Afonso et al., 2012; Arezki et al., 2011; De Santis, 2012; Manganelli and Wolswijk, 2009). Afonso et al. (2011) found evidence that not only rating announcements but also outlook revisions have an impact on the Credit Default Swaps (CDS) spreads. Afonso et al. (2011) and Manganelli and Wolswijk (2009) reached the same result, concluding that sovereign downgrades seems to play a key role explaining the higher risk premium paid by the downgraded countries.
In addition, rating announcements do not seem to be anticipated by sovereign spreads as Afonso et al. (2011) findings, but it seems to exist contagion from the lower rated countries to the other Euro-area countries (Afonso et al., 2011; Afonso et al., 2012) and the source of this contagion seems to depend from which rating agency rated. The spillover effect seems to be stronger when the downgraded country is Greece (Afonso et al., 2012; De Santis, 2012) and the effect is particularly stronger on countries with weaker fiscal positions.
3. Monetary and Fiscal Policy in the Context of the EU
Since the European Monetary Union (EMU) foundation there was a centralization of monetary policy, conducted by the ECB in coordination with the national central banks with a clear mandate of achieving price stability. However fiscal
13
policy is still decentralized giving member states the ability to control their public expenditures and revenues. As mentioned, the introduction of the SGP gave a minimum quality standard to the fiscal framework of the member states.
The SGP is divided in “two arms” and it is constituted by a set of rules. These arms are known as the preventive and the corrective arm.
The preventive arm is constituted by the assessment of the programs that are annually delivered by the member states where there should be an outline of economic developments, macroeconomic evolution projections and the so called medium term budgetary objective (MTO). The MTO is defined in structural terms so it is cyclically adjusted, at some extent, filtered of temporary measures letting only the discriminatory ones account to this purpose. All member states have to present their MTO, which usually is updated at the end of three years. They should, as a reference value, achieve an annual evolution of 0,5% of the GDP in structural terms.
The member states’ MTO should be based essentially on three features. The existence of a safety margin against the breaching of the 3% deficit benchmark, a sustainable path for the debt ratio without neglecting the impacts of an aging population and leave some room for budgetary maneuvers in the case of a public investment need. For the analysis of the MTO, the Commission considers an ex ante and an ex post assessment.
In the context of the ex ante assessment the Commission has to consider if the MTO is appropriate in light of the minimum requirements, if the member state is at his MTO or is in the path towards it (taking in account the business cycle, the sustainability risk and if the assumptions on which the MTO is based are realistic).
In the ex post assessment the Commission will evaluate, if enough effort towards the MTO was made against the benchmark (0.5% in structural balance of the
14
GDP). If the Commission considers that exists a significant deviation from the MTO, it will give a warning to the concerned member state and the ECOFIN Council will recommend a set of measures to converge to the MTO path. If a country is a member of the Euro area and does not comply with the ECOFIN Council recommendations it is obliged to make an interest-deposit of 0,2% of the GDP as a sanction.
The corrective arm of the SGP works through the excessive deficit procedure (EDP) so the member states implement the necessary measures to correct the excessive deficit.
The ECOFIN Council launches an EDP essentially on an ex post assessment once it is triggered by the breach of one of two benchmarks. A deficit above 3% of GDP or a government debt higher than 60% of GDP and it is considered that is not diminishing at the right rhythm (1/20th per year).
A member state facing an EDP is given a dead line period of 6 months (3 months if there was a serious breach) to implement the recommended measures by the ECOFIN Council. At the end of the period the member state is evaluated. Based on the ability to implement the measures that have been recommended, the Commission and ECOFIN Council put the procedure on hold, or recommends a stepping up of the efforts.
If the Commission and ECOFIN Council understands that no effective action has been made, than it is prepared new recommendations and is possible to set a new dead line. New sanctions can be made for the Euro area countries, the fine is 0,2% of the GDP and the countries that are receiving the cohesion funds may find them suspended. The EDP is abrogated once the excessive deficit is corrected.
15
4. Data and Variables
4.1. Sovereign Spread Determinants
As it was mentioned, this study uses a panel estimation including 10 EU countries: Austria (AT), Belgium (BE), Spain (ES), Finland (FI), France (FR), Greece (GR), Ireland (IE), Italy (IT), the Netherlands (NL) and Portugal (PT).
The variables included to explain the long-term government bond yield spreads are the lags of 10-year government bond yield (spread), the industrial production growth index (gind), the real effective exchange rate (q), that were taken from the Eurostat web site, the expected government budget balance ratio (balance), the expected debt-to-GDP ratio (debt), which were collected from the European Commission twice a year seasonal forecasts, the 10 year government bond bid-ask spread (ba) that was provided by the ECB and the VIX (the logarithm of the S&P 500 volatility index) taken from Reuters.
The 10-year government bond yields, the industrial growth index, the real effective exchange rate and the VIX are monthly data. The expected government budget balance ratio and the expected debt-to-GDP are released in a biannually basis and transformed into monthly data by fixing their value during the six months until a new forecast is released. The bid-ask spread has a daily frequency and it is transformed into monthly data by taking the average of the corresponding month.
Following the literature, to construct the spread equation, the dependent variable chosen is the difference between the 10-year government bond yield of a given country and the benchmark that for the Euro area which is the 10-year government bond yield form Germany.
The growth of industrial production is employed as a difference to the benchmark. The goal of employing this variable is to measure the impact on spreads
16
from the evolution in the economic activity. So the expectation of a higher/lower economic activity has a negative/positive impact on the sovereign spreads.
The real effective exchange rate is in logs and also has a difference to the benchmark. This variable is associated with the credit risk and is used to weight the competitiveness of the countries. The rational is, when it is observed an/a increase/decrease in the real effective exchange rate, there is an/a appreciation/depreciation, so is expected a higher/lower sovereign spreads as demonstrated by Arghyrou and Tsoukalas (2011).
The expected budget balance ratio and the expected debt-to-GDP are also in difference to the one of the benchmark country and they represent the one-year ahead fiscal positions’ forecast of the European Commission. The goal of using forecasts is to measure credit quality. So, a deterioration of the expected fiscal positions implies a higher risk. A better (worst) expected fiscal position implies lower (higher) risk to sovereign spreads, which will diminish (increase) accordantly.
The 10-year bid-ask spread is normally used to measure liquidity in the bond market. So a higher (lower) bid-ask spread is expected to increase (decrease) the sovereign spreads.
The VIX is a measure of international risk aversion, and an increase (decrease) in the VIX is associated with a request of higher (lower) returns from the government bonds and thus an increase (decrease) of the sovereign spreads.
4.2. Monetary and Fiscal events:
To construct the monetary and fiscal events, we gathered 215 monetary events plus 288 fiscal events since January 1999 until December 2012, which gives a total of 503 events. The variables are constructed by flag procedure assuming that there are two types of events, positive and negative events, which means that a positive (negative)
17
event may lead to a lower (higher) sovereign spread. Using monthly data, when there is a positive or a negative event on a given month we attribute the values -1 or 1 respectively and 0 for the non-event months.
The monetary events where selected by collecting the interest rate policy announcements done by the ECB during the sample period.
Table 1 - Monetary policy announcements
MRO LF DF Total number of events 215 215 215 Total number of events evolving variations 37 36 34
Positive variations 18 18 18 Negative variations 19 18 16 Nº of increases, 25bp 16 16 16 Nº of decreases, 25bp 10 8 7 Nº of increases, 50bp 2 2 2 Nº of decreases, 50bp 8 8 7 Nº of decreases, ≥75bp 1 2 2
Note: MRO - Main Refinancing Operations; LF – Lending Facility; DF – Deposit Facility; bp – basis points. Source: European Central Bank
Table 1, describes the structure of the interest rate decision-making done by the ECB. Looking at the numbers one can understand two interesting features from the interest rate policy. First, the MRO is from the three policy interest rates the one which the object of more variations and second, when implementing monetary policy decisions the ECB apparently is more parsimonious with increases of the three rates when compared to decreases. This effect is visible given that 88.9% of the upward changes represent increases of 25bp whereas only 11.1% represent increases of 50bp. For negative variations, 25bp reductions account for 52.6% of the cases and 50bp reductions represent 42.1% from total variations. We can conclude that the strategy of the ECB seems to be opting for more mitigated negative impacts in the financial system from an abrupt increase in the interest rates. On the other hand, when facing an
18
economic slowdown, a more aggressive strategy of letting interest rates fall quickly to inject liquidity in the financial system seems to have been adopted.
The variable chosen to capture the monetary policy events will be the MRO and it will only be considered variations of this rate. Following Andersson et al. (2009) the yield to maturity of a representative bond can be decomposed, applying the Fisher decomposition principal, in the sum of the real interest rate, the expected average inflation (until the maturity of the bond) and a risk premium (that the investor asks in return for holding and bearing the risk associated to the asset). Given this hypothesis, we expect that when the ECB communicates an increase (decrease) in the MRO, the yield for a particular bond to rise (fall) and thus, to the spread increase (decrease). This effect on spreads is true, supposing that the benchmark bond yield is less susceptible to the ECB announcements when compared to the other sample countries. There are a total of 37 events, where 18 of them were considered negative for sovereign spreads receiving value 1 and 19 of them considered positive to spreads receiving the value -1. The fiscal policy events (see Tables A1, A2 and A3 in the Appendix)were assembled based on the EU fiscal surveillance mechanism and were taken from the European Commission website. As already described, the surveillance mechanism is based on the preventive and corrective arm. With the purpose of capturing the fiscal policy conduction in the EU the assembled events were divided in three groups.
One is related with the preventive arm where essentially, as the Appendix Table A1 highlights, is a set of events that is composed by press releases resulting from the Commission assessment of the stability and convergence programs. In the so called European semester, member states should present their stability and convergence programs until April of every year. The events gathered in our analysis cover the assessment done by the Commission, which evaluate the member states MTO’s and
19
gives country specific recommendations. In the sample period, for the 10 countries considered, there are a total of 15 events per country.
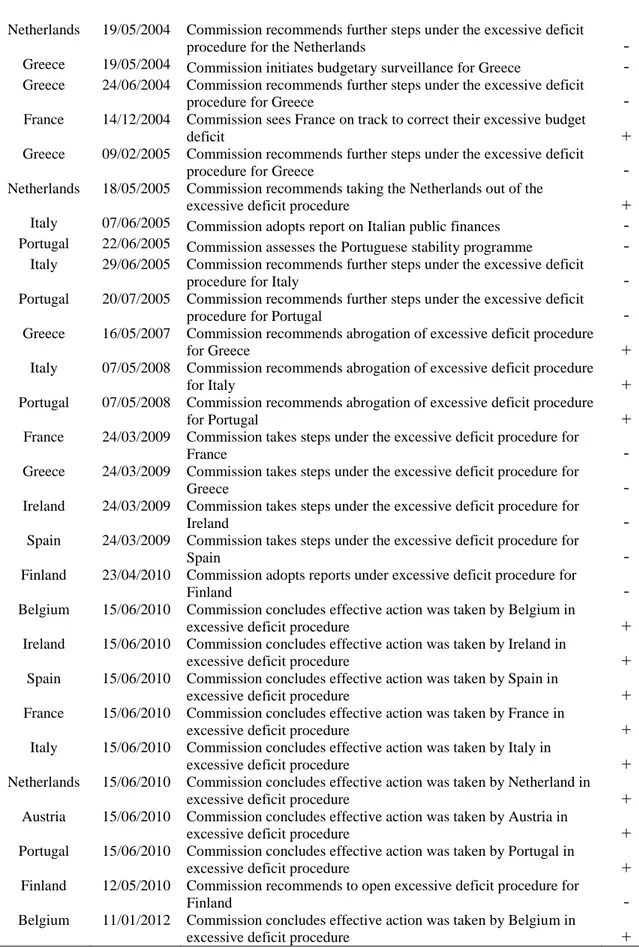
The second group which is linked with the corrective arm, is essentially composed by press releases related with the EDP´s that where implemented during the sample period (see Table A2). The EDP implementation in a member state normally starts with a press release with a first warning done by the Commission, alerting for a violation or a potential violation of the MTO. If the member state does not present measures to correct the imbalances or if the Commission believes that the presented measures are not ambitious enough, there is a press release informing that the Commission will proceed with the EDP. During the EDP the Commission gives a press release about the ability of the member state to implement the measures negotiated with the ECOFIN council and the Commission. At the end, if the necessary measures were implemented and the imbalances were corrected, there is a final statement where the Commission recommends to the ECOFIN council the abrogation of the EDP.
The final group of events is included in the fiscal policy events but is not related directly with the two arms of the SGP. The last group of events is associated with the financial assistance programs that were implemented in the countries that asked for financial rescue. The countries included in this group are Spain, Greece, Ireland and Portugal.
Spain received financial assistance in July of 2012 where it was agreed on a line of credit of €100 billion, but it was only used around €41.4 billion for recapitalization of financial institutions and the Spanish asset management company (Sareb).
In May of 2010 the Eurogroup agreed on the first financial assistance program to Greece, where €80 billion were provided through bilateral loans by the member states and the International Monetary Fund (IMF) participated with an additional €30 billion.
20
The second Economic adjustment program started in March of 2012, where the projected amount for the financial assistance until the end of 2014 is €164.5 billion, provided by the European Financial Stability Facility (EFSF) in co-ordinance with IMF.
Ireland’s economic and adjustment program was formally agreed in December of 2010. The total financial assistance to Ireland amounted to €85 billion, of which, a part provided by Ireland’s Treasury and National Pension Reserve Fund (€17.5 billion) and the bulk via external support (€67.5 billion), from the EFSF, the IMF, from bilateral loans (UK, Sweden and Denmark) and from the European Financial Stability Mechanism (EFSM).
In May of 2011 the Portuguese economic and stability program was negotiated between the Portuguese government, the ECB, the Commission and the IMF. The agreed amount for the financial assistance was €78 billion provided by the EFSM, EFSF and the IMF with €22.1 billion, €24.8 billion and €24.7 billion respectively. This group of events (see Table A3) comprises press releases related with the implementation and revisions of the different Economic Adjustment Programs of this set of countries.
To implement the flag procedure on fiscal events we attribute a rank based on the expectation that the impact of a particular event has on the sovereign spreads. An event can have one of three rankings: it can either be positive (+), negative (-) or inconclusive (#) (see Tables A1, A2 and A3). According to the ranking the flag will assume the value -1 if the ranking is positive, the value 1 if the ranking is negative and zero if the ranking is inconclusive.
The attribution of the rankings is based essentially on the MTO benchmark values (for the group related with the surveillances arm of the SGP) and subjective criteria of key words. Other authors propose such subjective methods applied to the ECB introductory monthly bulletin (see Heinemann and Ullrich (2005), Rosa and
21
Verga (2005) Gies (2005) and Gerlach (2004). Some key words for the press releases about the assessment of the stability and convergence programs by the Commission can go from “structural measures announced in the program are appropriate and in line with the Broad Economic Policy Guidelines” for positive news and “the updated program is not fully in line with the essential requirement of the Stability and Growth Pact” for negative news.
For the group related with the corrective arm events are essentially negative. When there is an announcement about the need to implement an EDP in a member state it is given a negative rank. During the assessment of the member state’s ability to implement the agreed measures, it can be ranked as negative or positive based on the country performance. When the Commission gives a press release suggesting the abrogation of the EDP to the ECOFIN council this is ranked as positive (an as contributing to reduce the yield spread). When dealing with the events related with the review missions in the financial assisted countries, news are in general positive, where the key words are “ the program is on track” or “ the government has reaffirmed the commitment to the program”. The only bad news for this group is press releases about the countries formal asking for financial assistance.
5. Empirical analysis 5.1. Panel data estimation
For the panel data analysis, we have conducted two different types of estimations for the following specification:
spreadit = β1 + β2spreadit-1 + β3gindit + β4qit + β5bait + β6balanceit + β7debtit + β8vixit +
22
To account for a possible endogeneity problem between the dependent variable and the explanatory variables we used in addition to the simple Ordinary least square (OLS) estimator also a Two-stage least square (2SLS) method, both with fixed effects and cross section-weights which account for cross-sectional heteroskedasticity.
Following the literature we have included on the right-hand side a lag of the sovereign spreads, since one has to account for the persistence that is inherent to the spreads. As mentioned by Afonso et al. (2012) the inclusion of the lagged spread is fundamental to avoid bias resulting from important omitted variables as Hallerberg and Wolff (2008) also pointed out, but the inclusion of the lagged spread can generate a different source of bias since this term can be correlated with the fixed effects (see Nickell, 1981).
Nevertheless, as noted for instance by Hallerberg and Wolff (2008), the bias originated from the correlation effect gets smaller as the time span of the panel increases and for samples over 20 periods, this effect is very small.
The panel considered in our analysis covers the period 1:1999 to 12:2012, giving a time dimension of T=167 which is enough to suspect that there is no bias arising from the introduction of the lagged term.
Regarding the variables used in the study, gindit andqit are the growth rate of
industrial production and the real effective exchange rate which represent the macroeconomic fundamentals measuring internal economic activity as well as competitiveness. bait denotes the 10-year government bond bid-ask spread and is a
proxy for bond market liquidity. balanceit and debtit denote the expected (forecasted)
fiscal position. In order to avoid possible bias resulting from a potential correlation between these two variables, they are not included together in the estimations. vixit
23
variables created to capture the events gathered. Decbt contains the events of monetary
policy. Dcspit is capturing the events of the surveillance arm from the SGP. Dedpit is
capturing the events of the corrective arm from the SGP. Dfapit is capturing the events
related with the financial assistance programs.
Table 2 – Modeling Sovereign Spreads Using OLS and 2SLS
OLS 2SLS (1) (2) (3) (4) β1 -0.249 -0.391 -1.082** -1.781*** (0.311) (1.077) (0.539) (0.545) sprit-1 0.957*** 0.959*** 0.962*** 0.968*** (0.006) (0.007) (0.009) (0.009) gindit -0.011*** -0.011*** -0.087*** -0.082*** (0.004) (0.016) (0.028) (0.027) qit 0.034 0.063 0.210* 0.355*** (0.066) (0.231) (0.112) (0.116) bait 0.002*** 0.002*** 0.001*** 0.001*** (0.000) (0.000) (0.000) (0.000) balanceit -0.002 -0.009** (0.002) (0.004) debtit 0.000 0.000 (0.001) (0.001) vixit 0.039*** 0.041*** 0.050*** 0.058*** (0.008) (0.033) (0.019) (0.018) Decbt 0.014** 0.015** 0.049** 0.049** (0.006) (0.025) (0.021) (0.020) Dedpit -0.029* -0.029 -0.095 -0.034 (0.018) (0.067) (0.093) (0.092) Dcspit 0.004 0.006 -0.048 -0.068 (0.011) (0.044) (0.081) (0.075) Dfapit 0.448*** 0.450*** 0.137 0.118 (0.065) (0.090) (0.202) (0.192) Ajd-R2 0.979 0.978 0.976 0.976 N 10 10 10 10 T 167 167 167 167
Note: The asterisks ***, **, * indicate significance at the 1, 5, 10% level respectively. The instrumental variables used are the second and third lags of spreads and the first four lags of the independent variables.
When observing the results of Table 2, it can be concluded that for the non-dummy group of variables the estimated parameters are in line with the attributed ranks. As expected, the lagged term appears highly significant and is the variable with more explanatory power, which is in accordance with high persistence that is associated with the sovereign spreads. Economic activity, liquidity and international risk in both
24
methods and models are always significant at 99% proving the key role that these factors have in determining the value which markets attribute to the government bonds. In terms of the variable that measures competiveness, different estimators give different results in terms of statistical significance, where OLS for both models 1 and 2 estimates this factor as non-significant, the 2SLS gives for both models statistical significance at least at 95% of confidence. Another interesting result is related with the expected fiscal position variables, where the expected government’s budget balance in the 2SLS estimation is statistically significant, which is in line with the literature on the post financial crisis.
For the dummy variables it is important to point out that for monetary policy, not only the sign is in line with the underlying rating (given the positive sign) of the events but this variable is also statistically significant, which implies that markets are incorporating ECB´s policy decision when pricing the bonds. For the dummy related with the EDP procedures the estimated sign was not according with expectations given the attributed ranks, since this variable appears with a negative impact which means that when it is attributed positive or a negative rank, the estimation is measures these ranks in the opposite way. In model (1) of OLS estimator, this variable appears statistical significant at 90% of confidence. The 2SLS for both models give an unexpected sign to the dummy related with the assessment of the convergence and stability programs, but this variable for all models is not statistically significant.
Finally, for the dummy that captures the events from the financial assistance programs, there is a great difference in the results from the different estimations. In the OLS estimations this variable is significant at 99% of confidence, where for the 2SLS models it appears non-significant.
25
Still in the panel estimation, it is done another exercise where is examined the prediction power of the sovereign bond market. To conduct this study we have introduced lags for the event dummies (see Table 3).
Table 3 – Modeling Sovereign Spreads, Testing Markets Prediction Power
OLS 2SLS 1 2 1 2 βit -0.450 -0.547* -1.238** -1.765*** (0.312) (0.304) (0.565) (0.564) sprit-1 0.961*** 0.962*** 0.964*** 0.969*** (0.007) (0.006) (0.009) (0.009) gindit -0.012*** -0.012*** -0.109*** -0.108*** (0.004) (0.004) (0.029) (0.028) qit 0.071 0.091 0.236** 0.348*** (0.067) (0.065) (0.118) (0.120) bait 0.002*** 0.002*** 0.001*** 0.001*** (0.000) (0.000) (0.000) (0.000) balanceit -0.001 -0.006 (0.002) (0.004) debtit 0.000 0.001 (0.001) (0.001) vixit 0.048*** 0.049*** 0.060*** 0.063*** (0.009) (0.008) (0.020) (0.018) Decbt 0.014** 0.014** 0.047** 0.039* (0.006) (0.006) (0.022) (0.021) Decbt-1 0.027*** 0.028*** 0.035*** 0.040*** (0.006) (0.006) (0.011) (0.010) Dedpit -0.038** -0.039** -0.160 -0.197* (0.018) (0.019) (0.114) (0.109) Dedpit-1 0.058*** 0.059*** 0.087*** 0.094*** (0.018) (0.019) (0.033) (0.032) Dcspit 0.007 0.007 -0.011 0.025 (0.011) (0.011) (0.092) (0.079) Dcspit-1 0.002 0.002 0.001 0.003 (0.011) (0.011) (0.019) (0.017) Dfapit 0.461*** 0.462*** 0.267 0.286 (0.065) (0.065) (0.200) (0.193) Dfapit 0.121* 0.122* 0.137* 0.140* (0.064) (0.065) (0.071) (0.071) Ajd-R2 0.979 0.979 0.976 0.975 N 10 10 10 10 T 167 167 167 167
Note: The asterisks ***, **, * indicate significance at the 1, 5, 10% level respectively. The instrumental variables used are the second and third lags of spreads and the first four lags of the independent variables.
Some important results arise from this exercise. For the events of monetary policy it seems that not only the signs are well estimated, and the lag term appears
26
statistically significant at 99% confidence for all models, independently from the estimator, which indicates that sovereign spreads anticipate well the future variations on the ECB interest rate announcements.
Another relevant result is that the lagged event dummies related with the EDP and the financial assistance programs appear with the expected sign. For the four models, independently from the estimator, they are statistically significant at 90% of confidence, which implies the possibility that the sovereign bond market anticipates these events. One could speculate that the information that is provided in these events is already from public domain, since that, for these particular events there is a lot of media cover and monitoring by a variety of different agents.
5.2 Seemingly Unrelated Regression Estimation
In this section we use a different approach for a country-by-country assessment, employing a SUR estimation. The idea is to try to capture how the different countries react to the different groups of events.
The SUR estimation is done by a system of equations enabling that different countries can have different coefficients but also that there is a contemporaneous correlation between the error terms associated with the individual equations.
Similar to the equation (1) the following specification was estimated:
spreadit = β1 + β2spreadt-1 + β3gindt + β4qt + β5bat + β6balancet + β7debtt + β8vixt +
β9Decbt + β10Dedpt + β11Dcspt + β12Dfapt + ut . (2)
The results presented in Table 4, show that the lagged term of the sovereign spreads still holds for every country as a fundamental variable. Economic activity only appears significant for Finland, France and the Netherlands, but for France the sign of the coefficient is not aligned with theory and this variable is only statistically significant in one of the models estimated.
27
Moreover, the competitiveness is not affecting the countries that suffered more with the crisis, (in this case Greece, Ireland and Portugal) but other sample countries since the variable qit is statistically significant at least 10% for countries like Austria,
Belgium, Finland, France, Italy and the Netherlands. Liquidity factors are only explaining sovereign spreads in the case of Belgium, Greece, Italy and Portugal. The fiscal position of the sample countries is affecting, as well, a small group of countries. Government budget balance seems an important factor in the case of Spain, Greece and Ireland which does not came as a surprise since this countries asked for financial assistance. Debt-to-GDP as presented in the results from the panel estimations appear with a residual role where only Finland and France have statistical significance for this variable, but the sign for Finland coefficient is not aligned with theory. International risk aversion factors appeared non-significant or in just only one model for the countries that received financial help.
In terms of the event dummies, the monetary events do not appear significant for any of the sample countries. The dummy related with the EDP events appeared significant for Belgium, Spain and Italy but once more with the non-expected negative sign. The estimated coefficient for the convergence and stability programs assessment are generally not significant and in the case of Austria appeared significant at 90% confidence, but with the wrong sign. Only for Finland this group of events appears to be important. The most interesting results appear from the group of financial assistance events, where they appeared significant at 99% of confidence for Spain, Ireland and Portugal.
For a better understanding of the impact from the event dummies, as it was done in the panel estimations, it is conducted an estimation of equation (2) including the lags of the event dummies (see Table 5).
28
The inclusion of the lagged term for the dummy related with the monetary events, show that sovereign spreads are in general anticipating this set of events with the exception of Greece, Ireland and the Netherlands. In case of Portugal, it seems that markets are anticipating these events but attributing an unexpected weight since the variable was estimated with a negative sign. For the other set of lagged dummies, they are generally not significant.
5.3. Spillover effects
As Afonso et al. (2012) and De Santis (2012) have showed, during the financial crisis it seems that there was some contagion effect in the Euro area long-term bond market from the lower rated countries that tend to have weaker fiscal positions to the high rated countries. In this last exercise, we present some estimation results to understand how did the events related with the financial assistance programs impacted the Euro area bond market, contributing for a better insight of the channels by which this contagion effects propagate.
With this idea in mind, the following SUR estimation was used:
spreadit = β1 + β2spreadt-1 + β3gindt + β4qt + β5bat + β6balancet + β7debtt + β8vixt +
β9Decbt + β10Dedpt + β11Dcspt + β12Dfapt + β13DfapESt + β14DfapESt-1 + β14DfapGRt +
β15DfapGRt-1 + β16DfapIEt + β17DfapIEt-1 + β18DfapPTt + β19DfapPTt-1 + ut. (3)
As Table 6 shows, the events related with Spain seems to affect the financial assisted countries plus Italy and France. Interestingly, these events do not have the same impact on different countries. Contemporaneously, this has a positive impact on all countries for which this dummy is statistically significant, but the lagged term appears negative which can be translated as markets speculating possible bad news for Spain. Consequently countries that are geographically closer as France or with weaker fiscal positions such as Greece and Ireland, where Portugal is affected in both ways.
29
From the financial assisted countries, Greece’s set of events presents more spillover effects. In general, the negative impact of both contemporaneously and lagged term has less effect in the countries with stronger fiscal positions such as Austria and Finland.
In the case of Ireland the spillover effects appeared contemporaneously significant and always with negative impact.
Finally, sovereign spreads seem to anticipate positively the impact of the review missions in Portugal. The number of countries affected contemporaneously by the events of the mission in Portugal are fewer and with different impacts. Belgium, Finland and France seem to be negatively affected by those events, but for Ireland it is the opposite way, by having a positive effect on sovereign spreads.
6. Conclusions
In this study we have analyzed the sovereign spreads determinants and how monetary and fiscal policy events in the context of European Union economic policy affect them.
In terms of sovereign spreads determinants, it seems that the liquidity factors, competitiveness, economic activity and international risk are the main drivers of spreads. The expected fiscal position of countries play a more marginal role, with expected budget balance showing more weight, when compared to the debt-to-GDP ratio, in shaping market participant’s perception of credit worthiness.
The impact from the assembled events in sovereign spreads can be summarized as follows.
The monetary events play a role in the bond market and they seem to be anticipated, which is in line with the findings of Andersson et al. (2009) and Bernoth
30
and Hagen (2004). Events of fiscal policy related with the “arms” of the SGP do not have a key role and with some non-expected results for the events assembled for the corrective arm of the SGP where markets seem to weight those events in the opposite way of the attributed rank.
When assessing the impact of events related to the financial assistance programs, we have found, not only they play a key role in explaining the financial assisted countries, but also there is evidence of spillover effects, that have mixed results depending on the countries. The overall results is a negative impact from these events on the countries that did not asked for financial assistance, and this effect seems to be widespread when the events are from the review mission in Greece.
31
7. References
Afonso, A. and Strauch, R. (2007). “Fiscal Policy Events and Interest Rate Swap Spreads: some Evidence from the EU”. Journal of International Financial Markets,
Institutions and Money, 17, 261-276.
Afonso, A., Arghyrou, M. and Kontonikas, A. (2012). “The Determinants of Sovereign Bond Yield Spreads in the EMU”. Department of Economics, ISEG-UTL, Working Paper 36/2012/DE/UECE.
Afonso, A. and Rault, C. (2010). “Short and Long-run Behavior of Long-term Sovereign Bond Yields”. CESifo Working Paper Series 3249.
Afonso, A., Gomes, P. and Rother, P. (2011). “Short- and Long-run Determinants of Sovereign Debt Ratings”. International Journal of Finance and Economics, 16, 1-15. Andersen, T.G., Bollerslev, T., Diebold, F.X., Vega, C. (2005). “Micro Effects of Macro An- nouncements: Real-Time Price Discovery in Foreign Exchange”, The
American Economic Review, 93(1), 38-62.
Andersson, M. (2007). “Using Intraday Data to Gauge Financial Market Responses to Fed and ECB Monetary Policy Decisions”. ECB Working Paper 726.
Andersson, M., Overby, L. J. and Sebestyén, S. (2009). "Which News Moves the Euro Area Bond Market?" German Economic Review, Verein für Socialpolitik, 10, 1-31, 02. Ardagna, S., Caselli, F. and Lane, T. (2004). “Fiscal Discipline and the Cost of Public Debt Service: Some Estimates for OECD Countries”. EBC Working Paper 411. Arezki, R., Candelon, B. and Amadou, N.R.S. (2011). “Sovereign rating news and financial market spillovers: Evidence from the European debt crisis”. IMF Working Paper 11/68.
Arghyrou, M.G. and Tsoukalas, J. (2011). “The Greek Debt Crisis: Likely Causes, Mechanics and Outcomes”. The World Economy, 34, 173-191.
32
Arghyrou, M.G. and Kontonikas, A. (2012). “The EMU Sovereign Debt Crisis: Fundamentals, Expectations and Contagion”. Journal of International Financial
Markets, Institutions and Money, 22, 658-677.
Arru, D., Iacovoni, D., Monteforte, L. and Pericoli, F., (2012) “EMU Sovereign Spreads and Macroeconomic News”. MPRA Paper No. 37200.
Attinasi, M-G., Checherita, C., and Nickel, C. (2009). “What Explains the Surge in Euro Area Sovereign Spreads During the Financial Crisis of 2007-09?”. ECB Working Paper 1131.
Balduzzi, P., Elton, E. E., Green, T. C. (2001). “Economic News and Bond Prices: Evidence from the U.S. Treasury Market”, Journal of Financial and Quantitative
Analysis, 36(4), 523-543.
Barrios, S., Iversen, P., Lewandowska, M., and Setzer, R. (2009). “Determinants of Intra-euro-area Government Bond Spreads During the Financial Crisis”. European Commission, Economic Papers 388.
Bernoth, K. and Hagen, J. (2004). “The Euribor Futures Market: Efficiency and the Impact of ECB Policy Announcements”. International Finance, 7(1), 1-24.
Bernoth, K., von Hagen, J., Schuknecht, L. (2004). “Sovereign risk Premia in the European Government Bond Market”. ECB Working Paper 369.
Brand, C., Buncic, D. and Turunen, J. (2006). “The Impact of ECB Monetary Policy Decisions and Communication on the Yield Curve”. ECB Working Paper 657.
Caceres, C., Guzzo, V., Segoviano, M. (2010). “Sovereign Spreads: Global Risk Aversion, Contagion or Fundamentals?”. IMF Working Paper 10/120.
Codogno, L., Favero, C., Missale, A. (2003). “Yield Spreads on EMU Government Bonds”. Economic Policy, 18, 211-235.
33
De Santis, R. (2012). “The Euro Area Sovereign Debt Crisis: Safe Haven, Credit Rating Agencies and the Spread of the Fever from Greece, Ireland and Portugal”. ECB Working Paper 1419.
Ehrmann, M. and Fratzscher, M. (2002). “Interdependence Between the Euro Area and the US: What Role For EMU?” ECB Working Paper 0200.
Favero, C., Pagano, M., and von Thadden, E.-L. (2010). “How Does Liquidity Affect Government Bond Yields?”. Journal of Financial and Quantitative Analysis, 45, 107-134.
Gerlach, S. (2004): “Interest Rate Setting By the ECB: Words and Deeds.” CEPR Discussion Paper No. 4775.
Gies, M. (2005): “Do ECB’s Statements Steer Short-Term and Long-Term Interest Rates in the Euro-Zone?” Unpublished Manuscript.
Hallerberg, M., Wolff, G.B. (2008). “Fiscal Institutions, Fiscal Policy and Sovereign Risk Premia in EMU”. Public Choice, 136, 379-396.
Haugh, D., Ollivaud, P., Turner, D. (2009). “What Drives Sovereign Risk Premiums? An Analysis of Recent Evidence From the Euro Area”. OECD Economics Department Working Paper No. 718.
Heinemann, F. and Ullrich, K. (2005): “Does it Pay to Watch Central Bankers Lips? The Information Content of ECB Wording.” ZEW Working Paper No. 05-70.
Manganelli, S., Wolswijk, G. (2009). “What drives Spreads in the Euro-area Government Bond Market?”. Economic Policy, 24, 191-240.
Nickell, S. (1981). “Biases in Dynamic Models With Fixed Effects”. Econometrica, 49, 1417-1426.
34
Schuknecht, L., von Hagen, J., Wolswijk, G. (2010). “Government Bond Risk Premiums in the EU Revisited: The Impact of the Financial Crisis”. ECB Working Paper 1152.
Sgherri, S., Zoli, E. (2009). “Euro Area Sovereign Risk During the Crisis”. IMF Working Paper 09/222.
Rosa, C. and G. Verga (2005): “The Importance of the Wording of the ECB.” CEP Discussion Paper No. 694.
Appendix.
Figure A1 - Events of Preventive Arm from the SGP
Country Date Description Rank Greece 30/09/1998 Commission assesses the Greek convergence programme + Finland 30/09/1998 Commission assesses Finland's stability programme + Netherlands 25/11/1998 Commission assesses the Dutch stability programme + Ireland 12/01/1999 Commission assesses Irish stability programme + Austria 12/01/1999 Commission assesses the Austrian stability programme + Portugal 03/02/1999 Commission assesses the Portuguese stability programme + Italy 03/02/1999 Commission assesses Italy's stability programme # France 16/02/1999 Commission assesses the French stability programme + Spain 16/02/1999 Commission assesses the Spanish stability programme + Belgium 16/02/1999 Commission assesses the Belgian stability programme + Netherlands 18/01/2000 Commission assesses the Dutch stability programme + Ireland 18/01/2000 Commission assesses Irish stability programme + Finland 18/01/2000 Commission assesses Finland's stability programme +
35
Greece 18/01/2000 Commission assesses the Greek convergence programme + Spain 15/02/2000 Commission assesses the Spanish stability programme +
Italy 15/02/2000 Commission assesses Italy's stability programme + Belgium 15/02/2000 Commission assesses the Belgian stability programme + Portugal 08/03/2000 Commission assesses the Portuguese stability programme + France 08/03/2000 Commission assesses the French stability programme + Austria 26/04/2000 Commission assesses the Austrian stability programme - Finland 15/11/2000 Commission assesses Finland's stability programme + Netherlands 15/11/2000 Commission assesses the Dutch stability programme +
Austria 24/01/2001 Commission assesses the Austrian stability programme + Greece 24/01/2001 Commission assesses the Greek Stability programme + Italy 24/01/2001 Commission assesses Italy's stability programme +
France 24/01/2001 Commission assesses the French stability programme + Ireland 24/01/2001 Commission assesses Irish stability programme # Portugal 28/02/2001 Commission assesses the Portuguese stability programme -
Spain 28/02/2001 Commission assesses the Spanish stability programme + Belgium 28/02/2001 Commission assesses the Belgian stability programme + Netherlands 15/01/2002 Commission assesses the Dutch stability programme + Finland 15/01/2002 Commission assesses Finland's stability programme +
Austria 15/01/2002 Commission assesses the Austrian stability programme + Belgium 15/01/2002 Commission assesses the Belgian stability programme + Portugal 30/01/2002 Commission assesses the Portuguese stability programme -
Greece 30/01/2002 Commission assesses the Greek stability programme + Spain 30/01/2002 Commission assesses the Spanish stability programme + Ireland 30/01/2002 Commission assesses Irish stability programme + Italy 30/01/2002 Commission assesses Italy's stability programme # France 30/01/2002 Commission assesses the French stability programme + France 08/01/2003 Commission assesses the French stability programme - Finland 08/01/2003 Commission assesses Finland's stability programme +
Greece 08/01/2003 Commission assesses the Greek Stability programme # Italy 08/01/2003 Commission assesses Italy's stability programme - Spain 30/01/2003 Commission assesses the Spanish stability programme + Ireland 30/01/2003 Commission assesses Irish stability programme + Belgium 30/01/2003 Commission assesses the Belgian stability programme + Portugal 19/02/2003 Commission assesses the Portuguese stability programme + Austria 30/04/2003 Commission assesses the Austrian stability programme #
Netherlands 24/06/2003 Commission assesses the Dutch stability programme + Austria 07/01/2004 Commission assesses the Austrian stability programme # Finland 07/01/2004 Commission assesses Finland's stability programme +
Greece 28/01/2004 Commission assesses the Greek Stability programme # Netherlands 28/01/2004 Commission assesses the Dutch stability programme # Ireland 28/01/2004 Commission assesses Irish stability programme # Italy 28/01/2004 Commission assesses Italy's stability programme # France 28/01/2004 Commission assesses the French stability programme # Portugal 18/02/2004 Commission assesses the Portuguese stability programme # Spain 18/02/2004 Commission assesses the Spanish stability programme #
Belgium 18/02/2004 Commission assesses the Belgian stability programme # Netherlands 11/01/2005 Commission assesses the Dutch stability programme # Austria 11/01/2005 Commission assesses the Austrian stability programme -
36
Finland 02/02/2005 Commission assesses Finland's stability programme + France 02/02/2005 Commission assesses the French stability programme #
Ireland 02/02/2005 Commission assesses Irish stability programme + Italy 02/02/2005 Commission assesses Italy's stability programme - Spain 16/02/2005 Commission assesses the Spanish stability programme + Portugal 22/06/2005 Commission assesses the Portuguese stability programme -
Finland 11/01/2006 Commission assesses Finland's stability programme + Belgium 01/02/2006 Commission assesses the Belgian stability programme + Austria 01/02/2006 Commission assesses the Austrian stability programme +
Italy 22/02/2006 Commission assesses Italy's stability programme + France 22/02/2006 Commission assesses the French stability programme # Greece 22/02/2006 Commission assesses the Greek Stability programme #
Ireland 22/06/2005 Commission assesses Irish stability programme + Netherlands 22/02/2006 Commission assesses the Dutch stability programme + Portugal 22/02/2006 Commission assesses the Portuguese stability programme # Spain 22/02/2006 Commission assesses the Spanish stability programme + France 23/01/2007 Commission assesses the French stability programme + Italy 23/01/2007 Commission assesses Italy's stability programme # Netherlands 23/01/2007 Commission assesses the Dutch stability programme +
Finland 07/02/2007 Commission assesses Finland's stability programme + Ireland 07/02/2007 Commission assesses Irish stability programme + Greece 13/02/2007 Commission assesses the Greek Stability programme +
Portugal 13/02/2007 Commission assesses the Portuguese stability programme + Belgium 07/03/2007 Commission assesses the Belgian stability programme + Spain 07/03/2007 Commission assesses the Spanish stability programme + Austria 30/05/2007 Commission assesses the Austrian stability programme # Finland 23/01/2008 Commission assesses Finland's stability programme + Netherlands 23/01/2008 Commission assesses the Dutch stability programme # France 30/01/2008 Commission assesses the French stability programme -
Italy 30/01/2008 Commission assesses Italy's stability programme - Austria 13/02/2008 Commission assesses the Austrian stability programme + Portugal 13/02/2008 Commission assesses the Portuguese stability programme # Ireland 19/02/2008 Commission assesses Irish stability programme # Greece 19/02/2008 Commission assesses the Greek Stability programme -
Spain 19/02/2008 Commission assesses the Spanish stability programme + Belgium 11/06/2008 Commission assesses the Belgian stability programme -
Ireland 18/02/2009 Commission assesses Irish stability programme - Greece 18/02/2009 Commission assesses the Greek Stability programme - Spain 18/02/2009 Commission assesses the Spanish stability programme -
France 18/02/2009 Commission assesses the French stability programme - Finland 18/02/2009 Commission assesses Finland's stability programme + Netherlands 18/02/2009 Commission assesses the Dutch stability programme + Italy 25/02/2009 Commission assesses Italy's stability programme # Portugal 25/02/2009 Commission assesses the Portuguese stability programme # Belgium 24/06/2009 Commission assesses the Belgian stability programme -
Austria 24/06/2009 Commission assesses the Austrian stability programme #
Greece 03/02/2010 Commission assesses the Greek Stability programme - Belgium 17/03/2010 Commission assesses the Belgian stability programme - Ireland 17/03/2010 Commission assesses Irish stability programme -
37
France 17/03/2010 Commission assesses the French stability programme - Italy 17/03/2010 Commission assesses Italy's stability programme -
Netherlands 17/03/2010 Commission assesses the Dutch stability programme - Austria 17/03/2010 Commission assesses the Austrian stability programme - Finland 17/03/2010 Commission assesses Finland's stability programme # Portugal 14/04/2010 Commission assesses the Portuguese stability programme # Austria 07/06/2011 Commission assesses the Austrian stability programme - Belgium 07/06/2011 Commission assesses the Belgian stability programme - Finland 07/06/2011 Commission assesses Finland's stability programme +
France 07/06/2011 Commission assesses the French stability programme - Greece 07/06/2011 Commission assesses the Greek Stability programme #
Spain 07/06/2011 Commission assesses the Spanish stability programme #
Italy 07/06/2011 Commission assesses Italy's stability programme - Netherlands 07/06/2011 Commission assesses the Dutch stability programme - Portugal 07/06/2011 Commission assesses the Portuguese stability programme #
Ireland 07/06/2011 Commission assesses Irish stability programme # Belgium 30/05/2012 Commission assesses the Belgian stability programme # Ireland 30/05/2012 Commission assesses Irish stability programme # Greece 30/05/2012 Commission assesses the Greek Stability programme #
Spain 30/05/2012 Commission assesses the Spanish stability programme # France 30/05/2012 Commission assesses the French stability programme -
Italy 30/05/2012 Commission assesses Italy's stability programme +
Netherlands 30/05/2012 Commission assesses the Dutch stability programme - Austria 30/05/2012 Commission assesses the Austrian stability programme - Portugal 30/05/2012 Commission assesses the Portuguese stability programme #
Finland 30/05/2012 Commission assesses Finland's stability programme +
Source: European Commission
Figure A2 – Events of Corrective Arm from the SGP
Country Date Description Rank Greece 10/11/1999 Commission recommends abrogation of Council decision on the
existence of an excessive deficit in Greece + Portugal 16/10/2002 Commission considers that an excessive government deficit exists
in Portugal -
France 19/11/2002 Commission recommends to the Council to address an early
warning to France - France 02/04/2003 Commission adopts report on government finances in France as a
first step of the Excessive Deficit Procedure - France 07/05/2003 Commission considers that an excessive government deficit exists
in France -
France 08/10/2003 Commission proceeds with excessive deficit procedure for France - Portugal 28/04/2004 Commission recommends abrogation of Council decision on the
existence of an excessive deficit in Portugal + Netherlands 28/04/2004 Commission proposes new steps in budgetary surveillance for
Netherlands -