UNIVERSIDADE DE LISBOA
FACULDADE DE CIÊNCIAS
DEPARTAMENTO DE BIOLOGIA ANIMAL
Genetic diversity and population structure
in the Iberian endangered Iberochondrostoma lemmingii
(Steindachner, 1866)
Miguel Antunes Lopes da Cunha
Mestrado em Biologia da Conservação
UNIVERSIDADE DE LISBOA
FACULDADE DE CIÊNCIAS
DEPARTAMENTO DE BIOLOGIA ANIMAL
Genetic diversity and population structure
in the Iberian endangered Iberochondrostoma lemmingii
(Steindachner, 1866)
Miguel Antunes Lopes da Cunha
Dissertação orientada por:
Professora Doutora Maria Manuela Coelho
Doutora Maria Ana Aboim
Mestrado em Biologia da Conservação
i
AGRADECIMENTOS
À professora Maria Manuela Coelho por me ter aceitado como seu mestrando e guiado na execução desta tese.
À Maria Ana Aboim pela sua co-orientação e ajuda na resolução dos problemas mais práticos da tese.
Ao Miguel Santos, Filipa Filipe, Maria Drago e Filipe Ribeiro pela captura dos exemplares utilizados.
À Mónica e à Ana Rita sempre disponíveis para tirar qualquer duvida estatística e funcionamento dos software.
À Silke, Isa e Margarida que tanto aturaram a minha falta de prática laboratorial, sempre disponíveis para tirar qualquer dúvida.
À Dona Branca sempre prestável e sempre pronta a resolver qualquer problema.
Ao Tomás pelas conversas e companhia ao almoço.
À Bárbara por partilhar o desespero à medida que a data de entrega se aproximava.
Um especial obrigado à Professora Maria Manuela Coelho, à Maria Ana Aboim, ao Miguel Santos e à Bárbara pelas suas incansáveis revisões da dissertação.
ii
RESUMO
A região mediterrânica é considerada um dos 25 “hotspots” mundiais, devendo, assim, ser encarada como prioritária para a conservação. Dentro desta região encontra-se o Sul da Península Ibérica que apreencontra-senta um elevado número de endemismos, a grande maioria dos quais se encontra ameaçada. O género Iberochondrostoma, corresponde a um dos géneros endémicos de peixes dulciaquícolas da família Cyprinidae que pode ser encontrado na Península Ibérica, sendo representado por quatro espécies, todas com estatuto de ameaça. Destas espécies, Iberochondrostoma lemmingii, a única para a qual não existe qualquer estudo de genética populacional em Portugal, encontra-se distribuída nas grandes bacias Ibéricas dos rios Tejo, Guadiana e Guadalquivir e nas pequenas bacias hidrográficas de Odiel, Quarteira, Gilão e Almargem. Dado que a sua distribuição dentro destas bacias é muito fragmentada, põe-se a hipótepõe-se de que a espécie põe-se encontre numa situação ainda mais preocupante em termos de viabilidade do que a que é sugerida pelo estatuto de conservação “Em Perigo” que foi atribuído às populações portuguesas.
Trata-se de uma espécie que pode ser encontrada em rios e ribeiras de carácter temporário, o que leva à ocorrência de “bottlenecks” das populações durante o Verão, quando o seu habitat fica reduzido a pequenos pegos. A variação anual do número de efectivos leva, assim, a perdas de diversidade genética que podem vir a comprometer o potencial evolutivo da espécie. O facto de esta espécie não ser encontrada em albufeiras é também um factor muito importante a considerar, principalmente, com a construção de novas barragens, como, por exemplo, a Barragem do Alqueva que levou, eventualmente, ao aumento da fragmentação das populações do Guadiana.
Vários estudos já foram efectuados noutras espécies de ciprinídeos demonstrando que as mesmas se encontram bastante ameaçadas principalmente devido a fragmentação de habitats, introdução de espécies invasoras, poluição de águas, construção de barragens e capturas ilegais de águas. Espécies que habitam o mesmo ambiente estão sujeitas aos mesmos constrangimentos ecológicos, sendo, assim, de especial importância compreender a condição genética das populações de outras espécies simpátricas com I. lemmingii, de modo a obter uma perspectiva mais alargada e uma melhor interpretação dos padrões de variabilidade genética encontrados na espécie em estudo.
iii Populações de I. lemmingii compreendidas na sua área de distribuição em Portugal foram amostradas com o objectivo de delinear um plano para a sua gestão. Dos exemplares amostrados foram retiradas pequenas porções das barbatanas pélvicas para extracção e análise de ADN, com o objectivo de se obter dados sobre a variabilidade genética, filogeografia e história demográfica da espécie, através da análise do gene mitocondrial do citocromo b e vários loci de microssatélites.
Estes marcadores encontram-se entre os mais usados em estudos de Genética da Conservação, principalmente devido ao facto de, presumivelmente, não serem afectados por fenómenos de selecção, sendo sua diversidade resultante da interacção entre fenómenos de mutação e deriva genética, o que proporciona uma descrição mais correcta dos fenómenos que deram origem ao actual estatuto de conservação de uma espécie ou população. Ambos os marcadores são obtidos por reacções de PCR (Polimerase Chain Reaction), sendo apenas necessária uma pequena porção de ADN que pode ser obtida através de processos de amostragem não invasivos, o que é de especial importância no estudo de espécies ameaçadas.
De modo a compreender a variabilidade e a estrutura genética de I. lemmingii, indivíduos de cinco localidades diferentes foram amostrados: Rio Caia e Ribeira de Foupana (bacia hidrográfica do Guadiana, respectivamente, N=51 e N=45), Ribeira de Quarteira (bacia hidrográfica de Quarteira, N=42), Rio Aravil (bacia hidrográfica do Tejo, N=34) e Rio Almargem (bacia hidrográfica de Almargem, N=15). Todos os indivíduos foram genotipados para um total de 7 loci microssatélites, tendo-se ainda sequenciado 1013 pares de bases do gene mitocondrial do citocromo b para um total de 63 indivíduos (14 de Foupana, 13 de Caia, 12 de Quarteira, 13 de Aravil e 12 de Almargem).
Os resultados apontaram para a ocorrência de maior variabilidade nas populações de I. lemmingii quando comparadas com as outras espécies de ciprinídeos presentes no Sul de Portugal para as quais já foram efectuados estudos de genética das populações. A amostra de Foupana, proveniente da região Sul do Guadiana, revelou os maiores níveis de variabilidade, tanto em termos de diversidade haplotídica como em termos de riqueza alélica. Já a amostra de Quarteira, apresentou apenas um haplótipo, não tendo esta baixa variabilidade sido corroborada pelos dados dos microssatélites que demonstraram o segundo maior valor em termos de heterozigotia esperada. Embora todos os valores pairwise de FST tenham sido significativos, o que revela a existência de
iv amostras de Quarteira e Almargem não foram significativos, o que pode ser indicativo de uma origem comum mais recente em relação às restantes amostras. De facto, os valores de FST e ΦST revelaram uma estruturação significativa entre as amostras de Caia
e Foupana, ambas pertencentes à bacia hidrográfica do Rio Guadiana tendo esta sido suportada pelos resultados obtidos com o programa STRUCTURE que agrupou as amostras do Caia (região Norte do rio Guadiana) com as amostras do Aravil (bacia hidrográfica do rio Tejo) e as amostras do Foupana (região Sul do rio Guadiana) com as amostras de Almargem (uma pequena bacia hidrográfica da região Sul de Portugal). A estrutura observada no interior da bacia hidrográfica do rio Guadiana pode ser explicada tanto pela baixa mobilidade de I. lemmingii, como pelo limite de intrusão de águas marinhas no rio principal, impossibilitando, assim, a existência de fluxo genético entre espécies de diferentes tributários, o que, consequentemente, leva a um aumento da diferenciação entre as populações aí presentes devido a fenómenos de deriva genética. No entanto, a aparente fraca diferenciação entre populações de diferentes bacias indica a existência de uma estrutura populacional que não é definida pelos limites das próprias bacias hidrográficas, um caso que não se encontra em concordância com a maioria dos resultados obtidos para outras espécies de ciprinídeos, especialmente aquelas já estudadas no sul de Portugal. Esta baixa diferenciação entre populações de diferentes bacias pode ser explicada pela história das mesmas: por exemplo, as bacias hidrográficas do Tejo e Guadiana estiveram ligadas até há 80 000 anos, o que pode explicar a baixa diferenciação das populações presentes em ambas as bacias. Uma origem comum para as populações das bacias hidrográficas de Quarteira e Almargem é também proposta através da análise da rede de haplótipos criada que demonstra uma grande semelhança entre ambas as amostras. Para além disso, uma vez que os haplótipos presentes nestas bacias parecem ter tido origem nos encontrados na amostra de Foupana, é ainda possível que as mesmas partilhem uma origem comum com a população da bacia hidrográfica do Rio Guadiana.
Assim, tendo em conta os resultados obtidos, todas as populações amostradas foram sugeridas como MU‟s (Management Units sensu Moritz, 1994) diferentes.
Palavras chave:
Sul da Península Ibérica; Cyprinidae; Iberochondrostomav
ABSTRACT
The Mediterranean region is considered one of the 25 global hotspots for biodiversity. The south, of the Iberian Peninsula, is part of this hotspot and holds a great number of endemic species, most of which are currently threatened. The genus
Iberochondrostoma belonging to the Cyprinidae family is currently represented by four
species, all of them threatened. Of these, I. lemmingii is the only one with any type of genetic study for conservation purposes. This species occurs in the Tagus, Guadiana and Guadalquivir large Iberian drainages as well as in the smaller basins of Quarteira, Gilão, Almargem and Odiel.
The mitochondrial citochrome b gene and seven microsatellite loci were used to investigate the genetic variability and differentiation of samples from Aravil (Tagus drainage), Caia and Foupana (Guadiana drainage), Almargem and Quarteira (both small Mediterranean type drainages).
The obtained results revealed higher levels of genetic variation in I. lemingii than those previously described for other cyprinid species in the south region of Portugal. The Foupana population from the Guadiana basin revealed the higher levels of haplotype diversity and allelic richness and the Quarteira population, presented only one mitochondrial haplotype despite high allelic diversity for microsatellites. Despite a high degree of differentiation between all samples, the population structure for I. lemmingii revealed a strong intra-drainage differentiation as well as some inter-drainage similarities, with the samples from Caia (northern Guadiana drainage) being more similar to the samples from Aravil (Tagus drainage) than to the samples of Foupana (southern Guadiana drainage). Although the differentiation within the Guadiana drainage was expected as it had already been reported for A. hispanica, the seemingly week inter-drainage differentiation contrasts with what has been reported for other cyprinids species in the southern region of Portugal. Although all pairwise FST values
were significant, the ΦST values for the comparison between Quarteira and Almargem
were non significant, which might be indicative of a common origin. No evidences of bottlenecks were detected and the expansion events that were detected seem to correspond to inter-glacial periods. With the obtained results it was suggested that all populations should be considered different MUs (Management Units).
vi
Keywords:
Iberian Peninsula South; Cyprinidae; I. lemmingii; Conservation Genetics; microsatellite; mitochondrial DNA.vii
CONTENTS
1. INTRODUCTION ... 1
1.1 Cyprinidae: Origin and diversity in the Iberian Peninsula ... 1
1.2 The Iberochondrostoma genus... 3
1.2.1 Iberochondrostoma lemmingii ... 3
1.3 Conservation genetic studies ... 5
1.3.1 Molecular markers in Conservation Genetics ... 5
1.3.2 Conservation Units ... 6
1.3.3 Conservation studies in endangered Iberian cyprinids ... 7
1.4 Objectives ... 9 2. METHODS ... 10 2.1 Sampling ... 10 2.2 Laboratory Procedures ... 11 2.2.1 Mitochondrial DNA ... 11 2.2.2 Microsatellites ... 11 2.3 Statistical Analysis ... 14 2.3.1 Genetic diversity ... 14 2.3.2 Population Structure ... 16 2.3.3 Demographic History ... 19 3. RESULTS ... 21 3.1 Genetic diversity ... 21 3.1.1 Mitochondrial DNA ... 21 3.1.2 Microsatellites ... 22 3.1 Population Structure ... 25 3.1.1 Mitochondrial DNA ... 25 3.3.2 Microsatellites ... 29 3.3 Demographic history ... 34 3.3.1 Mitochondrial DNA ... 34 3.3.2 Microsatellites ... 37
4. DISCUSSION AND FINAL REMARKS ... 38
4.1 Genetic Diversity ... 38
4.2 Genetic Structure ... 39
4.3 Demographic history ... 40
4.4 Implications for Conservation ... 41
5. REFERENCES ... 44
1
1. INTRODUCTION
The Circum-Mediterranean region is characterized by a great number of endemic species and, simultaneously, excessive losses of habitat, which qualifies it as one of the 25 biodiversity hotspots for conservation priority (Myers et al., 2000). Only 4.7% of the original 2 362 000 km2 of primary vegetation of this region remain and only 42 123 km2 (38.3%) are considered protected. The Circum-Mediterranean region comprises a total of 770 species of terrestrial vertebrates, 235 of which are endemic (0.9% of all terrestrial vertebrates species), and 25.000 plant species of which 13 000 are endemic (4.3% of all plants species) (Myers et al., 2000).
The Iberian Peninsula, isolated from the rest of Europe by the Pyrenees, has a total area of 581 000 km2 providing habitat for a total of 64 different native fish species (forty of which are primary species, five secondary species and 13 peripheral species, i.e. saltwater tolerant) across eleven biogeographical provinces (Filipe et al., 2009), with its southern range, integrant part of the Circum-Mediterranean hotspot, harboring the majority of its endemic species, adding special scientific and conservationist relevance to this region.
1.1 Cyprinidae: Origin and diversity in the Iberian Peninsula
Cyprinids represent the largest freshwater fish family and the second largest of all fishes in the world, containing approximately 2010 species (Helfman et al., 1997). The Asian southeast presents the largest diversity in number of Cyprinid species, followed by Africa, North America and Europe (Helfman et al., 1997).
There are currently three biogeographical hypotheses to explain the origin and diversity of the cyprinid fauna in the Iberian Peninsula, all of them assuming an Asiatic origin (Sanjur et al., 2002): i) the dispersion of cyprinids into the Iberian Peninsula might have occurred across central Europe through river connections which was possible until the Pliocene, i.e. prior to the isolation of the Iberian Peninsula by the Pyrenees (Barnarescu in Sanjur et al., 2002); ii) the dispersal of the cyprinid species occurred via Lago-Mare phase of the Mediterranean during the Messian crisis of the
2 Pliocene (5.5 MYA), when the Mediterranean basin was separated from the Atlantic Ocean and filled with freshwater from the Sarmatic Sea, thus allowing the dispersal of cyprinids around the Circum-Mediterranean region (Bianco, 1990) and; iii) the dispersal would have occurred through continental land-bridges during the formation of the actual North African coast (Doadrio, 1990). Speciation that subsequently occurred within the Iberian Peninsula has been explained by two separate geographical events (Sanjur et al., 2003; Robalo et al., 2006): a first stage of differentiation in the Miocene, due to the internal configuration on the Iberian endorheic drainage phase, followed by a second stage during the Pliocene-Pleistocene characterized by the re-arrange of the Iberian drainage system to an exoreic one and consequently by barriers associated with the current drainage configuration (Calvo et al., 1993).
The internal complexity and importance of the Iberian Peninsula is well supported by several case studies in different animal species (Gómez & Lunt, 2006). Current data indicate a general trend in the increase of species diversity and number of endemic species from North to South, which raises questions about the colonization paths and biogeographical history of the Iberian Peninsula (Mesquita et al., 2007). The
Squalius genus is one of such case studies, as it presents a clear division between
northern and southern drainages. Only one species is present in the northern region (S.
carolitertii, Doadrio, 1987) and three species can be found in the southern range of the
Iberian Peninsula: S. pyrenaicus (Günther, 1868); S. torgalensis (Coelho, Bogutskaya, Rodrigues & Collares-Pereira, 1998) and S. aradensis (Coelho, Bogutskaya, Rodrigues & Collares-Pereira, 1998). S. aradensis and S. torgalensis are basal to S. pyrenaicus and
S. carolitertii with a probable differentiation around 6 MYA, when many basins almost
dried up and became isolated. The separation between S. carolitertii and S. pyrenaicus is more recent and is attributed to the earlier split of the Douro basin in relation to the remaining Iberian drainages. Also S. pyrenaicus presents higher levels of genetic variability than S. carolitertii revealing the influence of ancient endorheic lagoons that originated some of the main rivers of the Iberian Peninsula (Sanjur et al., 2003).
3
1.2 The Iberochondrostoma genus
Until recently, the Cyprinidae family was only represented by the genera Barbus (sub-family Cyprininae), Squalius, Anaecypris and Chondrostoma
(subfamily Leuciscinae), but Robalo et al. (2006) proposed the division of
Chondrostoma in six new genera: Chondrostoma, Achondrostoma, Parachondrostoma, Pseudochondrostoma, Iberochondrostoma, all represented in the Iberian Peninsula and
also the Protochondrostoma genus that can only be found in Italy and Slovenia.
More particularly, the Iberochondrostoma genus includes I. lemmingii (Steindachner, 1866), I. Lusitanicum, (Collares-Pereira, 1980), I. oretanum (Doadrio & Carmona, 2003), I. almacai (Coelho, Mesquita & Collares-Pereira, 2005) and is morphologically characterized by: arched mouth without horny layer on the lower lip; 46–60 canaliculated scales on the lateral line; 11–12 scales above the lateral line; 5–6 scales below the lateral line; 7–8 branched rays in the ventral fin; 6–7 branched rays in the dorsal fin; 6–7 branched rays in the anal fin; 6–5/5 pharyngeal teeth; 24–27 gill rakers on the first branchial arch and the upper branch of the fifth ceratobranchial enlarged (Robalo et al., 2006).
1.2.1 Iberochondrostoma lemmingii
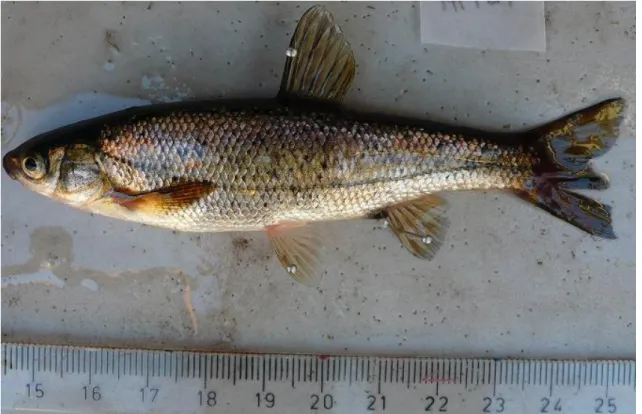
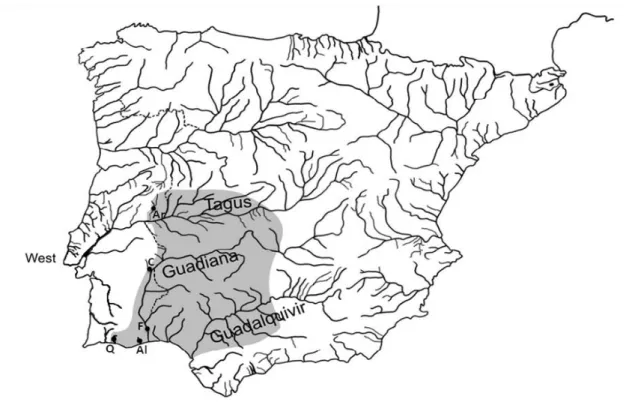
The Iberochondrostoma lemmingii, one of the several endemic species of the Iberian Peninsula, can be found in permanent or intermittent river streams with moderate current and abundant aquatic vegetation (Cabral et al., 2005). Its diet is mainly composed by algae and zooplankton and its reproductive season is between April and May (Kottletat & Freyhof, 2007). The average length is 14.4 cm for females and 11.4 cm for males, with sexual maturity being attained by the age of two (Fernandez-Delgado & Herrera, 1995) and no dispersal reproductive pattern (Doadrio & Carmona, 2003). This species occurs in Tagus, Guadiana and Guadalquivir Iberian drainages as well as in the small basins of Quarteira, Gilão, Almargem and Odiel (Figure 2 in Methods) (Doadrio et al., 2001; Cabral et al., 2005).
In Tejo, it is alopatric to the sister-species I. lusitanicum, occupying only the upper region of the basin, and sympatric with Pseudochondrostoma polylepis
4 (Steindachner, 1865) and S. pyrenaicus. In the Guadiana basin is sympatric with
Pseudochondrostoma willkommii (Steindachner, 1866), S. alburnoides Steindachner,
1866, Anaecypris hispanica (Steindachner, 1866) and S. pyrenaicus. In smaller river basins is sympatric to S. pyrenaicus and S. alburnoides in Almargem and to S. aradensis in Quarteira (Cabral et al., 2005).
Figure 1. Iberochondrostoma lemmingii, photo by MAAboim.
Although its range distribution includes several different basins, in Portugal it only comprises an area of 150 km2 and is currently classified as “Endangered” (Cabral
et al., 2005). As for the remaining populations present in Spain, they are currently
classified as “Vulnerable” (Doadrio et al., 2001).
A study on the genetic variability of Spanish populations of I. lemmingii has already been undertaken by Carmona et al. (2000), using cytochrome b gene and allozymes. Results obtained with both molecular markers were congruent and demonstrated a high level of differentiation among hydrographical basins, supporting the hypothesis of fragmentation of an ancestral widespread population in several regions that correspond to the actual configuration of the hydrological basins present in the Iberian Peninsula. However, this study did not contemplate Portuguese populations. Thus, present work will focus on the Portuguese population, as they were not included
5 in any previous study at the population level and will use mitochondrial DNA cytochrome b gene and microsatellites, a more informative nuclear marker than allozymes, already used in the Spanish populations.
1.3 Conservation genetic studies
1.3.1 Molecular markers in Conservation Genetics
Since mitochondrial DNA and microsatellites are considered as not being affected by selection, their diversity will result from the interaction of mutation and genetic drift (Moran, 2002), being the most commonly used molecular marker in conservation studies based on population genetics. Furthermore, they allow the quantification of genetic flow, providing specific and comparable measurements of processes that affect endangered populations providing an adequate description of the processes that gave rise to the current endangered state of a population or species (De Salle & Amato, 2004).
Conservation Genetics primary goal is “to maintain each species as a genetic dynamic unity capable of evolving with the environment” (Frankham et al., 2004).
Both mitochondrial DNA and microsatellites are obtained through Polymerase Chain Reactions (PCR) requiring small amounts of biological samples that can be collected through non-invasive sampling, permitting studies on endangered species to be conducted without harm to the specimens.
Mitochondrial DNA is a widely used marker that consists in a single circular molecule inherited only by the maternal lineage. This type of inheritance and its high mutational rate, superior to the one found in nuclear DNA, and the absence of recombination are some of the advantages of this molecular marker in the study of the structure and demographic history of populations (Frankham et al., 2004).
Although estimating recent demographic parameters based only in mitochondrial DNA is a controversial procedure, comparative studies also using this molecular marker provide qualitative signals of population changes, allowing for a more precise allocation of conservation efforts. So, its best results are obtained when combined with another molecular marker, preferably of nuclear origin (Moritz, 1994), like microsatellites.
6 Microsatellites are single locus co-dominant markers characterized by high mutational rates providing a finer scale to address ecological questions (Selkoe et al., 2006). Technically, their small size makes them more resilient and easily amplified from degraded samples and can be combined in the genotyping process to provide fast and inexpensive replicated samples of the genome (Selkoe et al., 2006). Like that, several microsatellite loci, provide a wider sample from the genome, diminishing sampling error while increasing statistical power (Selkoe et al., 2006). Although the process to obtain microsatellite primers is complex and species-specific, cross-species amplification is possible with careful PCR conditions optimization (Salgueiro et al., 2003; Mesquita et al., 2005; Sousa et al., 2007; Henriques et al., 2007; Sousa et al., in press).
In Conservation Genetics, one of the most frequent uses of both markers described above, mitochondrial DNA and microsatellites, is the definition of “Evolutionary Significant Units” (ESUs; sensu Moritz) and “Management Units” (MUs;
sensu Moritz), respectively.
1.3.2 Conservation Units
An area in which Conservation Genetics has a great influence is the delineation of appropriate units for conservation, as conservation decisions often rely on the determination of species boundaries, a subject of Evolutionary and Systematic Biology (De Salle & Amato, 2004).
Two types of genetic units have been devised in conservation genetics: “Evolutionary Significant Units” (ESUs; sensu Moritz) and “Management Units” (MUs;
sensu Moritz) (Moritz, 1994). ESU‟s separate reciprocally monophyletic populations for
mtDNA and exhibit a significant divergence in nuclear loci, definition that can be applied to a population with speciation potential which represent the most important elements of intra-specific diversity and should be preserved as independent units (Moritz, 1994). On another hand, MUs represent different populations with a more recent ancestral between which some degree of genetic flow might still occur and that reveal significant divergence in allelic frequencies. The definition of these units is a matter of great importance as it is an extremely useful tool to define priority populations
7 for conservation. Nevertheless, its use has been criticized, in particular, when ESUs are defined solely on neutral molecular markers that ignore adaptive differences (Frankham
et al., 2004), meaning that populations with high degree of genetic flow, but with
significant adaptive differences, would be treated as a single unit when they might require a separate management. The opposite might also occur: populations with low levels of genetic flow and high genetic differentiation, but with no adaptive differences, would be considered as distinct units when they might benefit from a single management strategy (Moritz, 1994). Another problem with Moritz definition of ESU resides in its dichotomous nature of “ESU or not”. In order to circumvent this, Crandall
et al., (2000) proposed a system of discerning populations units based on eight
categories of population distinctiveness. Depending on the magnitude of distinctiveness, each population or group of populations is assigned to a particular category that has specific management recommendations based on recent or historical exchangeability. Despite its limitations, in this work, we will use Moritz definition of ESU as it is the most commonly applied and the one that as been used to address conservation studies in Iberian cyprinids.
1.3.3 Conservation studies in endangered Iberian cyprinids
Several conservation genetic studies have already been made in threatened Iberian Cyprinids from the South of the Peninsula revealing genetic signatures of low number of effectives and/or low genetic variability levels caused by population fragmentation and annual collapses due to heterogeneous hydrological conditions (Mesquita et al., 2005; Henriques, 2007; Sousa et al., 2007; Sousa et al., in press).
A study on the S. aradensis has clearly revealed low levels of genetic variability, evidences of demographic fluctuations and genetic vulnerability trough inbreeding in several populations (Mesquita et al., 2005). The obtained results suggested the definition of four ESU‟s and the recommendation of conservation measures focused in the Arade populations (Arade and Boina) that presented the highest levels of genetic variability (Mesquita et al., 2005).
Another study, on S. torgalensis, revealed that although this species does not incur in immediate extinction, it does present low levels of genetic variability, turning it
8 vulnerable to stochastic events and genetic erosion. In this case, results permitted the delineation of two insipient MU‟s within the Mira drainage (Henriques, 2007).
Anaecypris hispanica, the most threatened cyprinid species in the Iberian
Peninsula, is just distributed in the Guadiana basin and its populations are severely fragmented. Through the analysis of the mitochondrial cytochrome b gene sampled populations were grouped in three ESUs (Alves et al., 2001). Later on, Salgueiro et al. (2003) proposed, based on microsatellite data, that all studied populations corresponded to different MUs and, although populations were in decline, they‟re not as genetically impoverished as previously though, an example that not all endangered populations have low levels of genetic variability.
Concerning the Iberochondrostoma genus, a study based on the mitochondrial cytochrome b gene and the nuclear beta-actin gene of I. lusitanicum, revealed the existence of 3 ESUs: i) Sado drainage, ii) Tagus drainage and iii) Lagoa de Albufeira (Robalo et al., 2007). Additionally, Sousa et al. (2007) in a more recent study based on cytochrome b gene and microsatellite loci defined two ESUs and showed that I.
lusitanicum suffered a population collapse and a subsequent increase in extinction risk
for the next few decades. A similar work in I. almacai, also supported the existence of a population collapse with the division of the species in two MU‟s (one comprising the Mira drainage and other comprising the Arade and Bensafrim drainages) being recommended that actions should be taken to increase the amount of gene flow between populations in the same MU (Sousa et al., in press).
Of the twenty cyprinid species that can be found in Portugal, five are classified as “Critically Endangered”. From the remaining fifteen species, six are classified as “Threatened”, two as “Vulnerable”, two as “Nearly Threatened” and five as “Least Concern” (Cabral et al., 2005). Even though there are other cyprinid species that are more endangered than I. lemmingii, it current status of “Threatened” is still reason for some concern. Also, as no studies have yet focused on Portuguese populations it is important to understand if the same patterns of genetic impoverishment and population structure found in other cyprinid species are also present in I. lemmingii.
All species considered in the previously mentioned conservation studies share the same ecological constraints as I. lemmingii and some are even sympatric in some drainagens. This is of great importance because the understanding of the genetic condition of sympatric species permits a wider perspective and interpretation of the genetic patterns for the species under study. Also, studies of comparative
9 phylogeography allow for the determination of areas of high endemism and evolutionary potential permitting a better conservation management thus, an improved protection of the targeted species.
1.4 Objectives
As currently there is no genetic data at the population level on I. lemmingii, the primary goal of this thesis is to determine its genetic variability and population structure in order to create an adequate conservation strategy for this species, currently classified as “Vulnerable”. For the purpose, we aim to (1) determine the genetic variability of each sample, (2) describe patterns of genetic variability between rivers and basins; (3) detect and date potential demographic events, namely bottlenecks and expansions; (4) obtain results that can be used as a base for future works of temporal comparisons and (5) discuss the implications of the results on the conservation of I. lemmingii and suggest conservation measures for the most threatened populations.
10
2. METHODS
2.1 Sampling
A total of 187 individuals were captured by electrofishing in six different locations: 51 in Caia River and 45 in Foupana River (Guadiana Basin), 42 in Quarteira River (Quarteira Basin), 34 in Aravil River (Tejo Basin), and 15 in Almargem River (Almargem Basin) (Figure 2). Individuals were anesthetized with MS222, fin clipped, photographed and returned to the water after recovery. Clips from pelvic fins were preserved in 100% ethanol at 4ºC and genomic DNA was extracted following a standard phenol-chloroform protocol adapted from Sambrook et al. (1989) and stored at -20 ºC. DNA concentration was measured with a NanoDrop Spectrophotometer ND-1000 v3.2.1 and standardized to 100 ng/μl per sample.
Figure 2. Iberian Peninsula map with sampling locations and I.lemmingii distribution. Q: Quarteira, A: Almargem, C: Caia, Ar: Aravil. Adapted from Robalo et al. (2008).
11
2.2 Laboratory Procedures
2.2.1 Mitochondrial DNA
A total of 63 individuals were sequenced for the cytochrome b mitochondrial gene: 14 individuals from Foupana, 13 from Caia, 12 from Quarteira, 13 from Aravil and 11 from Almargem.
The cytochrome b mitochondrial gene was amplified using the primers LCB1– 5‟-AATGACTTGAAGAACCACCGT-3‟ (Brito et al., 1997) and HA–5‟-CAAC GATCTCCGGTTTACAAGAC-3‟ (Schmidt & Gold, 1993).
Each 25-µL PCR reaction contained 150 ng DNA, 200 µM of each primer, 400 µM dNTP‟s, 2,50 mM MgCl2
and 0,1μl of Taq Polymerase in 1×NH4 reaction buffer. The PCR reactions were conducted on a Bio-Rad® thermal cycler using the profile 94 °C for 1 min, 30 cycles of 94 °C for 1 min 54 °C for 1 min, 72 °C for 2 min and a final extension step of 72 °C for 3 min.
Successful amplification of PCR reactions was confirmed through electrophoresis in a 1% (agarose) gel stained with ethidium bromide and posterior visualization under ultra-violet light with a DC290 Kodak digital camera.
Purification of PCR Products was accomplished through an enzymatic clean-up process under the following conditions: 0,5μl of Exonuclease I (EXO I), 1μl Shrimp Alkaline Phosphatase (SAP) and 2,5μl of SAP Buffer 10× for each 20μl of PCR product at 37ºC for 30min, 80ºC for 15min and 12ºC for 5min.
Purified products were confirmed through electrophoresis as described before and then sequenced in both directions (forward and reverse in an ABI-PRISM genetic analyzer, Macrogen®). All obtained sequences were aligned with SEQUENCHER version 4.1 software (Gene Codes Corporation) and its homology was verified trough BLAST in the GENBANK database.
2.2.2 Microsatellites
No species-specific microsatellite primers for I. lemmingii exist in the literature, therefore, it was necessary to perform a cross-species amplification strategy with primers available for other cyprinid species, such as: Luxilus cornutus (Turner et al., 2004); Squalius aradensis (Mesquita et al., 2003); Squalius alburnoides (Pala &
12 Coelho, 2005); Leucisus cephalus (Larno et al., 2005; Vyskocilová et al., 2007);
Anaecypris hispanica (Salgueiro et al., 2003) and Rhodeus sericesus (Dawson et al.,
2003).
Optimization of PCR reactions was conducted in 12-µL PCR reactions containing 100 ng DNA, 200 µM of each primer (forward and reverse), 400 µM dNTP‟s, 2,50 mM MgCl2
and 0,1μl of Taq Polymerase in 1×NH4 reaction buffer on a gradient Bio-Rad® thermal cycler. All primer pairs were tested under the following PCR conditions: 95 °C for 15 min, 94 °C for 30 s, annealing temperatures (Ta) from 50 °C to 60 °C in 2 °C intervals for 1 min 30 s were tested, 72 °C for 1 min for 30 cycles and 72 °C for 10 min (Mesquita et al., 2003). Some of the primers were also tested using alternative PCR conditions: an initial denaturation at 95 ºC for 30 s, followed by three series: 95 ºC for 30 s, 60 ºC (Ta) for 40 s, 72 ºC for 30 s (5 cycles); 95 ºC for 30s, 55 ºC (Ta) for 40 s, 72 ºC for 35 s (10 cycles); 95 ºC for 30 s, 50 ºC (Ta) for 40 s, 72 ºC for 35 s (25 cycles) and a final extension step at 72 ºC for 5 min (Salgueiro et al., 2003) (see Table I).
Successful amplification of PCR reactions was confirmed through electrophoresis in a 2% (agarose) gel stained with ethidium bromide and posterior visualization under ultra-violet light with a DC290 Kodak digital camera.
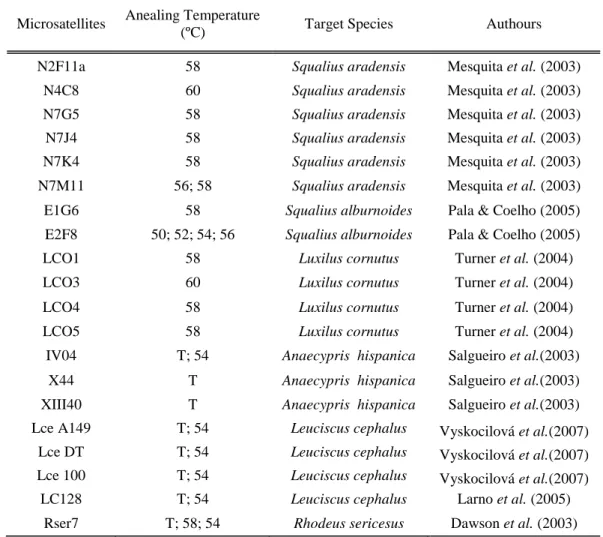
All tested primers that resulted in successful amplifications in I. lemmingii and correspondent annealing temperatures, are presented in Table I.
13 Table I: List of primers that amplified for I.lemingii, respective source and successful annealing temperatures
Microsatellites Anealing Temperature
(ºC) Target Species Authours
N2F11a 58 Squalius aradensis Mesquita et al. (2003)
N4C8 60 Squalius aradensis Mesquita et al. (2003)
N7G5 58 Squalius aradensis Mesquita et al. (2003)
N7J4 58 Squalius aradensis Mesquita et al. (2003)
N7K4 58 Squalius aradensis Mesquita et al. (2003)
N7M11 56; 58 Squalius aradensis Mesquita et al. (2003) E1G6 58 Squalius alburnoides Pala & Coelho (2005) E2F8 50; 52; 54; 56 Squalius alburnoides Pala & Coelho (2005)
LCO1 58 Luxilus cornutus Turner et al. (2004)
LCO3 60 Luxilus cornutus Turner et al. (2004)
LCO4 58 Luxilus cornutus Turner et al. (2004)
LCO5 58 Luxilus cornutus Turner et al. (2004)
IV04 T; 54 Anaecypris hispanica Salgueiro et al.(2003)
X44 T Anaecypris hispanica Salgueiro et al.(2003)
XIII40 T Anaecypris hispanica Salgueiro et al.(2003) Lce A149 T; 54 Leuciscus cephalus Vyskocilová et al.(2007)
Lce DT T; 54 Leuciscus cephalus Vyskocilová et al.(2007) Lce 100 T; 54 Leuciscus cephalus Vyskocilová et al.(2007)
LC128 T; 54 Leuciscus cephalus Larno et al. (2005)
Rser7 T; 58; 54 Rhodeus sericesus Dawson et al. (2003)
T: Touchdown protocol by Salgueiro et al. (2003). Numbers represent annealing temperatures that permitted a successful amplification of respective primers under PCR conditions according to Mesquita et al. (2003).
Based on their amplification conditions, allelic sizes and non-complementarity between different primer pairs, 7 microsatellite loci were successfully grouped in 2 multiplex sets. The first multiplex set contained LCO5-PET, LCO4-VIC primers (Luxilus
cornutus; Turner et al., 2004) and E1G6-NED (Squalius alburnoides; Pala & Coelho,
2005), while for the second multiplex N7G5-VIC, N4C8-FAM, N7K4-NED (Squalius
aradensis; Mesquita et al., 2003) and LCO1-VIC primers (Luxilus cornutus; Turner et
al., 2004) were grouped (see Table II in Results).
The PCR conditions for both multiplex primer sets were those used by Mesquita
et al. (2003) with an annealing temperature of 58ºC in order to obtain successful
amplification of all primers in the same mix and, an inferior number of cycles (diminished to 23) for a better resolution and visualisation of the microsatellite peaks.
PCR products were then diluted 1:20 in ultra pure water and 1μl of the dilution was suspended in 15μl of Formamide Hi-Di and 0,15μl of LIZ 500®
14 genotyped in an ABI PRISM – 310 GENETIC ANALYZER® after being previously denaturated for 3min 30s at 95ºC. Allele sizes were determined using the software GeneMapper 3.1. (Applied Byosistems®).
2.3 Statistical Analysis
2.3.1 Genetic diversity
Mitochondrial DNAIn order to explore mitochondrial DNA genetic diversity, the following measures were taken into account:
1. Number of haplotypes and private haplotypes in the sample, inferred with
ARLEQUIN 3.11 (Excoffier et al., 2005).
2. Haplotypic diversity (h): probability that two randomly sampled haplotypes are different, calculated with ARLEQUIN 3.11 (Excoffier et al., 2005).
3. Nucleotide diversity (π): the probability that two randomly chosen homologous sites are different. It is equivalent to the gene diversity at the nucleotide level for DNA data with ARLEQUIN 3.11 (Excoffier et al., 2005).
Microsatellites
All used microsatellite loci were tested for null alleles, stuttering and large allele drop out using the program MICRO-CHECKER version 2.2.03 (Van Oosterhout et al., 2004). The application uses a Monte Carlo simulation (bootstrap) method to generate expected homozygote and heterozygote allele size difference frequencies.
Microsatellite loci were also checked for evidences of linkage disequilibrium among them using ARLEQUIN 3.11 (Excoffier et al., 2005). As the gametic phase is unknown the procedure for testing the significance of the association between pairs of loci is based on a likelihood ratio test, where the likelihood of the sample evaluated under the hypothesis of no association between loci (linkage equilibrium) is compared to the likelihood of the sample when association is allowed (Slatkin & Excoffier, 1996).
15 The significance of the observed likelihood ratio is found by computing the null distribution of this ratio under the hypothesis of linkage equilibrium, using a permutation procedure. Sequential Bonferroni correction was applied when multiple tests where performed.
After the definite choice of microsatellites suitable for the study, several standard genetic diversity measures were inferred:
1. Number of alleles by locus (A) with ARLEQUIN 3.11 (Excoffier et al., 2005). 2. Allelic richness: average number of alleles by locus (Ar) corrected to take into
account population size, through a rarefaction procedure as implemented in the software HP-RARE 1.0 (Kalinoswki, 2005).
3. Number of private alleles (PA): the number of alleles that can only be found in a single population, also implemented in HP-RARE 1.0 (Kalinoswki, 2005).
4. Observed heterozygosity: the proportion of heterozygous individuals that can be found in a single population with ARLEQUIN 3.11 (Excoffier et al., 2005).
5. Expected heterozygosity: prediction of the proportion of heterozygous individuals in a single population based on the known allele frequencies of a sample. The observed allelic frequencies can be tested against the expected frequencies to see if the populations are in Hardy-Weinberg equilibrium, which states that allelic frequencies will remain constant trough time in a randomly mating large population with noimmigration, mutation or natural selection. 6. Wright‟s fixation index (1951), or inbreeding coefficient (FIS): measures the
reduction in heterozygosity based on the relation between the observed heterozygous with the proportion of heterozygous that would occur in Hardy-Weinberg equilibrium. The direct consequence of inbreeding is the increase of homozygosity and therefore positive values of FIS. FSTAT 2.9.3.2 (Goudet, 2001)
was used to infer this parameter that varies between -1 (heterozygous excess) and +1 (homozygous excess).
16
2.3.2 Population Structure
Mitochondrial DNAPhylogeographic relationships between individuals were first explored by a haplotypic network based on the cytochrome b sequences. These relationships are usually described as a tree, though true evolutionary relationships are reticulate rather than strictly dichotomous tree-like. For example, at the population level, biologists have always thought of relationships among individuals as being reticulate, simply because the primary historical pattern within a sexually reproducing species is inter-breeding (Morrison, 2005). Therefore the multitude of plausible trees to express relationships among individuals might be best expressed by a network, which displays alternative potential evolutionary paths (Bandelt et al., 1999). NETWORK 4.5 software (Bandelt et
al., 1999) groups individuals based on their genetic distance. The software uses a
Maximum Parsimony (MP) approach creating several trees and choosing the least complex. The Median-Joining algorithm was used with the default parameters as recommended for multiple state data (Bandelt et al., 1999). This method creates the minimum spanning trees all combined in a single reticulate network and subsequently consensus sequences are added in order to achieve parsimony. These added sequences are median vectors and can be biologically interpreted as unsampled sequences or extinct ancestral sequences (Bandelt et al., 1999).
Population differentiation was computed using pairwise ST (Nei, 1973) as
implemented in ARLEQUIN 3.11 (Excoffier et al., 2005) which is similar to classical FST
(Wrigth, 1951) but takes into account the genetic distance among haplotypes and not only haplotipic frequencies (Excoffier et al., 2005). For that, it was necessary to find the most adequate mutation model for the data using MODELTEST 3.7 software (Posada & Crandall, 1998). The TrN+I (Tamura-Nei; with I representing invariable sites) model was chosen to compute pairwise ΦST with ARLEQUIN 3.11 (Excoffier et al., 2005). The
Δi is inferior to 2 which means that the model still has substantial support and from all
models that were available in the ARLEQUIN 3.11 software (Excoffier et al., 2005), was the highest ranked. Pairwise ΦST were calculated taking into consideration the best fitted
model, 10 000 permutations and significance levels of 0,05 were posteriorly adjusted by Bonferroni correction.
17 In order to access the population structure without prior knowledge of their sampling site origin the BAPS 4.1 software (Corander & Tang, 2007) was used. To run
this programme the user must provide the number of clusters that wants to test and the software uses a stochastic optimization procedure to find the clustering solution with the highest “marginal likelihood” (Corander & Tang, 2007). The number of K was set between 1 and 6 and the analysis was performed 10 times. The partition that presented the highest value of marginal likelihood was recorded and analyzed.
An Analysis of Molecular Variance (AMOVA) as implemented in ARLEQUIN 3.11 (Excoffier et al., 2005) was also performed to test the significance of the different structures presented in the previous analyses, i.e., the structure evidenced by both geographic sampling as well as the structure highlighted by BAPS. By defining groups of populations, the user defines a particular hierarchical genetic structure that will be tested. The haplotype differences were used as genetic distance, and a total of 10 000 permutations were used and the significance level was set to 0,05.
Microsatellites
In a preliminary approach, the relationship between individuals based on microsatellite loci data was explored through a Correspondence Factor Analysis (FCA)
implemented in GENETIX 4.2 (Belkhir et al., 2000). This analysis allows to observe the
relationship between all individual genotypes in 2D/3D scatter plots and infer possible closely related groups, i.e., samples. This methodology also allows for the identification of “outliers”, i.e., individuals that do not seem to be related to any cloud of points in the chart. These individuals should then be target of careful investigation in order to understand why they seem to be so far related with all the other sampled individuals. One of the reasons for this behavior might bee the misidentification of individuals from other species or the presence of hybrids.
The software POPULATIONS 1.2.30 (Langella, 2002) was used to create distance trees for individuals with the genetic distance DAS (Jin & Chakraborty, 1994) which calculates shared allele distances, and for samples with DA (Nei et al., 1983) and DC (Cavalli-Sforza & Edwards, 1967) genetic distances. All distances were used in
18 conjunction with the “Neighbour Joining” algorithm (Takezaki & Nei, 1996) and all produced trees were manipulated with MEGA 3.1 software (Kumar et al., 2004).
The degree of differentiation between samples was then explored using Wrigth‟s F statistics (1951) using the algorithm proposed by Weir & Cockerham (1984) as implemented in ARLEQUIN 3.11 (Excoffier et al., 2005). It was also calculated the value for RST, a derivation of FST specific for microsatellite data that takes into account the
size of the alleles and the SMM (stepwise mutation model) according to Rousset (1996). Pairwise FST and RST were calculated with ARLEQUIN 3.11 (Excoffier et al.,
2005) with a significance level of 0.05 after 10 000 permutations. Significance levels were then adjusted with Bonferroni correction.
The software STRUCTURE 2.2 (Pritchard et al., 2000) was used to infer on population structure without any a priori information on the origin of the individuals. The program implements a model-based clustering method for inferring population structure using genotype data consisting of unlinked markers. First, is assumed a model in which there are K populations (where K may be unknown), each of which is characterized by a set of allele frequencies at each locus. Individuals in the sample are assigned (probabilistically) to populations, or jointly to two or more populations if their genotypes indicate that they are admixed. It is assumed that within populations, the loci are at Hardy-Weinberg equilibrium, and linkage equilibrium, and individuals are assigned in to different groups in order to maintain the deviations to these equilibriums to a minimum (Pritchard et al., 2000). The software was used under the “Admixture” model with allelic frequencies independent, and with values of K set between 1 and 10. For each K, 20 simulations were performed with a burning period of 50 000, followed by 100 000 Markov steps (MCMC). STRUCTURE 2.2 (Pritchard et al., 2000) software outputs the average log likelihood of the data for each value of K at each step of the Markov Chain Monte Carlo (MCMC). In order to choose which value of K best suited the data, the protocol defined by Evanno et al. (2005) was followed. This method is based on an ad hoc statistic based on the rate of change of the log likelihood of the data between successive values of K (Evanno et al., 2005).
A hierarchical analysis of population subdivision was performed using the Analysis of Molecular Variance (AMOVA; Excoffier et al., 1992) implemented in
19 significance of the different structures defined by geographic sampling and STRUCTURE. The allelic frequencies were used as genetic distance in each sample and a total of 10 000 permutations were used and the significance level was set to 0.05.
2.3.3 Demographic History
Mitochondrial DNA
Mitochondrial DNA was also used to access demographic history with the use of Tajima‟s D test (Tajima, 1989), Fu‟s Fs (Fu, 1997) and mismatch distribution as implemented in ARLEQUIN 3.11 (Excoffier et al., 2005). Although Tajima‟s D test and Fu‟s Fs were created to test for the presence of selection they are sensitive to demographic patterns and can be used to search for signatures of bottlenecks and expansion events. These tests are based in the infinite-site model, without recombination (Excoffier et al., 2005). Tajima‟s D and Fu‟s Fs statistics tends to present negative values when there is an excess of recent mutations and therefore of rare alleles, making it possible to interpret large negative values as an evidence of expansion events. Tajima‟s D test looks at the expectation of the average number of nucleotide differences among DNA sequences randomly sampled from a population and can also be sensitive to bottleneck effects (Ramirez-Soriano et al., 2008). Finally, in order to detect expansion events, mismatch distributions are a graphic evaluation of the observed number of nucleotide differences between each pair of sample haplotypes. This will result in a multimodal distribution for a population in demographic equilibrium and in a unimodal distribution for populations that incurred in expansion demographic events.
ARLEQUIN‟s output of mismatch distribution analysis also includes the parameters of
the expansion events with τ representing the expansion time, which is the product of the mutation rate for the haplotype (u) with the time since the expansion event in generations (t). The mutation rate for the haplotype is given by 2µk with µ representing the mutation rate per million years (MA) and k the number of nucleotides in the sequence. It was considered a mutation rate of 1.05% per MA as defined by Doadrio & Carmona (2004) and a generation time of two years (Fernandez-Delgado & Herrera, 1995).
20
Microsatellites
Microsatellite data was processed with BOTTLENECK software (Piry et al., 1999) in order to explore the demographic history of I. lemmingii. This software allows determining if there were bottleneck effects in the studied populations by calculating deviations in the number of expected heterozygous based in the allelic frequencies of the used loci (Piry et al., 1999). A population that went trough a bottleneck from which resulted a diminished effective population size will experience a decrease in the number of heterozygotic individuals and also in the number of alleles since the rare alleles are easily lost. As the rare alleles have little contribution to the total diversity, the number of alleles will decrease at a faster rate when compared to the amount of heterozygosity (Piry et al., 1999). By comparing the observed number of heterozygous individuals with the expected number of heterozygous individuals taking into account the number of alleles in each locus, sample size and assuming mutation-drift equilibrium it is possible for the software to detect signs of the occurrence of bottlenecks (Piry et al., 1999). All possible models implemented in BOTTLENECK were tested (IAM, SMM and TPM). Two TPM models were tested: one with 90% SMM and 10% IAM and other with 70% SMM and 30% IAM.
21
3. RESULTS
3.1 Genetic diversity
3.1.1 Mitochondrial DNA
A total of 63 individuals, including representatives of all 5 samples, were sequenced for the cytochrome b mitochondrial gene. The length of the obtained fragment was of 1013pb with a mean composition of 26.8% A, 16.4% G, 29.5% T, 27.4% C.
A total of 18 different haplotypes were found in the 63 individuals surveyed. (Table II)
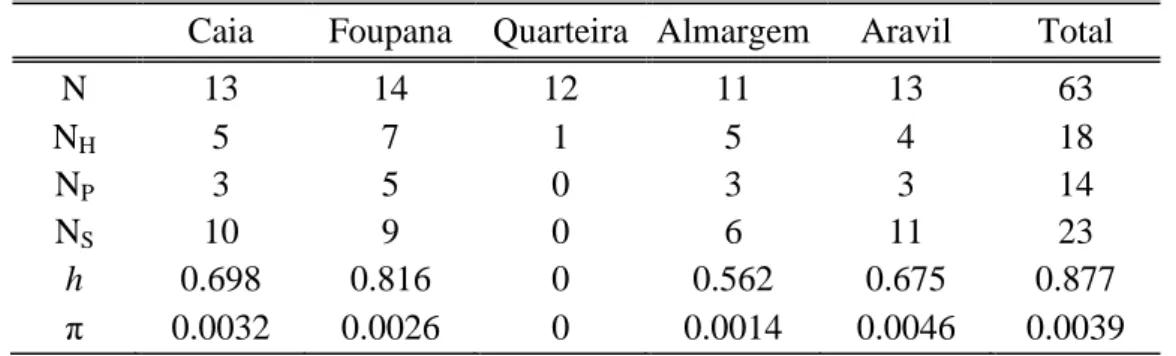
Table II. Variability measures for the mitochondrial cytochrome b gene.
Caia Foupana Quarteira Almargem Aravil Total
N 13 14 12 11 13 63 NH 5 7 1 5 4 18 NP 3 5 0 3 3 14 NS 10 9 0 6 11 23 h 0.698 0.816 0 0.562 0.675 0.877 π 0.0032 0.0026 0 0.0014 0.0046 0.0039
N, number of individuals; NH, number of haplotypes found; NP, number of private haplotypes; NS, number of
substitutions; h, haplotidic diversity; π: nucleotidic diversity.
Most haplotypes were shared between samples but 18 were found in specific localities. A total haplotidic diversity of 0.877 indicates an overall high level of diversity in I. lemmingii. However, observed haplotipic diversity was very distinctive across samples ranging between 0 in Quarteira (only one haplotype was found) and 0,816 in Foupana, which has to be taken into consideration when interpreting overall values. In contrast, nucleotide diversity within each sample was more homogeneous and generally low (overall π=0.0039), ranging from 0 in Quarteira to 0.0046 in Aravil.
Excluding Quarteira (the sample with less genetic diversity, only one haplotype), Almargem presented the lowest values of both haplotipic and nucleotidic diversity and Foupana the higher value of haplotypic diversity but a low value of nucleotide diversity.
22
3.1.2 Microsatellites
No evidence for the presence of null alleles, stuttering or large allele drop out was found in the 7 loci analysed. Also, no consistent evidences of linkage disequilibrium were found after Bonferroni corrections (P<0.0006) as only two different pairs of loci presented significant values in punctual populations (Table IV).
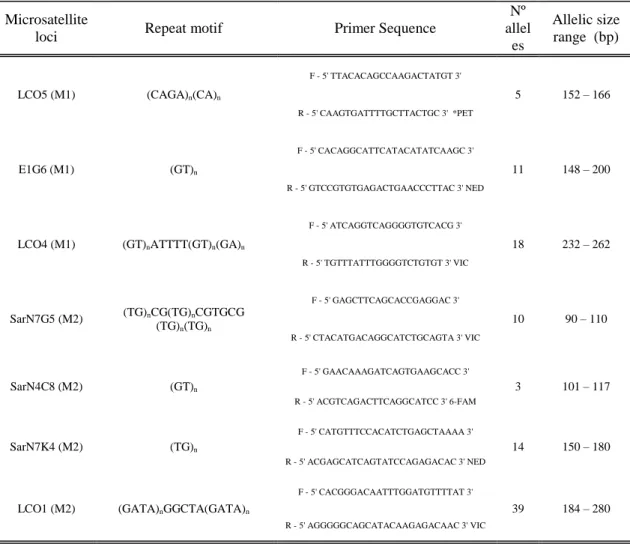
All loci were polymorphic with a total of 100 alleles detected across all loci and samples. LCO5 was the less polymorphic loci with 4 alleles ranging from 152 to 166bp while LCO1 presented the highest rate of polymorphism with 39 alleles ranging from 184 to 280bp (Table III).
Table III. Microsatellites loci characterization: repeat motif, primer sequences, flourochrome labeling information, number of observed alleles and respective allelic range.
Microsatellite
loci Repeat motif Primer Sequence
Nº allel es
Allelic size range (bp)
LCO5 (M1) (CAGA)n(CA)n
F - 5' TTACACAGCCAAGACTATGT 3' 5 152 – 166 R - 5' CAAGTGATTTTGCTTACTGC 3' *PET E1G6 (M1) (GT)n F - 5' CACAGGCATTCATACATATCAAGC 3' 11 148 – 200 R - 5' GTCCGTGTGAGACTGAACCCTTAC 3' NED
LCO4 (M1) (GT)nATTTT(GT)n(GA)n
F - 5' ATCAGGTCAGGGGTGTCACG 3' 18 232 – 262 R - 5' TGTTTATTTGGGGTCTGTGT 3' VIC SarN7G5 (M2) (TG)nCG(TG)nCGTGCG (TG)n(TG)n F - 5' GAGCTTCAGCACCGAGGAC 3' 10 90 – 110 R - 5' CTACATGACAGGCATCTGCAGTA 3' VIC SarN4C8 (M2) (GT)n F - 5' GAACAAAGATCAGTGAAGCACC 3' 3 101 – 117 R - 5' ACGTCAGACTTCAGGCATCC 3' 6-FAM SarN7K4 (M2) (TG)n F - 5' CATGTTTCCACATCTGAGCTAAAA 3' 14 150 – 180 R - 5' ACGAGCATCAGTATCCAGAGACAC 3' NED
LCO1 (M2) (GATA)nGGCTA(GATA)n
F - 5' CACGGGACAATTTGGATGTTTTAT 3'
39 184 – 280 R - 5' AGGGGGCAGCATACAAGAGACAAC 3' VIC
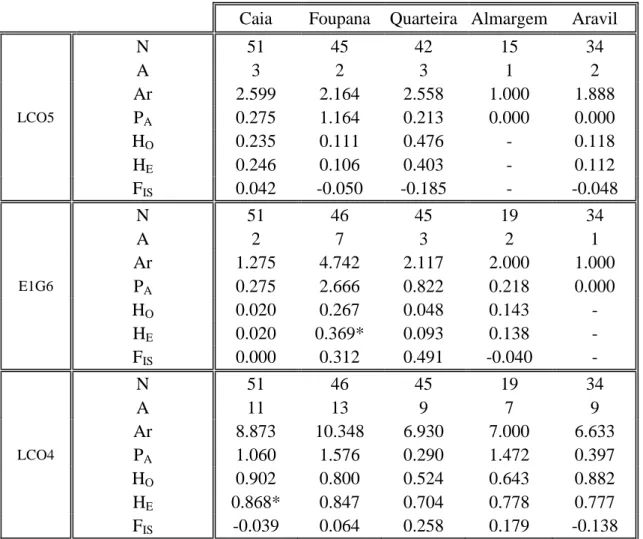
23 All loci presented polymorphism in all samples with the exception of N4C8, LCO5 and E1G6 that were respectively monomorphic for Caia/Almargem/Aravil, Almargem and Aravil (Table IV). The mean allelic richness across all loci was similar between populations; however, the calculated values per loci were quite divergent ranging from 1 in several samples to 16 for the LCO1 locus in the Aravil population. Quarteira was the population with more private alleles averaged across all loci (1.240) opposed to Caia with only 0.750. Averaged observed heterozygosity across loci ranged between 0.395 in Caia and 0.610 in Almargem and the averaged expected heterozygosity ranged between 0.410 for Caia and 0.610 for Almargem. The Aravil population was the only to present observed values of heterozygosity superior to those that were expected, although none of them was significant. Aravil was the only population to present a negative value of FIS indicative of possible increase in
heterozygous frequencies while Foupana population presented the highest value of FIS
(0.060)
Table IV. Microsatellite diversity measures.
Caia Foupana Quarteira Almargem Aravil
N 51 45 42 15 34 A 3 2 3 1 2 Ar 2.599 2.164 2.558 1.000 1.888 LCO5 PA 0.275 1.164 0.213 0.000 0.000 HO 0.235 0.111 0.476 - 0.118 HE 0.246 0.106 0.403 - 0.112 FIS 0.042 -0.050 -0.185 - -0.048 N 51 46 45 19 34 A 2 7 3 2 1 Ar 1.275 4.742 2.117 2.000 1.000 E1G6 PA 0.275 2.666 0.822 0.218 0.000 HO 0.020 0.267 0.048 0.143 - HE 0.020 0.369* 0.093 0.138 - FIS 0.000 0.312 0.491 -0.040 - N 51 46 45 19 34 A 11 13 9 7 9 Ar 8.873 10.348 6.930 7.000 6.633 LCO4 PA 1.060 1.576 0.290 1.472 0.397 HO 0.902 0.800 0.524 0.643 0.882 HE 0.868* 0.847 0.704 0.778 0.777 FIS -0.039 0.064 0.258 0.179 -0.138
24 N 51 46 45 19 34 A 4 7 8 5 6 Ar 2.866 6.119 6.441 4.864 4.139 SarN7G5 PA 0.162 0.159 1.025 0.430 0.300 HO 0.216 0.756 0.738 0.667 0.588 HE 0.201 0.738 0.742 0.582 0.517 FIS -0.074 -0.020 0.006 -0.152 -0.141 N 51 46 45 19 34 A 1 2 5 1 1 Ar 1.000 1.934 3.662 1.000 1.000 SarN4C8 PA 0.000 0.003 1.731 0.000 0.000 HO - 0.111 0.571 - - HE - 0.145 0.506 - - FIS 1.000 0.236 -0.088 - - N 51 46 45 19 34 A 7 3 8 4 6 Ar 5.054 2.996 5.818 3.933 4.820 SarN7K4 PA 1.226 0.002 3.280 0.150 0.839 HO 0.510 0.568 0.595 0.800 0.559 HE 0.596 0.567 0.552 0.687 0.640 FIS 0.146 -0.002 -0.080 -0.171 0.128 N 51 46 45 19 34 A 17 21 9 12 22 Ar 11.807 13.674 6.889 11.598 15.957 LCO1 PA 2.269 4.246 1.310 3.133 6.409 HO 0.882 0.886 0.732 0.800 0.941 HE 0.904 0.922 0.789 0.899 0.951 FIS 0.024 0.040 0.092 0.113 0.011 N 51 46 45 19 34 A 6.571 7.125 6.125 6.000 8.000 Ar 4.780 6.000 4.920 4.490 5.060 ALL PA 0.750 1.400 1.240 0.770 1.130 HO 0.395 0.454 0.508 0.610 0.544 HE 0.410 0.482 0.538 0.616 0.535 FIS 0.038 0.060 0.037 0.010 -0.031
N: number of individuals; A: Number of alleles; Ar: allelic diversity obtained through a rarefaction procedure; PA:
Private alleles; Ho: observed heterozigosity; He: expected heterozigosity; Fis: Fixation index. Significant deviations of
25
3.1 Population Structure
3.1.1 Mitochondrial DNA
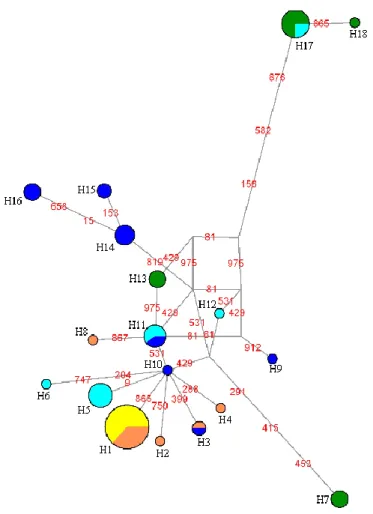
The most common haplotype (H1) was found in a total of 19 individuals from Quarteira (N=12, which represent all sample) and Almargem (N=7) (Table V). The majority of the other haplotypes were unique to one sample except for one haplotype shared between Foupana and Almargem; another shared between Caia and Aravil and a third one shared between Caia and Foupana. The median-joining network (Figure 3) showed some degree of complexity with no clear geographical structure among haplotypes. A central group of haplotypes could be identified and two peripheral ones belonging to Aravil.
Figure 3. Median-joining Network of cytochrome b (mtDNA) sequences. The area of the circles is proportional to the frequencies of the haplotypes. Colours represent the geographic origin of haplotypes: Foupana (dark blue), Caia (light blue), Quarteira (yellow), Almargem (orange) and Aravil (green). Mutation positions are marked in red.
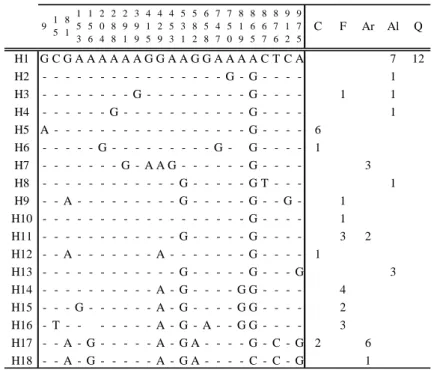
26 Table V. Haplotype nucleotide differences with respective sequence location and distribution of haplotypes in each sample. H1 G C G A A A A A A G G A A G G A A A A C T C A 7 12 H2 - - - G - G - - - - 1 H3 - - - G - - - G - - - - 1 1 H4 - - - G - - - G - - - - 1 H5 A - - - G - - - - 6 H6 - - - G - - - G - G - - - - 1 H7 - - - G - A A G - - - G - - - - 3 H8 - - - G - - - G T - - - 1 H9 - - A - - - G - - - G - - G - 1 H10 - - - G - - - - 1 H11 - - - G - - - G - - - - 3 2 H12 - - A - - - A - - - G - - - - 1 H13 - - - G - - - G - - - G 3 H14 - - - A - G - - - - G G - - - - 4 H15 - - - G - - - A - G - - - - G G - - - - 2 H16 - T - - - A - G - A - - G G - - - - 3 H17 - - A - G - - - A - G A - - - - G - C - G 2 6 H18 - - A - G - - - A - G A - - - - C - C - G 1 8 6 5 8 6 7 8 7 6 9 1 2 9 7 5 Q Al Ar F C 5 3 1 5 8 2 6 5 8 7 4 7 7 5 0 8 1 9 2 8 8 2 9 1 3 9 9 4 1 5 4 2 9 4 5 3 9 1 5 8 1 1 5 3 1 5 6 2 0 4
C: Caia; F: Foupana; Ar: Aravil; Al: Almargem; Q: Quarteira.
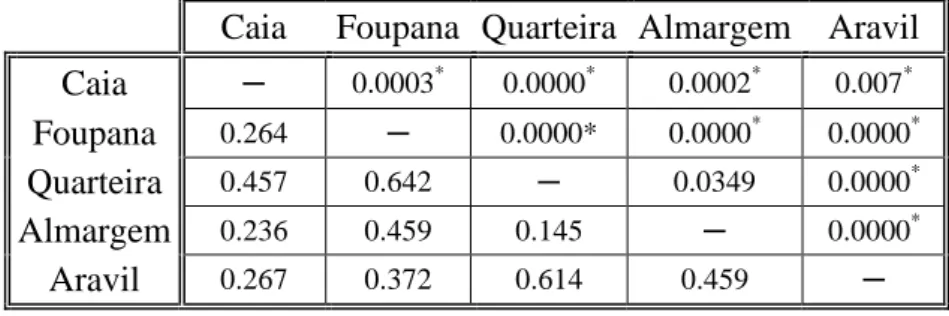
ΦST pairwise values ranged from 0.145 between Almargem and Quarteira to
0.642 between Foupana and Quarteira (Table VI). All values were highly significant with P<0.05 suggesting that each of the 5 samples analyzed represent genetically definable populations. Quarteira presented the highest pairwise ΦST values when
compared with all other samples, which seems to point to this population as the most significantly divergent from the others. It is also worth noticing that the pairwise ΦST
value between Caia (Guadiana basin) and Aravil (Tagus basin) (0.267) is among the lower ones and is very similar to that found between Caia and Foupana (0.264) which belong to the same river basin (Guadiana). All values remained significant after Bonferroni corrections (P<0.005) except for the comparison between Almargem and Quarteira.
From these results it is possible include the samples from Quarteira and Almargem in a single group and maintain all the remaining samples as differentiated populations.
27 Table VI. ΦST mtDNA pairwise comparisons. ΦST values below the diagonal and correspondent P-values above the
diagonal.
Caia Foupana Quarteira Almargem Aravil Caia ─ 0.0003* 0.0000* 0.0002* 0.007*
Foupana 0.264 ─ 0.0000* 0.0000* 0.0000*
Quarteira 0.457 0.642 ─ 0.0349 0.0000*
Almargem 0.236 0.459 0.145 ─ 0.0000*
Aravil 0.267 0.372 0.614 0.459 ─
Significance of tests after Bonferroni correction, are marked with *.
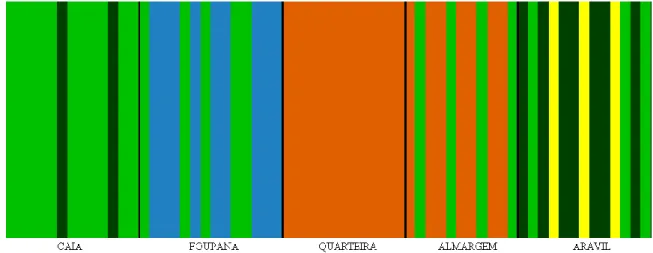
The genetic structure of populations, without prior knowledge of their geographic origin, revealed 5 putative genetic groups (Figure 4) with a log(ml)=-298.2356. Three of the generated groups presented mixed constitutions with individuals from different geographic samples: one group included individuals from all sampling sites, except Quarteira; another was constituted by individuals from Foupana and Aravil; and a third one was composed by individuals from Quarteira and Almargem. The two other genetic groups showed no mixed origin of individuals: one included individuals merely from Foupana and the a fifth was solely constituted by three individuals from the Aravil sample. However, as the software tends to overestimate the amount of groups found (Latch et al., 2006), this last group probably lacks biological meaning. Moreover, Quarteira sample presented individuals from a single genetic group. Despite a non-complementarity between genetic groups and geographic samples, this analysis revealed similarity between Almargem and Quarteira samples and a high differentiation of Foupana, Caia and Aravil as genetic populations despite some degree of admixture.
28 Figure 4. Results from BAPS 4.1 software. Geographic populations are separated with black lines and each vertical colored line corresponds to one individual and the group on which he was genetically placed. Each color corresponds to one genetic group.
The hierarchical gene diversity analysis (AMOVA) based on geographic basins (4 groups: Guadiana (Caia + Foupana) / Tagus (Aravil) / Quarteira / Almargem) and on the structure supported by BAPS and ΦST (4 groups: Quarteira + Almargem / Foupana /
Aravil/Caia) failed to reveal a significant amount of variation explained among groups (P>0.05) (Table VII). As for the structure proposed with the results obtained with the ΦST and BAPS, the AMOVA analysis revealed the higher value for explained variance
among groups (45.88%) and although this value was still non significant it presented the lowest P-value of both proposed structures (P=0.100). The non significance of the
AMOVA analysis that was performed for the ΦST and BAPS might be related to the fact
that the variation within populations was also very high and significant (55.07%,