Data Anonymization: K-anonymity Sensitivity
Analysis
Wilson Santosa,b , Gonçalo Sousaa, Paula Prata a,b, Maria Eugénia Ferrãoa,c a Universidade da Beira Interior, Covilhã, Portugal
b Instituto de Telecomunicações
c Centro de Matemática Aplicada à Previsão e Decisão Económica, Lisboa, Portugal. {wilsongdsantos, goncalosousa291}@gmail.com, [email protected], [email protected]
Abstract — These days the digitization process is everywhere, spreading also across central governments and local authorities. It is hoped that, using open government data for scientific research purposes, the public good and social justice might be enhanced. Taking into account the European General Data Protection Regulation recently adopted, the big challenge in Portugal and other European countries, is how to provide the right balance between personal data privacy and data value for research. This work presents a sensitivity study of data anonymization procedure applied to a real open government data available from the Brazilian higher education evaluation system. The ARX k-anonymization algorithm, with and without generalization of some research value variables, was performed. The analysis of the amount of data / information lost and the risk of re-identification suggest that the anonymization process may lead to the under-representation of minorities and sociodemographic disadvantaged groups. It will enable scientists to improve the balance among risk, data usability, and contributions for the public good policies and practices.
Keywords - GDPR; personal data protection; ARX; data anonimization; k-anonymity.
I. INTRODUCTION A. Motivation
The data produced by day-to-day human activity have increasing social and economic value for companies and organizations to assess and guide their behaviors and actions. However, the use of such data must respect the privacy of each individual. With the emergence of the European General Data Protection Regulation (GDPR) [1] together with the growth of digitization in every area, data anonymization has become an essential topic in data processing and analysis.
Never before have people generated and recorded so much data. With such a wealth of information it becomes easy to cross several data sources. Sometimes, data that are believed to be anonymous, may however be vulnerable to re-identification as shown in [2]. The authors of that work were able to put real names to the records produced by four protocols that were referred to as being popular ways to make personal information anonymous. Therefore, finding a right balance between data utility and personal privacy is an open issue.
B. Related Work
In the anonymization process it is supposed to identify all the attributes that could be used for linking with external
information. Such attributes include all direct identifiers, as name, or social security number, and also indirect or quasi-identifiers. A quasi-identifier is an attribute that linked with other dataset can uniquely identify an individual. The first formal model proposed for microdata anonymization, the k-anonymity model, consists of modifying the quasi-identifiers in order to avoid any data linkage. Sweeney and Samarati define k-anonymity as follows [3] [4]: “Let T(A1,...,An) be a table and QI be the quasi-identifier associated with it. T is said to satisfy k-anonymity wrt QI if and only if each sequence of values in T[QI] appears at least k occurrences in T[QI]” ([4] p. 1013). Several algorithms to implement k-anonymity have been developed [5]. Most of them actuate on quasi-identifier attributes through generalization and suppression operations, in order to create groups of records that share the same quasi-identifier values. Suppression consists in replacing original data by some special value, as for instance “*”. Generalization (also called recoding) consists of a deliberate reduction of data accuracy, as for instance convert a person's age into an age group. At the end, each record is indistinguishable from a group of at least k-1 other records with respect to the set of quasi‐identifier attributes. K-anonymity works as the basis for most of anonymization models. Some proposals try to introduce improvements based on the specific contents of data, as avoiding that all the k records of a group have a same sensitive value on one variable [6] [7]. The work presented in [8] performs k-anonymity for a large data set and then recodes sensitive attributes by adding a random, or fuzzy, factor. A software package for probabilistic anonymization is proposed in [9]. Instead of using k-anonymity, they perturb the data through the addition of a random noise
.
As important as to anonymize a data set is to assess the re-identification risk. For that purpose, at least three approaches are available [10] [11]: prosecutor risk, journalist risk and marketer risk. In the prosecutor scenario, the adversary is supposed to know that the target is in the data set. In that case the estimates of uniqueness are based in the studied population. In the journalist approach, the adversary doesn’t know for certain that the target is in the data set. In that case, the risk should be calculated using bigger populations, like similar studies or the general population. In the last scenario, marketer risk, the adversary wants to re-identify as many subjects as possible. In [12], it is proposed a statistical model to quantify the likelihood for a re-identification attempt to be successful.
They show that, even if the data set is heavily incomplete, it may not satisfy the modern standards for anonymization.
C. Anonymization Tools
There are a number of software tools available to help in the de-identification process and to access re-identification risks. Open source tools include Amnesia [13], a web based application with a Java backend, some tools based on the R language as μ-ARGUS [14] and sdcMicro [15], and Java based tools as Anonimatron [16], a tool compliant with several database systems and ARX [17] the one used in this work. ARX was chosen because it can be used in data sets with up to 50 attributes and millions of records.
D. Contribution and Structure
This paper presents a k-anonymization sensitivity analysis, varying k in the algorithm implemented in ARX software [19] [20]. With worked examples generated from a real dataset made publicly available for the purpose of open government data and accountability – the Enade data. Admitting as a working hypothesis that this set of personal data is protected by law, we assess the risk of re-identification and the loss of data / information for indirect or quasi-identifiers with research value. For instance, some research value variables are: Age, Gender, Race/skin color, Parents’ education. Two processes of anonymization are explored: (1) data suppression; (2) data generalization.
The remaining of the paper consists of three sections. The second section presents data characteristics and the sensitivity analysis study design, the third section presents the results and discussion, and finally the conclusion.
II. METHODOLOGY A. Enade Data
The National Student Performance Exam (Enade) takes place every year in Brazil since 2004. It assesses the higher education graduates’ performance, taking into account several dimensions and skills [18]. The Enade is part of the Brazilian higher education evaluation system (Sinaes), which is also composed by the programs evaluation and institutional evaluation. The results of the exam and students’ answers to the questionnaires provide data to the indicators of higher education quality. Student’s participation is compulsory. The assessment instruments cover several cognitive domains depending on the area of studies, but for the purpose of this article we consider a student’s general score, e.g. grade point average (GPA). We also consider student’s sociodemographic variables such as Gender, Age, self-declared Race/skin color, Mother’s education, and Father’s education. The higher education institution and program identification codes (respectively University id and Program id), and Region are also included in our analyses. The microdata are available at the INEP site [18]. Each year a subgroup of disciplinary areas is evaluated so that whole evaluation cycle occurs over a triennium. According to INEP site, in the first year, the evaluation includes Baccalaureate programs in Health Sciences and related areas, Agrarian Sciences, Engineering and Architecture and Urbanism, Higher Technology Courses in the areas of Environment and Health, Food Production, Natural Resources, Military and Security. In the second year, the
evaluation includes Bachelor courses in the areas of Biological Sciences, Exact and Earth Sciences, Linguistics, Letters and Arts and related areas, Degree courses in the areas of knowledge of Health Sciences; Human Sciences; Biological Sciences; Exact and Earth Sciences; Linguistics, Letters and Arts; Bachelor courses in the areas of knowledge of Humanities and Health Sciences, with courses evaluated in the context of undergraduate degrees; Higher Technology Courses in the areas of Control and Industrial Processes, Information and Communication, Infrastructure and Industrial Production. The third year, Bachelor programs in the Applied Social Sciences and related areas; B.A. programs in the Humanities and related areas. Higher Education programs in Management and Business, School Support, Hospitality and Leisure, Cultural Production and Design.
In 2018, 548,127 students were involved. Table 1 presents the selected variables and the respective scales of measurement as they are listed in the data dictionary.
TABLE I. SELECTED VARIABLES
Variable Scale
University id Between 1 and 23,410 Program id Between 1 and 5,001,389
Region 1 = North (N) 2 = Northeast (NE) 3 = Southeast (SE) 4 = South (S) 5 = Central-West (C-W)
Age Between 4 and 94
Gender
M = Male F = Female
Year of high school conclusion AAAA = Between 0 and 2,686 Year of beginning graduation AAAA = Between 1,973 and 2,099 Grade point average (GPA) Minimum = 0; Maximum= 93.7
Race / Skin color
A =White B = Black C = Yellow D =Pardo E =Indigenous F = Not declared Mother’s education Father’s education A = None B = 1st – 5th grade C = 6th – 9th grade D =Secondary school E =Graduation F = Post-graduation
For the purpose of this study the “Number of years needed to start the graduation” is computed by the difference between the “Year of beginning graduation” minus “Year of high school conclusion”. The “Number of years needed to finish the graduate studies” is computed by difference between the current year (2018) and the “Year of beginning graduation”, plus one. Since some values recorded in the data set were not plausible according to the purposes of ENADE and the Brazilian Educational System, it was necessary to pre-process the dataset.
This data pre-treatment consisted on eliminating the values of the first year of graduation and the last year of secondary school that lead us to the conclusion of negative values for the “Number of years needed to finish the graduate studies” or to the “Number of years to start the graduation”.We also deleted the cases where the starting year of graduation coincided with
the last year, because that is not possible, since in Brazil the academic year agrees with the civil year. Finally, and since it was also incoherent, we ended up eliminating the cases that had the value of first year of entrance in graduating studies greater than 2018. If the value for research variables were all missing data, the respective records were also suppressed at this stage. This whole process resulted in the elimination of 41,447 records from the downloaded data set. To the resulting data set, with 506,680 records, we will now call the original data set.
B. Study Design
The sensitivity analysis considers as input the K and as output the relative risk of re-identification, the loss of subjects, and the absolute deviation between descriptive statistics obtained from the original data set and the k-anonymized data sets. The descriptive statistics calculated are the Mean, Median, Mode, Standard Deviation (SD), Skewness, Kurtosis, Coefficient of Variation (CV) and the Interpercentile Range (IPR = P90 – P10). In addition, the qualitative variables empirical distribution is analysed.
At the first study, the anonymization is conducted by varying K=2, …, 5 and classifying as quasi-identifiers the variables: “University id”, “Program id”, Age, Gender, “Year of high school conclusion”, “Year of beginning graduation”, Race, Mother’s education and Father’s education. The variables Region and the GPA are classified as insensitive, which means not used for anonymization and thus stay untouched. Applying the k-anonymity, with that variable classification, results in a huge loss of information for all values of k.
Considering that the “University id” and “Program id” may be previously pseudo-anonymized, they are not considered as quasi-identifiers in the second study. In addition, we generalize three variables, Age, “Mother’s education” and “Father’s education”. The values of Age are recoded in less than 26 years and equal or greater than 26. For Parents’ education three class intervals are considered: the first includes values A and B of Table I, the second includes values C and D, and the third includes values E and F. Then, the anonymization process is conducted varying K from 2 to 5.
III. RESULTS AND DISCUSSION
Table II presents the percentage of suppressed records resulting from the anonymization approaches described above. As can be seen, the suppression percentage was more than 90%, in the first study, and was less than 15% in the second.
TABLE II. PERCENTAGE OF SUPPRESSED RECORDS
K=2 K=3 K=4 K=5
Dataset without generalization
90.34 96.10 97.76 98.50
Dataset with generalization
4.98 8.59 11.49 14.07
Table III shows the valid cases and the suppressed ones for the chosen variables in the first study. As K increases, the suppressed records increase. A huge loss of data / information occurs. For example, the variable Gender in the original data does not have missing values, so that the number of valid cases
is 506,580, and the percentage of suppressed cases represents 90.34% when k=2. This loss of data may have serious implications on the good-representativeness of the original population in each anonymized dataset. To enlighten that point, a descriptive analysis is conducted and the results presented in Tables IV and V.
Descriptive statistics in Table IV show that the Mean varies according to the variation of K, no matter the variable. Depending on the variable, the Median may or may not remain stable. For example, the Median of “Number of years to complete higher education studies” is 5 in the original dataset, and in any K simulation exercise. The Mode remains stable for every variable analyzed and for K simulation exercise. The dispersion statistics, such as IPR, SD and the CV, show that as K increases as the variability sharply decreases. The skewness and kurtosis estimates suggest that each variable distribution changes with K, but the pattern of change depends on the variable itself.
So, according to Table IV, both SD and IPR always decrease as the k-value increases. This means that the extreme values are successively eliminated, once they might represent atypical cases, since their low expression in the original dataset. In other words, with the increase of k, the major amount of records is not suppressed, unlike the extreme ones. In conclusion, we get to obtain, with the anonymization process, a less diverse distribution, since the values that stand through the whole process get closer to the Mode, as we can confirm with the Mean and Median values.
Furthermore, for the “Number of years to complete graduate studies” both Kurtosis and Skewness decrease, instead of increasing, as it happens with Age and “Number of years needed to start graduation”. Considering its Mean and Median, we can also notice that, against what happens with the other two variables, both values are closer to the Mode, and SD and IPR, in the original data set are lower. This suggests that these distributions are, originally, more homogeneous than the other two, i.e., the existence of extreme values is less frequent, or their deviation from the Mean value is lower than the other variables.
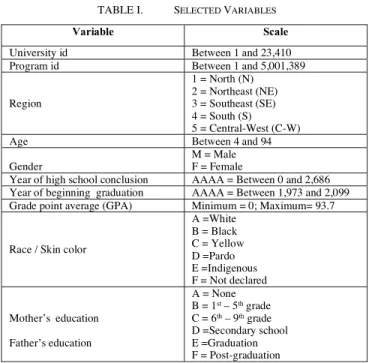
The empirical distribution of Gender, Race/skin color and Parents’ education is presented in Table V. The comparison between the original distribution and the anonymized sample suggests a complete distortion of results. In fact, the distribution of research value variables, such as Gender or Race/skin color, becomes completely misrepresented.
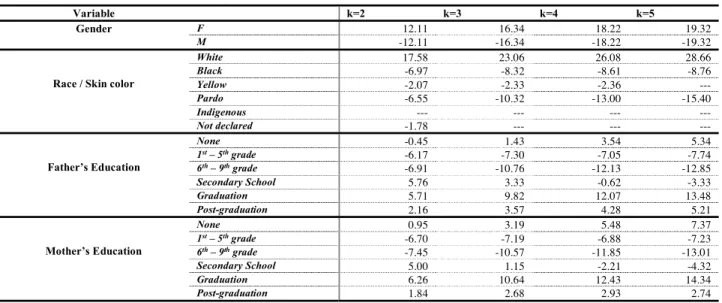
Tables VI and VII present the deviation between the k-anonymized descriptive statistics and the respective original results. Such differences confirm what we have just described. Most of the descriptive statistics are under-estimated as K increases, and the distribution statistics pattern depends on the variable itself. The relative distortion of the empirical distributions tends to favor female students, self-declared White, whose Parents completed high school or higher education. In other words, as long as we eliminate records through the anonymization process, the racial minorities are sharply decreased or even suppressed, the affluent students become overrepresented, and sociodemographic disadvantaged students under-represented.
TABLE III. VALID AND SUPPRESSED CASES FOR ALL VARIABLES AFTER K-ANONYMIZATION WITHOUT GENERALIZATION.
TABLE IV. STATISTICS OF THE QUANTITATIVE VARIABLES IN EACH DATASET AFTER K-ANONYMIZATION WITHOUT GENERALIZATION.
TABLE V. VALID PERCENTAGE FOR EACH CATEGORY OF THE QUALITATIVE VARIABLES AFTER K-ANONYMIZATION WITHOUT GENERALIZATION..
Variable Original k=2 k=3 k=4 k=5
Age Valid 506,680 48,951 19,775 11,342 7,586
Suppressed 0 457,729 486,905 495,338 499,094
Grade Point Average Valid 431,424
Suppressed 75,256
Number of years to start graduation
Valid 496,478 48,113 19,521 11,244 7,532
Suppressed 10,202 458,567 487,159 495,436 499,148
Number of years to complete graduate studies
Valid 496,478 48,113 19,521 11,244 7,532
Suppressed 10,202 458,467 487,159 495,436 499,148
Gender Valid 506,680
Suppressed --- 90.34% 96.10% 97.76% 98.50%
Race / Skin color; Parent’s Education
Valid 506,680
Suppressed 10.70% 91.56% 96.47% 97.90% 98.57%
Variable Mean Median Mode IPR SD Skewness Kurtosis CV
Age Original 29.31 26.00 23.00 19.00 8.24 1.52 2.33 0.28 k=2 24.83 23.00 23.00 9.00 4.73 2.58 7.95 0.19 k=3 24.18 23.00 23.00 7.00 3.88 2.74 8.56 0.16 k=4 23.78 23.00 23.00 5.00 3.24 2.97 10.85 0.14 k=5 23.58 23.00 23.00 5.00 2.88 3.00 10.99 0.12
Grade Point Average 41.90 41.10 37.50 37.8 14.41 0.21 -0.35 0.34
Number of years to start graduation Original 5.13 2.00 0.00 14.00 6.68 1.86 4.00 1.30 k=2 2.15 0.00 0.00 8.00 4.25 2.84 9.67 1.98 k=3 1.71 0.00 0.00 6.00 3.71 2.94 9.80 2.17 k=4 1.40 0.00 0.00 5.00 3.23 3.23 12.81 2.31 k=5 1.20 0.00 0.00 5.00 2.89 3.32 13.96 2.41
Number of years to complete graduate studies Original 4.67 5.00 5.00 5.00 1.91 2.07 12.05 0.41 k=2 4.62 5.00 5.00 2.00 1.13 1.54 12.74 0.24 k=3 4.62 5.00 5.00 1.00 0.86 0.89 9.20 0.19 k=4 4.62 5.00 5.00 1.00 0.69 0.50 4.86 0.15 k=5 4.64 5.00 5.00 1.00 0.65 0.47 4.11 0.14 Variable Original k=2 k=3 k=4 k=5 Region N 5.09 NE 18.18 SE 45.15 S 23.29 C-W 8.29 Gender F 59.50 71.61 75.84 77.72 78.82 M 40.50 28.39 24.16 22.28 21.18
Race / Skin color
White 54.10 71.68 77.16 80.18 82.76 Black 9.00 2.03 0.68 0.39 0.24 Yellow 2.40 0.33 0.07 0.04 --- Pardo 32.40 25.85 22.08 19.40 17.00 Indigenous 0.30 --- --- --- --- Not declared 1.90 0.12 --- --- --- Father’s Education None 8.20 7.75 9.63 11.74 13.54 1st – 5th grade 27.00 20.83 19.70 19.95 19.26 6th – 9th grade 15.40 8.49 4.64 3.27 2.55 Secondary School 30.80 36.56 34.13 30.18 27.47 Graduation 13.70 19.41 23.52 25.77 27.18 Post-graduation 4.80 6.96 8.37 9.08 10.01 Mother’s Education None 6.10 7.05 9.29 11.58 13.47 1st – 5th grade 23.00 16.30 15.81 16.12 15.77 6th – 9th grade 15.50 8.05 4.93 3.65 2.49 Secondary School 33.10 38.10 34.25 30.89 28.78 Graduation 14.40 20.66 25.04 26.83 28.74 Post-graduation 8.00 9.84 10.68 10.93 10.74
TABLE VI. DEVIATION FROM THE ORIGINAL DATASET FOR THE STATISTICS OF THE QUANTITATIVE VARIABLES WITHOUT GENERALIZATION.
TABLE VII. DEVIATION FROM THE ORIGINAL DATASET RESULTS FOR EACH CATEGORY OF THE QUALITATIVE VARIABLES WITHOUT GENERALIZATION
Table VIII shows the second study results. We intentionally include the subset of variables that showed more severity of misrepresentation in study one. It can be observed that the descriptive statistics of “Number of years to start graduation” are closer to the original dataset, even though they present a little underestimation. The Gender and Race/skin color distributions are also closer to the original ones, but the under-representation of minority groups still remains.
Finally, Table IX presents the average risk of re-identification obtained with the ARX tool for the prosecutor scenario. The risk was assessed for both studied data sets, with and without generalization when varying the value of k. The column for k=1 presents the average risk before k-anonymity is performed. As can be seen after the first stage of anonymization the risk of re-identification decreases from more than 90% in the original data, to approximately 14%. With generalization, it is possible to decrease the risk to near 4%. The risk decline is more sensitive to the growth of k in the first study than in the second. In this one, the risk has an acceptable value of 7% even with k=2.
TABLE VIII. SUMMARY OF RESULTS AFTER GENERALIZATION
Number of years to start graduation Gender Race / Skin color k=2 k=5 k=2 k=5 k=2 k=5 Mean 4.74 4.19 SD 6.17 5.52 Skewness 1.79 1.75 Kurtosis 3.50 3.23 % of valid cases Gender F 60.0 61.0 M 40.0 39.0 Race / Skin color White 55.50 57.80 Black 8.50 7.46 Yellow 1.90 1.20 Pardo 32.80 32.87 Indigenous 0.10 0.02 Not declared 1.30 0.66
Variable Mean Median Mode IPR SD Skewness Kurtosis CV
Age
k=2 -4.48 -3.00 0.00 -10.00 -3.51 1.06 5.62 -0.09 k=3 -5.13 -3.00 0.00 -12.00 -4.36 1.22 6.23 -0.12
k=4 -5.53 -3.00 0.00 -14.00 -5 1.45 8.52 -0.14
k=5 -5.73 -3.00 0.00 -14.00 -5.36 1.48 8.66 -0.16
Number of years to start graduation
k=2 -2.98 -2.00 0.00 -6.00 -2.43 0.98 5.67 0.67 k=3 -3.42 -2.00 0.00 -8.00 -2.97 1.08 5.8 0.87 k=4 -3.73 -2.00 0.00 -9.00 -3.45 1.37 8.81 1.00 k=5 -3.93 -2.00 0.00 -9.00 -3.79 1.46 9.96 1.11
Number of years to complete graduate studies k=2 -0.05 0.00 0.00 -3.00 -0.78 -0.53 0.69 -0.16 k=3 -0.05 0.00 0.00 -4.00 -1.05 -1.18 -2.85 -0.22 k=4 -0.05 0.00 0.00 -4.00 -1.22 -1.57 -7.19 -0.26 k=5 -0.03 0.00 0.00 -4.00 -1.26 -1.60 -7.94 -0.27 Variable k=2 k=3 k=4 k=5 Gender F 12.11 16.34 18.22 19.32 M -12.11 -16.34 -18.22 -19.32
Race / Skin color
White 17.58 23.06 26.08 28.66 Black -6.97 -8.32 -8.61 -8.76 Yellow -2.07 -2.33 -2.36 --- Pardo -6.55 -10.32 -13.00 -15.40 Indigenous --- --- --- --- Not declared -1.78 --- --- --- Father’s Education None -0.45 1.43 3.54 5.34 1st – 5th grade -6.17 -7.30 -7.05 -7.74 6th – 9th grade -6.91 -10.76 -12.13 -12.85 Secondary School 5.76 3.33 -0.62 -3.33 Graduation 5.71 9.82 12.07 13.48 Post-graduation 2.16 3.57 4.28 5.21 Mother’s Education None 0.95 3.19 5.48 7.37 1st – 5th grade -6.70 -7.19 -6.88 -7.23 6th – 9th grade -7.45 -10.57 -11.85 -13.01 Secondary School 5.00 1.15 -2.21 -4.32 Graduation 6.26 10.64 12.43 14.34 Post-graduation 1.84 2.68 2.93 2.74
TABLE IX. AVERAGE PROSECUTOR RISK OF RE-IDENTIFICATION
K = 1 k = 2 k = 3 k = 4 k = 5
Dataset without generalization
94.16% 39.56% 24.18% 17.37% 13.59%
Dataset with generalization
42.23% 7.03% 5.54% 4.42% 3.80%
IV. CONCLUSION
In this work a sensitivity analysis over the k value of the ARX k-anonymization algorithm was performed. Using real data published by INEP, the Institute for the Brazilian educational system evaluation, the impact of varying the value of k on the percentage of suppressed records and the impact on the re-identification risk was assessed. Two main setups were considered: K-anonymization without any generalization and k-anonymization with generalization of three personal attributes, Age of the student and Mother’s and Father’s education level. Descriptive statistics for all the anonymized data sets were calculated in order to assess the value of the data that remains after each anonymization stage. The results obtained corroborate the conclusion presented recently by Sweeney in [2], “In today’s data-rich, networked society, the k constraint must be enforced across all fields or scientific justification provided to exclude a field” ([2], p. 1). In addition, our results confirm that the minorities and socioeconomic disadvantaged groups become under-represented after the anonymization as [2] concluded.
REFERENCES
[1] Regulation (EU) 2016/679 of the European Parliament and of the Council of 27 April on the protection of natural persons with regard to the processing of personal data and on the free movement of such data, and repealing Directive 95/46/EC (General Data Protection Regulation) in Official Journal of the European Union, L 119, pp. 1–88, 2016. [2] L. Sweeney, M. V. Loewenfeldt, M. Perry, “Saying it’s Anonymous
Doesn't Make It So: Re-identifications of “anonymized” law school data,” Technology Science. 2018111301. November 13, 2018. https://techscience.org/a/2018111301.
[3] L. Sweeney. “k-anonymity: a model for protecting privacy,” International Journal on Uncertainty, Fuzziness and Knowledge-based Systems, Vol. 10 (5), pp 557-570, 2002.
[4] P. Samarati. “Protecting Respondents' Identities in Microdata Release,” IEEE Transactions on Knowledge and Data Engineering, Vol. 13 (6), pp. 1010-1027, 2001.
[5] V. Ayala-Rivera, P. McDonagh, T. Cerqueus and L. Murphy, “A Systematic Comparison and Evaluation of K-Anonymization Algorithms for Practitioners,” Trans. on Data Privacy, vol. 7(3), pp. 337-370, 2014. [6] A. Campan, T. M. Truta and N. Cooper, “P̺Sensitive K̺Anonymity
with Generalization Constraints,” Transactions on Data Privacy, vol. 3, pp. 65–89, 2010.
[7] M. Al-Zobbi, S. Shahrestani, C. Ruan “Sensitivity-based Anonymization of Big Data,” IEEE 41st Conference on Local Computer Networks Workshops, pp. 58-64. 2016.
[8] G. Ursin, S. Sen, J. Mottu and M. Nygard, “Protecting Privacy in Large Datasets - First We Assess the Risk; Then We Fuzzy the Data, Cancer Epidemiology Biomarkers & Prevention,” vol 26(8), pp.1219- 1224, 2017.
[9] D. Avraam, A. Boyd, H. Goldstein, P. Burton, “A software package for the application of probabilistic anonymisation to sensitive individual-level data: a proof of principle with an example from the ALSPAC birth
cohort study,” Longitudinal and Life Course Studies, Vol 9 (4), pp.433-446, 2018. DOI: http://dx.doi.org/10.14301/llcs.v9i4.478.
[10] L. Kniola, “Plausible Adversaries in Re-Identification Risk Assessment” PhUSE Annual Conference, 2017.
[11] F. Prasser and F. Kohlmayer, “Putting statistical disclosure control into practice: the ARX data anonymization tool,” in A. Gkoulalas-Divanis and G. Loukides (Ed.s) Medical Data Privacy Handbook. Cham, Switzerland: Springer International Publishing; 2015. p.111–48. [12] L. Rocher, J. M. Hendrickx, Y. Montjoye, “Estimating the success of
re-identifications in incomplete datasets using generative models,” Nature Communications, 2019; 10(1) DOI: 10.1038/s41467-019-10933-3. [13] Amnesia. A data anonymization tool supported by the Institute for the
Management of Information Systems. Available from: https://amnesia.openaire.eu/installation.html.
[14] μ-ARGUS - Anti Re-identification General Utility System. Available from: http://neon.vb.cbs.nl/casc/mu.htm.
[15] sdcMicro - Statistical Disclosure Control Methods for Anonymization of Data and Risk Estimation. Available from: https://cran.r-project.org/web/packages/sdcMicro/index.html.
[16] Anonimatron. Available from: https://realrolfje.github.io/anonimatron/. [17] ARX - Data Anonymization Tool. Available from:
https://arx.deidentifier.org/.
[18] INEP - Instituto Nacional de Estudos e Pesquisas Educacionais Anísio Teixeira, “Exame Nacional de Desempenho dos Estudantes (Enade),” 2018. [Online]. Available: http://portal.inep.gov.br/enade. [Accessed: 15-Feb-2020].
[19] F. Kohlmayer, F. Prasser, C. Eckert, A. Kemper and K. A. Kuhn, “Flash: Efficient, Stable and Optimal K-Anonymity.” 2012 ASE/IEEE International Conference on Social Computing and 2012 ASE/IEEE International Conference on Privacy, Security,Risk and Trust, pp. 708- 717, DOI: 10.1109/SocialCom-PASSAT.2012.52.
[20] J. Eicher, R. Bild, H. Spengler et al.”A comprehensive tool for creating and evaluating privacy-preserving biomedical prediction models,” BMC Med Inform Decis Mak 20, 29 (2020). https://doi.org/10.1186/s12911-020-1041-3.