Fabio José Martins Coelho
UMinho|20
15
April, 2015
The impact of inves
tor sentiment in t
he Swiss s
tock mark
et
Universidade do Minho
Escola de Economia e Gestão
The impact of investor sentiment in the
Swiss stock market
Fabio José Mar
Master thesis in Finance
Supervisor:
Professor Cristiana Cerqueira Leal
Fabio José Martins Coelho
Universidade do Minho
Escola de Economia e Gestão
The impact of investor sentiment in the
Swiss stock market
Declaração
Nome: Fabio José Martins Coelho Bilhete de Identidade: 13594905
Endereço eletrónico: fabio.coelho.27@gmail.com Escola: Escola de Economia e Gestão
Departamento: Gestão
Designação do Mestrado: Finanças
Tema: The impact of investor sentiment in the Swiss stock market Orientador: Prof. Cristiana Cerqueira Leal
Ano conclusão: 2015
É autorizada a reprodução integral desta dissertação apenas para efeitos de investigação, mediante declaração escrita do interessado, que a tal se compromete.
Acknowledgements
It is with great pleasure that I write this point of the dissertation, thanking all those who contributed in some way to the accomplishment of the dissertation.
First of all, I would like to thank my supervisor for this study, Professor Cristiana Cerqueira Leal for her complete availability, dedication and demonstrated competence. Her valuable behavioural finance knowledge inspired my interest for this research area.
I would also like to thank my family and especially my parents. They witnessed some frustration and discouragement over the past two years, when it was not always easy to be far away from my home country. I could always rely on them during difficult times.
Finally, I extend my sincere gratitude to the University of Minho and the School of Economics and Management.
Abstract
This research investigates if investor sentiment is priced in the Swiss stock market. Using an indirect measure of sentiment, the monthly changes in investor sentiment are studied based on the Baker and Wurgler's (2007) sentiment index model composed by six sentiment proxies. The sentiment index is composed by the number of IPOs, the average first-day return on IPOs, closed-end fund discount, the share turnover, the share of equity issues and the dividend premium. The predictions are that for difficult to value and riskier to arbitrage stocks, investor sentiment should be more accentuated. Establishing portfolios using different types of stocks, the principal findings after this sorting approach are that when sentiment is high (low), subsequent returns are comparably low (high) for small firms, unprofitable firms, high growth and distressed firms. The predictions telling that sentiment has stronger effects on hard to value and difficult to arbitrage stocks are broadly confirmed conducting a regression approach.
Resumo
Este estudo investiga a presença de sentimento do investidor no mercado suíço e o seu impacto no desempenho do mercado e em grupos específicos de ações. Usando uma medida indireta de sentimento, as variações mensais no sentimento do investidor são determinadas baseadas no modelo de índice de sentimento de Baker and Wurgler (2007) composto por seis proxies de sentimento: o número de IPOs, o retorno médio do primeiro dia em IPOs, o desconto dos fundos fechados, a quota de volume de negócios, a quota de emissões de ações e o prémio de dividendos. As previsões são que para ações difíceis de avaliar e de risco mais elevado, o sentimento de investidor deve ser mais acentuado. Construindo diferentes carteiras com base em características de ações verifica-se que quando o sentimento é alto (baixo), os retornos subsequentes são comparativamente baixos (altos) para as pequenas empresas, empresas não rentáveis, empresas de elevado crescimento e para empresas em dificuldades financeiras. As previsões que o sentimento do investidor tem efeitos mais acentuados sobre ações difíceis de avaliar e de risco mais elevado são amplamente confirmadas com as regressões.
Table of Contents
1. INTRODUCTION 1
2. LITERATURE REVIEW 4
3. DATA 8
3.1RETURNS AND CHARACTERISTICS 8
3.2SENTIMENT PROXIES 11 4. METHODOLOGY 13 4.1EMPIRICAL METHOD 13 4.2SENTIMENT INDEX 14 5. EMPIRICAL RESULTS 21 5.1SORTING 21
5.2LONG-SHORT PORTFOLIOS REGRESSIONS 27
5.3SYSTEMATIC RISK 32
6. CONCLUSIONS 35
7. APPENDICES 36
1. Introduction
For the defenders of traditional finance theories, investors are rational and markets efficient, so that prices reflect the fundamental value of the asset. In case of a price deviation from the fundamental value, prices will be corrected by arbitrageurs (Fama (1979), Sharp (1964)). The idea is that rational investors will eliminate sentiment effects by seeking to exploit profitable opportunities caused by mispricing. Although, for an imperfect capital market, arbitrageurs may find it too costly and risky to engage in arbitrage activities. Nonetheless, it is documented in recent financial literature, how financial market anomalies (bubbles, crashes, etc.) were unsuccessfully explained by traditional finance theories, so that behavioural finance assumptions replaced some of the traditional rationality assumptions. Since the last decade, the large amount of empirical evidence proved that there is no longer a debate if behavioural finance has its place in the financial markets or not but how to study its impact on the financial markets. Behavioural finance theories assume that investors are prone to exogenous sentiment waves and to a reduced rationality. Investor sentiment can cause an incorrect valuation of asset values. This mispricing is only corrected when economic fundamentals are revealed so that sentiment decreases. Briefly defined, investor sentiment is a belief about future cash flow and investment risk, which are not justified by the facts at hand (Baker and Wurgler (2007)).
Behavioural finance literature investigates the sentiment effects of price deviations so that former behavioural empirical studies explain how investor sentiment predicts stock returns. Even if the different studies use diverse investor sentiment proxies for their valuation, an indication that investor sentiment is able to predict stock returns (Brown and Cliff (2005) and Dergiades (2012)) is that when sentiment is high, future stock returns tend to be lower, and vice versa. Using a cross-sectional approach, Schmeling (2009) studied investor’s sentiment effects for 18 industrialised countries, concluding that on average investor sentiment is an important predictor of stock returns. As shown by Baker and Wurgler (2006), using an elaborated profitable strategy, it is possible to take benefits from sentiment fluctuations, depending on the stock characteristics.
The principal studies published about the impact of investor sentiment in the stock market are mainly focused on the U.S. market (e.g.; Baker Malcolm & Wurgler Jeffrey (2007), Brown and Cliff (2004)). Inspired by other European and International studies such as Baker, Wurgler and Yuan (2012) or Schmeling (2009) that also implemented U.S. market based researches successfully for different countries, the study focus on the equity stocks listed in the Swiss stock market. The Six Swiss Stock exchange is the main stock market in Switzerland and is used for this study. The Swiss equity market has arguably been the best performing developed world market over the past 20, 10, 5 and 2 years (Marwan Naja, AS Investment Management (2010), Appendix
1). The valuations are in line with the main developed world markets. During turbulent
times, such as the recent crisis, volatility tends to be significantly lower compared with other markets. The Swiss market is an internationally oriented and potent capital market with a world-class securities exchange. Also, Switzerland is one of the World-leading financial centres and is supported by its famous banking sector. The Swiss-based banks have strong placement resources and highly qualified financial experts. Additionally, the Swiss financial wealth is attractive for companies seeking to finance their growth and secure their long-term prosperity, which plays an important role in a company’s choice of location. It is an industrialised stock market viewed as stable with sophisticated investors. Furthermore, the Swiss Franc had an appreciation in its value for the last 40 years becoming an interesting financial instrument.
Mainly using Baker and Wurgler’s (2006) methodology, the research analyses the impact of investor sentiment for the Swiss market. The study contributes to the literature by conducting a comparison on how differently investor sentiment affects stock market returns in Switzerland. Adopting an international perspective, new hypotheses on the impact of investor’s sentiment in stock returns could be formed. Using the Swiss stock market, the research can provide an out-of-sample for previous findings from the U.S. studies for another strong financial market.
The research analyses the impact of the predictive ability of investor sentiment on the cross-section of stock returns in Switzerland. In a first part of the research, a sentiment index will be constructed, based on the common variation of six underlying proxies for sentiment: closed-end fund discount, turnover, number of IPOs, average first-day return on IPOs, the equity share in the new issues and the dividend premium. To remove business cycle variations from the six sentiment proxies these are orthogonalised with respect to macroeconomic conditions. With the aid of the composed index, stocks
characteristics that are more affected by investor are identified. Investor sentiment is expected to have a stronger impact on small, high volatility, unprofitable, high growth and distressed firms.
To examine how cross-sectional stock returns vary within monthly sentiment, financial data concerning stock prices and returns from Datastream for the period of 1990 to 2010 are used. For every month and different stock characteristics, stocks are sorted into ten different portfolios and also according to high and low sentiment periods.
Furthermore, a regression analysis is performed to analyse the investor sentiment effect on stock returns. Using traditional asset pricing factors introduced by Fama and French (1993) and a traditional momentum factor, the approach controls for the size, growth opportunity and the momentum effect. The results obtained from the regressions partially confirm the significance of the patterns from the sorting approach. In Switzerland, during high sentiment periods, subsequent returns are comparably low for small firms, unprofitable firms, high growth and distressed firms. And vice versa. In general, the results are also in line with the predictions that hard to value stocks are difficult to arbitrage.
The rest of the thesis is organised as follows. Section 3 gives a review of the existing literature on investor sentiment. Section 4 details the empirical method and the data for the empirical analysis used. Section 5 presents the empirical evidence. Section 6 concludes.
2. Literature Review
Investor sentiment in the stock market is defined as the overall attitude of investors toward a particular financial market or security. Sentiment influences the activity and price movements of securities traded in a stock market, we have a bullish market in case of rising prices and a bearish market for falling prices. Investor sentiment is a belief about future cash flows and investment risks not explained with the facts at hand (Baker and Wurgler (2007)).
Behavioural finance theories demonstrate that less rational investors, also called mood investors, have impact on asset prices with important implications concerning portfolio selection and asset management. Investor sentiment can lead to market bubbles followed by massive devaluations resulting in severe market pricing errors. Investors’ opinions and decisions are usually influenced by emotions, affecting investment risk and future cash flows. Concerning the sentiment-return relation, behavioural finance theories showed opposing findings compared to classical finance theories which tells us that the discounted value of future cash flows is reflected by stock prices and less rationale market participants are eliminated by arbitrageurs. In the classical finance theory, investors are presumed to be rational, whereas behavioural finance theory insists that waves of irrational sentiment have an impact on stock prices (Schmeling, 2009). Previously provided evidence focused on demonstrating a negative sentiment-return relation in the U.S. stock market and how sentiment predicts stock returns using investor sentiment proxies (e.g. Lemmon and Portniaguina (2006), Brown and Cliff (2005)). Black (1986) concludes that a high number of small events caused by noise factors have a higher impact as compared to a small number of large events. Noise traders may increase the liquidity of the stock market as they also decrease market efficiency as well. In 1990, De Long, Shleifer, Summers and Waldmann inspired many behavioural models of securities markets, which conclude that investors are rational arbitrageurs or irrational traders. Both are present in the market and they are responsible for setting prices and expected returns. Even though, as we know, prices are not always at their fundamental values, explained by the fact that rational arbitrageurs are affected by short time horizons or from risks and costs of short selling. They conclude that investor sentiment is the systematic factor that affects stock prices in markets with limited arbitrage. Schmeling (2009) studied the possible expected effects on stock
returns for 18 industrialised countries using consumer confidence as a proxy for investor sentiment. He concludes that when sentiment is high, future stock returns tend to be lower and vice versa. The same results were obtained for value stocks, small stocks, growth stocks, and for various forecasting horizons.
To study investor sentiments impacts on the different type investment assets it’s important to find the correct sentiment evaluation method, which can be a complex task that can be solved using proxies that remain useful over time. Investor sentiment is measured based on two different methods. Firstly, surveys that ask individuals about their feelings on current or future stock market and economic conditions are the direct measure of measuring investor sentiment. Consumer confidence surveys are the most used in the sentiment literature (Bram and Ludvigson (1998)). However, relying on surveys for measuring investor sentiment can be problematic because of the inaccurate answers of some participants. Therefore, authors like Lee, Thaler and Shleifer (1991) and Dorn (2009) suggest using indirect measures as sentiment proxies. The indirect measure is the second method for sentiment evaluation and consists on using market variables. This last measure uses price movements, trading patterns or market statistics to collect the overall degree of investor sentiment.
Malcolm Baker and Jeffrey Wurgler (2006) used different proxies that they consider useful to measure investor sentiment. The principal proxies utilised to construct a sentiment index were: trading volume, premia on dividend paying stocks, closed end fund discounts (CEFD), volume of initial public offerings (IPOs), average first-day returns on IPOs and new equity issues. They found that in periods of high sentiment, younger stocks, small stocks, unprofitable stocks, non-dividend-paying stocks, high volatility stocks, extreme growth stocks and distressed stocks are more sensitive to subjective valuations and fluctuations in the propensity of speculation. Additionally, these stocks are likely to have lower liquidity and higher idiosyncratic risk, in other words, they are riskier and arbitrage will be costlier. Therefore, these stocks are more profoundly affected by shifts in investor sentiment. Brown and Cliff (2004) investigate investor sentiment and its relation to near-term stock market returns. They conclude that there is a relation between indirect measures and direct measures of investor sentiment. However, past market returns are also an important determinant of sentiment. However, taking in consideration the correlation between sentiment levels and changes with contemporaneous market returns, the authors proved that for near-term stock returns, sentiment has only a little predictive capacity.
Additionally, using long-horizon regressions, the author demonstrated that only institutional sentiment forecasts stock market returns correctly for intermediate horizons. Lemmon and Portniaguina (2006) used consumer confidence to measure investor sentiment. The authors found that consumer confidence and its sentiment component give an explanation for a time variation in size premium. The paper concludes that optimistic investors tend to overvalue small stocks compared to large stocks and vice versa. Additionally, stocks with low (high) institutional ownership have low (high) future returns following initial high measured sentiment. Finally, consumer confidence in correlation with direct surveys is able to predict aggregate market returns. In line with recent evidence for the U.S., Shleifer and Vishny (1997) used the volatility of stocks to prove the limits of arbitrage. In their assumption, volatility is a measure of risk in the stock returns. They wrote that arbitrageurs avoid strong volatile stock position considering it too risky. Volatility is seen as possible higher returns but it also includes a higher risk position for the arbitrageur that has to deal with the pressure of the investors in case of bad scenarios. They conclude that the market mechanism to set prices back to their true value by arbitrageurs does not hold. Recently, Baker, Wurgler and Yuan (2012) studied how global and local components of investor sentiment affect stock markets and if it spreads across markets. They came to the conclusion that global and local components of sentiment could predict returns on high sentiment beta portfolios. Chang, Faff and Hwang (2012) used domestic consumer confidence of 23 different equity markets as proxy indicators for sentiment. The authors conclude that accessible markets tend to have stronger sentiment effects, suggesting that the spread of sentiment across borders is due to capital flows. Additionally, a strong domestic legal and information environment leads to weaker local but stronger global sentiment effects. Furthermore, a good legal environment is the primary concern for behavioural investors seeking foreign investment opportunities rather than lower transactions costs.
The effects of investor sentiment on stock returns can be demonstrated using cross-section analysis, which is also used for this research. Baker and Wurgler (2006) constructed an investor sentiment index based on six proxies that they considered able to illustrate the cross-sectional impact of stock returns. They explained a particular sentiment effect associated with firm characteristics. Young, small size, unprofitable, growth, distressed and non-dividend-paying stocks are practically more affected by sentiment changes. These stocks have a higher risk level and a high-priced arbitrage because of their lower liquidity and higher idiosyncratic risk. Additionally, these types
of stocks have a certain lack of earnings history, which increases speculations. The authors conclude that when in the beginning-of-period proxies have low sentiment, the following returns are relatively high for small, young, growth and distressed stocks (and vice versa). Baker and Wurgler (2007) considered the limit on arbitrage and the propensity to speculate as two possible explanations for sentimental trading. They reported that sentiment has a higher influence for riskier considered firms. In other words, sentiment shifts impact small stock returns rather than large stocks. To summarise, Baker and Wurgler (2006, 2007) found that small stocks, young stocks, high volatility stocks, unprofitable stocks, non-dividend-paying stocks, extreme growth stocks and distressed stocks are the most heavily affected by periods of pessimism, and likely to suffer from over- or under-pricing, depending on investor sentiment. Lee, Shleifer and Thaler (1991) studied the closed-end fund puzzle and came to the conclusion that closed-end fund and small stocks tend to be held by individual investors. Also, when small stocks do well, the discounts on closed-end funds tend to be smaller. Verma and Verma (2008) proved the existence of important positive or negative effects due to investor sentiment on stock returns for institutional and individual investors. The positive effects are greater on stock returns compared with irrational sentiments. On the other hand, there is a presence of significant (insignificant) negative effects of irrational (rational) sentiments on volatility. Lee, Jiang and Indro (2002) proved that sentiment is a systematic risk, which has to be priced. Excess returns are positively correlated with shifts in sentiment. Furthermore, the significance of bullish or bearish changes in sentiment influences a downward or upward revision in volatility, which means higher or lower returns.
This research analyses the effects of investor sentiment on common stocks for the Swiss stock market, testing if the results obtained by Baker & Wurgler (2006) are also apply to the Swiss market.
3. Data
The data includes stock returns and firm characteristics such as: size, total risk, profitability, dividend policy, tangibility, growth opportunities and distress. All variables are collected from the DataStream database on a monthly basis. The data concerning the six different sentiment proxies is collected on a monthly basis and obtained from DataStream and SDC. The sample contains all common stocks in Swiss francs in the Six Swiss Exchange from 1990 to 2010. The chosen time frame has the advantage of capturing various periods in which investor sentiment is expected to be varying from relatively high to low. The Six Swiss Exchange is based in Zurich and is Switzerland’s principal stock exchange. The Swiss equity market is a high performing developed market that has exhibited lower volatility than comparable markets in the past 20 years (Appendix 1), which makes it attractive for studying the effects of investor sentiment. To simplify calculations, the firm-level accounting data for previous fiscal year-ends (t-1) is matched to monthly returns in the current calendar year (t).
3.1 Characteristics and Returns
Table 1 provides summary statistics1 of all returns and characteristics variables following Baker and Wurgler’s (2006) terminology. Panel A outlines the returns variables. Returns (R) are obtained from monthly changes in the Total Return Index (RI) that includes dividend yield. The accumulations of 11 monthly returns from 12 to 2 months prior to the given month are used to obtain Momentum (MOM).
Firm and security characteristics are recapped in the remaining panels. Panel B reports the size and total risk characteristics. Size is obtained with the log of Market Equity (ME). Market Equity is represented as the multiple of the stock price and its number of common shares outstanding. In order to obtain the values for Total Risk (σ),
the annualised standard deviation in monthly returns for the 12-month period is
computed, from January to December each year.
Panel C stands for the profitability variables. Return on Equity (E/BE) is defined for firms with positive earnings. To obtain Earnings (E), the net income before extraordinary items/preferred dividends is added to deferred income taxes and investment tax credit on income statements, subtracting preferred dividend requirements. The computation of the total shareholders’ equity plus deferred taxes on balance sheets gives us the value of the Book Equity (BE). A dummy variable for probability (E>0) is used to distinguish profitable from unprofitable firms, defined with the value 1 for profitable and 0 for unprofitable firms.
Panel D represents dividend characteristics. The ratio of Dividends to Equity (D/BE) is obtained defining Dividends (D) as the multiplicity of dividends per share (DPS) and the number of shares outstanding divided by Book Equity (BE). In this case a dummy variable for the Dividend policy (D>0) equals 1 for firms paying dividends and 0 for non-dividend paying firms.
Panel E reports characteristics of asset tangibility, including PPE/A and RD/A. The Proportion of Gross Plant, Property and Equipment (PPE) and the Proportion of Research and Development expenses (RD) are divided by total Assets (A) to obtain PPE/A and RD/A respectively.
Panel F shows characteristics of growth opportunities and distress. The book-to-market ratio (BE/ME) is obtained by the book equity over book-to-market equity for the 12-month period prior to the current observation. Additionally, the characteristic of external finance (EF/A) is measured as the ratio of external finance that represents companies using external financing sources divided by total assets in the previous year. Sales growth is calculated as the percentage change of net sales or revenues over the year.
Table 1
Summary Statistics, 1990 – 2010
The following table summarises all returns and characteristics variables on a monthly basis. Panel A presents the returns variables. Returns (R) are calculated as monthly changes in the Total returns index (RI) that also includes dividend yield. Momentum (MOM) is obtained as the cumulative return for the 11-month period between 12 and 2 months prior to t. Panel B reports size and total risk characteristics. Size is computed as the log of market equity (ME), which is obtained as price times shares outstanding. Total risk (TOT_RISK) is calculated as the annual standard deviation in monthly returns for the 12-month period, from January to December of each year. In Panel C, the return on equity (E/BE) is defined for firms with positive earnings. Earnings (E) are obtained calculating extraordinary items plus income statement deferred taxes minus preferred dividend. Book equity (BE) is computed as shareholder’s equity plus balance sheet deferred taxes. A profitability dummy variable (E>0) is also included, where 1 stands for profitable firms and 0 for unprofitable firms. Panel D presents dividend variables, including dividends-to-equity (D/BE) and a dividend dummy variable (D>0). Dividends (D) are defined as dividend per shares times shares outstanding. The dividend dummy variable (D>0) is equal to 1 for firms paying dividends and 0 for non-paying dividend firms. Panel E reports measures of tangibility. Plant, property and equipment (PPE) and research and development (RD) are divided by total assets (A), obtaining PPE/A and RD/A. Panel F summarises growth opportunities and distress variables. The book-to-market ratio (BE/ME) is obtained as the book equity over market equity for the 12-months prior to t. External finance (EF) represents company financing from outside sources, including the issuance and retirement of stock and debt. Sales growth (GS) is calculated as the percentage change in net sales over the year. Finally, in Panels C through F, accounting data from the fiscal year ending in t-1 are matched to monthly returns in calendar year t.
3.2 Sentiment Proxies
The literature suggests that investor sentiment can be studied using two different approaches; the direct approach, which consists in using proxies based on investor surveys such as investor confidence indexes and the indirect approach that uses sentiment proxies based on market variables. The indirect approach has attracted more attention, using market statistics for measuring the overall sentiment. However, there are no definitive or uncontroversial measures. Following Baker and Wurgler’s (2006) methodology, a composite sentiment index is composed using the common variation of 6 sentiment proxies2 including the number of IPOs (NIPO), the average first-day return on IPOs (RIPO), closed-end fund discount (CEFD), the share turnover (TURN), the share of equity issues (ES) and the dividend premium ( �−��).
Firstly, the closed-end fund discount (CEFD), is defined as the value weighted average between a closed-end stock fund’s net asset value (NAV) and its market price to its NAV. For funds trading at a discount, CEFD takes positive values and vice versa. Prior studies, such as Zweig (1973) and Delong et al. (1990), debate about how CEFD could be a sentiment index that captures investor expectations, in other words, bearish retail investors are a synonym for higher discounts, which is a compensation for the buyers (Baker and Wurgler, 2007).
Secondly, the share turnover (TURN) is the ratio obtained dividing the total value of shares traded during the period by the average market capitalisation for the same period. Baker and Stein (2004) suggest that turnover, or liquidity generally, can serve as sentiment index. In a market with short sales constraints, irrational investors might prefer betting on raising stocks when they are optimistic rather than pessimistic, thus adding liquidity. For Jones (2001), liquidity is seen as a symptom for overvaluation. In other words, the relationship between turnover and market returns is expect to be negative.
Thirdly, NIPO and RIPO are the number and the average of fist-day returns on IPOs. The IPO market is frequently viewed as sensitive to sentiment, so high first-day returns on IPOs are considered to determine investor enthusiasm. Insiders and long-run shareholders enter the equity market in times of high valuations; so the reason for using NIPO is that its demand increases in periods of high sentiment. Evidence of
low-long returns to IPOs that proves successful market timing related to market index was confirmed by Stigler (1964), Ritter (1991) and Loughran, Ritter and Rydkvist (1994). The difference between the first trading price and the offer priced divided by the offer price, represents RIPO.
Fourthly, the share of equity issues (ES) is a measure financing activity able to capture investor sentiment. For Baker and Wurgler (2000), investor sentiment could cause an equity overvaluation. This explains the reason for a higher equity issuance than debt issuance, so that in periods of higher sentiment levels the cost of capital is reduced. The authors also proved that higher values of equity share forecast low stock market returns. The equity share is defined as gross equity issuance divided by gross equity plus gross long-term debt issuance; the data is obtained from the Six Swiss
Exchange.
Finally, the dividend premium ( �−��) is characterised as the log difference between the average market-to-book ratios of the payers and nonpayers. This variable should be used as proxy for investor demand for dividend-paying stocks (Baker and Wurgler, 2004). The dividend premium stands for the dividends payment tendency of a firm, for a good financial wealth but also for lower growth opportunities (Fama and French, 2001). To summarise, the dividend premium could be used as proxy for this type of firms.
4. Methodology
A useful sentiment index using the different chosen proxies is formed, so that sentiment fluctuations over time can be compared with the different market characteristic and returns. The index captures the common component of each proxy and also incorporates the fact that some variables take a longer time period to confirm the same sentiment. A principal component analysis (PCA) is done to extract the principal component of the six and their lags. Also, using the correlation between the different variables it will be possible to construct the index and to know its explanation power of the sample variance. Finally, 4 macroeconomic factors are used to eliminate the business cycle effect obtaining an orthogonalised index and its explanation power.
4.1 Empirical method
Theoretical and historical facts advocate that sentiment could cause systematic patterns of mispricing. Due to the fact that mispricing is hard to identify directly, the study’s approach is to look directly for systematic patterns of mispricing corrections. Additionally, in order to identify sentiment-driven changes in cross-sectional predictability patterns, the common impact of characteristics across all time periods and common impact of investor sentiment on all stocks need to be controlled. Following a similar methodology introduced by Baker and Wurgler (2006), the impact of investor sentiment on stock returns is captured based on the following model:
�− [ ��] = � + � �− + �′���− + �′ �− ���−
where i represents firms, t represents time, x represents a vector of firms’ characteristics, and T represents a sentiment proxy. The coefficient � captures the
generic effect of investor sentiment, � captures the generic effect of firm characteristics on stock returns whereas � captures sentiment-driven mispricing in cross-sectional patterns. Therefore, the null hypothesis, i.e. � = , suggests that the non-zero effect on stock returns only exists for compensation of systematic risk. On the contrary, if the null hypothesis is rejected, i.e. � ≠ , systematic patterns of correction for mispricing might be expected. Due to the fact that the causes of mispricing on stocks vary across sections, a cross-sectional approach is taken into consideration.
4.2 Sentiment Index
Prior research proved that each sentiment proxy includes a sentiment component useful to construct a sentiment index. Nevertheless, the sentiment component captured by each proxy also includes other non-sentiment-related components. Additional, Baker and Wurgler (2006) noticed that some proxies do not reflect the fluctuation of sentiment simultaneously in time, due to a non-contemporaneous relationship between these proxies and investor sentiment. To summarise, there is a lead-lag relationship issue due to variables that may reflect earlier/later a given shift in sentiment compared with others. Each sentiment proxy is calculated on a monthly basis from 1990 to 2010. Applying the Baker and Wurgler's (2006) methodology, I construct a composite investors sentiment index based on the six chosen proxies.
Using principal component analysis (PCA), the principal component of the six proxies (CEFD, TURN, NIPO, RIPO, ES, PD-ND) and their lags (CEFD t-1, TURN t-1, NIPO t-1, RIPO t-1, ES t-1, PD-ND t-1) is extracted. This gives us a first-stage index with 12 loadings, one for each of the current and lagged proxies respectively. The next step is to compute the existing correlation between the first-stage index and the current and lagged values of each of the proxies, resulting in the selection of 6 current or lagged proxies that have higher correlation within each pair. Using the 6 chosen proxies the PCA is redone, obtaining the first principal component for these 6
proxies. After rescaling the coefficients the following index with unit variance is obtained:
�
�= − .
�− .
�−+ .
�
�+
.
�
�−+ .
�− .
��−��(1)
The first principal component has a 31% explanation power of the sample variance, concluding that almost 1/3 of the variance is captured by this factor. Analysing the
�
� index appealing properties, only the turnover proxy does not havethe expected sign comparing with Baker and Wurgler’s (2006) sentiment index. Recognising that the PCA is not capable of extracting common component variations taking into consideration if they are based on a sentiment or on a business cycle component, explaining the reason why the index is not consistent with the predictions. A second index was explicitly constructed to remove the effects of business cycle. Specifically, each of the six raw proxies is regressed on 4 macroeconomic variables to eliminate the business cycle effect. The 4 chosen macroeconomic variables are: firstly, the Consumer Price Index (CPI), which measures the development of the cost of living. Secondly, the Industrial Production Index (IPI), indicating the amount of manufacturing, mining, electric and gas industries. Thirdly, the Gross Domestic Product (GDP), which is a known indicator for the total value added in a country. Finally, the Policy Interest Rate (PIR) is used because of its characteristics to reflect a country’s monetary policy. The six proxies presented in the SENTIMENT index are regressed as a function of the 4 macroeconomic variables. The residuals obtained from the regressions are labelled with a superscript (⊥) and can be seen as cleaner proxies for investor sentiment. Following the same procedure as before the PCA is repeated to extract the first component for the six orthogonalised proxies.
�
�⊥= −
�⊥− .
�−⊥+ .
�
�⊥(2)
After the regression, the first principal component keeps his 31% explanation power, with 3 components with an eigenvalue above 1. In terms of the variables signs, there are no changes of estimated signs in the variables component. To summarise, the orthogonalised index (2) still retains his appealing properties from the Sentiment index (1).
Furthermore the table below is built to illustrate the comparison of signs of the different sentiment proxies used by Baker and Wurgler (2006) to compose the sentiment index for the U.S. market and the proxies used in this study for the Swiss market. The signs are almost all in line with the U.S. proxies only Turnover has a different sign compared to the previsions. Turnover is obtained dividing the total value of shares traded during the period by the average market capitalisation for the same period. Differences in one of these two Turnover components could have influenced this difference. The total value of shares is normally higher for the U.S. market compared to the Swiss market because of its size and, as explained before, for the average market capitalisation, the Swiss market is one of the best performing markets. This disproportion in the values could have caused this sign variation in Turnover. Finally, the sign difference in one proxy due to different financial characteristics will not have an enormous impact in the final analysis of the study.
Moreover, table 2 summarises all raw sentiment proxies and the orthogonalised proxies. Correlations of the sentiment components and within the Sentiment indices (1) and the orthogonalised indices (2) are also reproduced. The correlations among the orthogonalised proxies tend to be very slightly higher than the raw proxies. Furthermore, a recognisable fact is that the macro to orthogonalised variables does not affect qualitatively any component of the index or the overall index. As a conclusion, if the raw variables were driven by macroeconomic conditions and not by investor sentiment, the results should have shown opposite values. In the main analysis, both of the indexes are presented in order to demonstrate robustness.
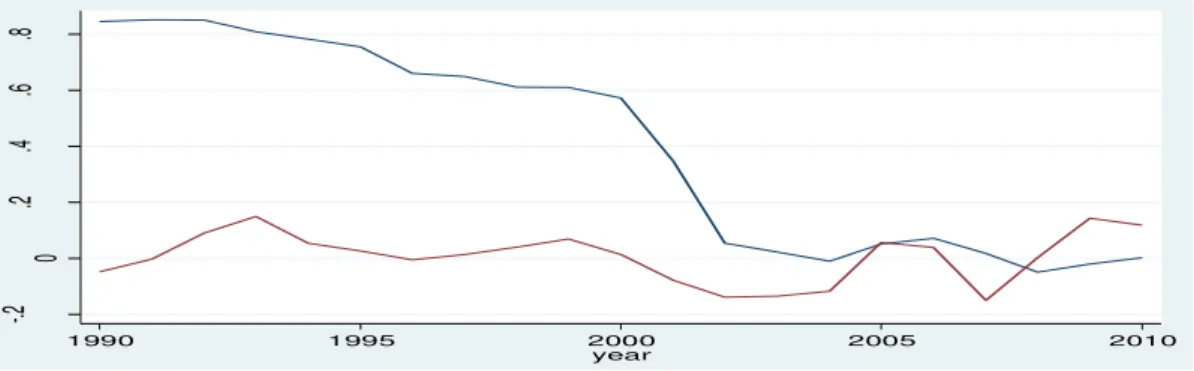
Finally, figure 1 plots the raw proxies and the residuals obtained from the regressions using the macroeconomic variables. The plots are interesting because they help to recognise the sentiment fluctuations in the chosen time frame. Some proxies point to higher sentiment fluctuations during the Internet bubble, also known as the dot-com crash (1999-2000) that affected the financial markets worldwide. Specifically, the closed-end fund discount and the dividend premium are high, evidences also observed by Baker and Wurgler (2006). It is also observable that after 2005 the sentiment values have a small trend to drop to a lower level. And finally as expected the 2009 worldwide financial crisis also drops the sentiment level to negative values as it did for most of the financial markets. The overall � ⊥ has positive values during the most part of the chosen time frame.
Table 2
Investor sentiment data, 1990 – 2010
In this table means, standard deviations and correlations of investor sentiment measures are summarised. Panel A stands for the different raw sentiment proxies. Closed-end mutual funds (CEFD) are defined as the year-end, value weighted average discount on closed-end mutual funds, it is calculated as net asset values (NAV) minus market price divided by NAV times 100. The data is obtained from Datastream. The next measure, TURN, is measured as the natural log of turnover. Turnover is calculated as the ratio of total value of shares traded during the period divided by the average market capitalisation for the period. Average market capitalisation is obtained as the average of the end-of-period values for the current period and the previous period. NIPO is the annual number of initial public offerings obtained from SDC. RIPO, the average first day returns of initial public offerings is obtained from the difference between the first trading price and the offer price divided by the offer price. ES is obtained from the proportion of aggregate equity issuance divided by the aggregate equity plus debt issuance obtained from Datastream. PD-ND is measured as the year-end log ration of the value-weighted average market-to-book rations of payers and non-payers. TURN, RIPO and PD-ND are lagged one year relative to the other measures. SENTIMENT is the first principal component of the six sentiment proxies. In panel B, the eight proxies are regressed on CPI, IPI, GDP and the Central Bank’s main policy rate. The orthogonalised proxies are labelled with a “⊥ “. SENTIMENT⊥ is the first principal component of the eight orthogonalised proxies.
Figure 1. Investor sentiment in Switzerland, 1990-2010.
Panel A, stands for the year-end, value-weighted average discount on closed-end mutual funds. The data on market prices and NAVs are obtained from DataStream. Panel B presents the log turnover. Turnover is calculated as the ratio of total value of shares traded during the period divided by the average market capitalisation for the period. Panel C plots NIPO, the annual number of initial public offerings obtained from SDC. Panel D shows the average first day returns of initial public offerings (RIPO), obtained from the difference between the first trading price and the offer price divided by the offer price Panel E presents ES, calculated from the proportion of aggregate equity issuance divided by the aggregate equity plus debt issuance obtained from Datastream. Panel F presents the year-end log ration of the value-weighted average market-to-book rations of payers and non-payers P D-ND. The blue line (left axis) represents the raw data. All sentiment measures are regressed on the CPI, IPI, GDP and the Central Bank’s main policy rate. The red line (right axis) presents the residuals obtained from the regression. The blue line in the last panel stands for the first principal component of the six sentiment raw proxies and the red line presents the first principal component of the six orthogonalised proxies.
Panel A: Closed-End Fund Discount
Panel B: Turnover
Panel D: Average first-day return of IPOs
-.2 0 .2 .4 .6 .8 1990 1995 2000 2005 2010 year -2 0 2 4 6 1990 1995 2000 2005 2010 year 0 5 10 15 1990 1995 2000 2005 2010 year
Panel C: Number of IPOs
Panel E: Equity share in new issues
Panel F: Dividend Premium
Panel G: Sentiment Index
0 1 2 3 1990 1995 2000 2005 2010 year 0 .2 .4 .6 .8 1990 1995 2000 2005 2010 year -.4 -.2 0 .2 .4 .6 1990 1995 2000 2005 2010 year -5 0 5 10 1990 1995 2000 2005 2010 year
5. Empirical results
5.1 Sorting
In accordance to behavioural finance literature, there are various other characteristics of stocks allowing differentiating between non-sentiment and sentiment sensitive stocks. Using a sorting criterion, various portfolios of non-sentiment and non-sentiment sensitive stocks could be constructed.
Table 3 exhibits 10 equally-weighted portfolios for the following characteristics: firm size (ME), total risk (Tot_Risk), earnings-to-book ratio (E/BE), dividend-to-book ratio (D/BE), asset tangibility (PPE/A), R&D over assets (RD/A), book-to-market ratio (BE/ME), external finance over assets (EF/A) and sales growth (GS). Monthly return variables are grouped into decile ranks corresponding to the different characteristics and also according to the level of SENTIMENT⊥ at the end of the previous year. Decile 1 represents the smallest values of each characteristic, whereas decile 10 stands for the largest ones. The equally weighted average monthly returns are calculated for each section. Additionally, the portfolios are all single portfolios, grouped into a positive and negative sentiment group. The difference between the positive and negative sentiment groups is calculated in order to look for patterns.
The ME panel shows the size effect conditional on sentiment. The Swiss results reveal for low sentiment periods the presence of a size effect of Banz (1981), which tells us that smaller firms have higher risk adjusted returns compared with larger firms. Respectively, for a negative sentiment period, the average return is 0.58 for decile 1 and 0.38 for decile 10. For a positive sentiment period, the average return for decile 1 is 0.46 and 1.43 for decile 10. Analysing the existing difference between the positive and negative sentiment, the results again in line with Baker and Wurgler’s (2006), show that small stocks are more affected by sentiment, in a negative sentiment-return relation.
The Tot_Risk panel proves that the cross-sectional effect of return volatility is conditional on sentiment. Notably, riskier stocks tend to have higher returns, confirmed by the initial and last deciles. On the other hand, when sentiment is high,
riskier stocks earn lower returns. A plausible explanation is that due to the higher volatility level of these stocks, they are harder to value and to arbitrage making them sensible to sentiment fluctuations, a characteristic comparable with young stocks. In our sample when sentiment is low almost all returns are positive.
In the next rows, E/BE and D/BE present profitability and dividends. In this context it is interesting to compare profitable and unprofitable firms as also payers and nonpayers. The values for the unprofitable and non-paying firms are under column ≤0. For positive sentiment levels, returns tend to be higher for profitable firms compared with unprofitable ones. Additionally, non-paying firms have lower returns in both sentiment periods compared with paying firms. In conclusion, returns tend to be higher for profitable and dividend paying firms compared with unprofitable and non-dividend paying firms. The results are principally consistent with Baker and Wurgler’s findings during high sentiment periods. The findings also demonstrate that unprofitable and non-paying firms are more exposed to sentiment fluctuations as they are considered harder to value and arbitrage.
In the next two rows, PPE/A and RD/A represent the tangibility panel. Under the notion that firms with a lower tangible assets level are harder to evaluate because of their intangible assets, so that they become more sensitive to sentiment fluctuations. Decile 10 shows how during a high sentiment level the returns were higher as for the same decile for the lower sentiment level, proving that bigger firms with higher tangible assets are not so highly affected by sentiment fluctuations. In conclusion, the results are in line with Baker and Wurgler’s (2006) findings for high sentiment levels. The RD/A represents a more moderate unconditional effect showing that higher RD/A firms normally earn higher returns.
The last variables, book-to-market, external finance and sales growth show captivating patterns, explained by some explanatory power of those. Following Baker and Wurgler’s (2006) theory, future returns should normally be higher for high BE/ME stocks, low EF/A stocks and low GS stocks. Unfortunately for the Swiss stocks this is not the case. A high BE/ME means that the stock is undervalued and future returns should represent higher values, which is not the case for the Swiss market. The ratio of the BE/ME itself is a risk measure, and therefore the larger returns generated by low BE/ME stocks could simply be a compensation for risk. For
the EF/A stocks as we know Swiss firms have access to inexpensive capital and this could influence that future returns of external financed firms have not necessarily to be higher for this type of firms. As we know GS stocks promise higher earnings but also a higher chance of bankruptcy, the different market characteristic of well-regulated Swiss market could have influenced this results.
Finally, the table below illustrates the previous explanations and demonstrates the differences between the U.S. results obtained by Baker and Wurgler (2006) and the results for the Swiss market. There are 3 different results, which are certainly due to the different firm characteristics presented in the two countries. Swiss firms have benefit during the selected time frame for this study from a favourable tax regime, government financial aids in form of grants and access to inexpensive banc loans. The rest of the results tend to be in line with behavioural finance theory, that for beginning-of-period of low sentiment levels, future returns are high for small stocks, high volatility stocks, non-profitable stocks and value stocks.
Table 3
Future Returns by Sentiment Index and Firm Characteristics, 1990-2010
The table groups the average monthly returns of portfolios sorted by the different firm characteristics and the sentiment index. For each month, 10 equally weighted portfolios are composed according to the different firm characteristics such as firm size (ME), total risk (TOT_RISK), earnings-to-book ratio (E/BE), dividend-to-book ratio (D/BE), asset tangibility (PPE/A), book-to-market ratio (BE/ME) and external finance over assets (EF/A). Decile 1 stands for the smallest, whereas decile 10 represents the largest values of each characteristic. Additionally, each decile portfolio is grouped into a positive sentiment and a negative sentiment group at the end of the previous year according the level of SENTIMENT⊥. Furthermore, portfolios returns for unprofitable, non-paying, zero-PP&E and zero-R&D firms are also calculated. Average returns and the difference of the average returns between the groups in the same portfolio are then calculated.
Figure 2.
Sorting approach: Future returns by sentiment index and firm characteristics, Switzerland 1990-2010.
10 equally weighted portfolios are composed according to the different firm characteristics such as firm size (ME), total risk (TOT_RISK), earnings-to-book ratio (E/BE), dividend-to-book ratio (D/BE), asset tangibility (PPE/A), book-to-market ratio (BE/ME) and external finance over assets (EF/A). Returns during positive SENTIMENT⊥ periods are presented as blue bars and the negative SENTIMENT ⊥ periods by the thin red bars. The orange line is the average between both periods and the green line is the difference. Panel A: ME Panel B: Tot_Risk Panel C: E/BE -4 -2 0 2 4 0 2 4 6 8 10 10 quantiles of ME -2 0 2 4 0 2 4 6 8 10 10 quantiles of TOT_RISK -2 0 2 4 0 2 4 6 8 10 10 quantiles of E_BE_mean
Panel D: D/BE Panel E: PPE/A Panel F: BE/ME Panel G: EF/A -4 -2 0 2 4 0 2 4 6 8 10 10 quantiles of D_BE_mean -2 0 2 4 6 0 2 4 6 8 10 10 quantiles of PPE_A -4 -2 0 2 4 6 0 2 4 6 8 10 10 quantiles of BE_ME -4 -2 0 2 4 0 2 4 6 8 10 10 quantiles of EF_A
5.2 Long-Short Portfolios Regressions
A second method for analysing conditional characteristics effects is to forecast the equally weighted portfolios using sentiment. The portfolios used are long on stocks with high characteristics values particularly for the three top deciles and short for stocks with low values, i.e., portfolios presented in the three bottom deciles. Additionally, medium is defined as the four middle deciles. To avoid that a simple “high-minus-low” analysis of the variables could omit important cross-sectional aspects, the growth and distress variables are also divided into “high-minus-medium” and “medium-minus-low” portfolios. The regression approach used helps to conclude which of the different characteristics have conditional effects that are different from unconditional effects, incorporate the sentiment indexes’ continuous nature and finally conduct formal significance tests.
Table 4 plots the different correlations between the characteristics-based long- short portfolios, for a samples period that includes average monthly returns. Analysing the correlations, the BE/ME variables are -0.52 highly negatively correlated, suggesting that high and low BE/ME firms move together relative to middle BE/ME firms. An example that indicates precisely how a simple “high-minus-low” analysis would omit important cross-sectional aspects is the EF/A variable that is -0.10 negatively correlated for “high-minus-medium” and “medium-minus-low”.
To study if sentiment can predict the different long-short portfolios represented in Table 4, the following regression was conducted:
RXit=High,t − RXit=Low,t = c + dSENTIMENTt−1 + uit
The dependent variable (RXit=High,t − RXit=Low,t) represents the long-short portfolio monthly returns, such as the size effect portfolio (SMB), monthly returns are regressed on the sentiment index, lagged one year (dSENTIMENTt−1).
Furthermore, using a multivariate regression, predictability effects from well-known co-movement were differentiated.
3
RXit=High,t − RXit=Low,t = c + dSENTIMENTt−1 + βRMKTt + sSMBt + hHMLt
+ mUMDt + uit
Applying the Fama and French (1993) definitions, RMRF is the excess return of the value-weighted market over the risk-free rate. The RMRF factor helps controlling correlations between returns in each portfolio of individual stocks and the market portfolio returns. The SMB represents the returns of small and big ME stocks in the portfolios. HML has the objective of isolating the existing difference between high and low BE/ME portfolios. Finally, the UMD variable represents the returns on high-momentum stocks minus the returns for low-momentum stocks and it is measured as the cumulative return for the 11-month period between 12 and 2 months prior to the given month. The Fama and French factors (Appendix 4) are in a monthly basis for our sample period.
Table 5 shows the results obtained from the regressions of the portfolio returns. Analysing the first panel, it is demonstrated that during high sentiment periods, next year’s returns on small and high volatility stocks are relatively low. Consistent with Baker and Wurgler’s (2006) results, the sentiment coefficients values are not affected after controlling for RMRF, SMB, HML and UMD. A further conclusion is that the significance of the predictive effect is not dependent on including the RMRF, SMB, HML and UMD factors. Also, the SMB coefficient demonstrates that a one-unit increase in sentiment results in a lower return of -0,13% for the SMB portfolio.
Furthermore, the results obtained for SENTIMENT and SENTIMENT⊥ have similar values, which means that macroeconomic conditions have a low impact in our sample. This conclusion is in line with Baker and Wurgler’s (2006) analysis and also the expected results for the Swiss market, taking in consideration the countries financial stability. The four macroeconomic variables used for removing the business cycle effects for the SENTIMENT⊥ index represent stable and strong economic values for the Swiss stability. Switzerland’s unemployment rate is lower than the levels in Europe and in the U.S. A public debt of 41% of its own GDP, high reserves
in foreign currencies and gold, a low inflation rate and government budget surplus of almost a decade are only some facts of its financial stability (Appendix 2).
For the profitability and dividend payment, regressions are done so that the differences between the profitable and dividend paying portfolios and unprofitable portfolios and non-paying firms are respectively forecasted. The reason is that the sorting approach demonstrates that the regressions are likely to capture the main contrasts. Taking a deeper look at the profitability portfolio, higher sentiment can forecast higher returns for dividend paying firms (+1,39) and also for profitable firms (+0,57), which underlines the predictive power of the sentiment analysis. Again, the patterns are slightly affected after controlling for RMRF, SMB, HML and UMD.
The next panel summarises tangibility characteristics. For the PPE/A portfolio, sentiment presents marginal predictive power. In other words, during high sentiment periods we have to expect low future returns on PPE/A stocks. Controlling for the coefficients, the RD/A portfolio stays consistent with previous values.
Furthermore, the three last panels are affected by the macroeconomic factors because of slight accentuated values after controlling for these factors. This becomes easily observable for the “high-minus-low” and “high-minus-medium” portfolios, giving the impression that bigger stocks returns are more affected by macroeconomic decisions. Again, the fluctuations in the returns are small, which is very plausible for a financial macroeconomic stable country.
To summarise, the regressions are able to confirm the significance of the patterns predicted in the sorting approach. For high sentiment periods, future returns tend to be low for small firms, unprofitable firms, high growth and distressed firms. And vice versa. In general, hard to value and hard to arbitrage stocks are more affected by sentiment.
Table 4
Correlations of Portfolio Returns, 1990-2010
The table presents correlations among characteristics-based portfolios. Based on firms characteristics, long-short portfolios are formed: firm size (ME), total risk (TOT_RISK), earnings-to-book ratio (E/BE), dividend-to-book ratio (D/BE), asset tangibility (PPE/A), book-to-market ratio (BE/ME) and external finance over assets (EF/A). High represents firms stock in the top three deciles, low a firm in the bottom three deciles and finally medium describes a firms stock in the middle four deciles.
Table 5
Time Series Regressions of Portfolio Returns
The table presents regression of long-short portfolio monthly returns on lagged SENTIMENT index, the market risk premium (RMRF), the Fama and French factors (HML and SMB) and a momentum factor (UMD).
RXit=High,t − RXit=Low,t = c + dSENTIMENTt−1 + βRMRFt + sSMBt + hHMLt + mUMDt + ut
The long-short portfolios are sorted based on the following firm characteristics: firm size (ME), total risk (Tot_Risk), profitability (E), dividends (D), asset tangibility (PPE/A), book-to-market ratio (BE/ME) and external finance over assets (EF/A). High is defined for firms returns in the top three deciles, Low is defined for returns in the bottom three deciles and finally Medium is defined as the four middle deciles. Before controlling for macroeconomic conditions, average monthly portfolios returns are matched to the lagged SENTIMENT index from the previous year-end. SENTIMENT⊥ is composed by the six sentiment proxies that have been orthogonalised to Consumer Price Index (CPI), the Industrial Production Index (IPI), Gross Domestic Product (GDP) and to the Policy Interest Rate (PIR). The first and third set of columns presents regression results and the second and forth columns include RMRF, SMB, HML and UMD as control variables. P-values are in brackets and all statistically significant.
5.3 Systematic Risk
It is recognisable that the conditional characteristics effects seem to be a compensation for systematic risk. Also, the SENTIMENT⊥ index is orthogonalised to macroeconomic conditions, so that predictions where sentiment matters most and the patterns line up with bubbles and crashes. For our sample, during the period between 2005 and 2008, sentiment was high because of a disproportionate monetary policy (constant weakening of the Swiss franc) and also for 2009 during the global crisis. Supposedly, the systematic risk theory says that older, profitable, less volatile and dividend-paying firms should have higher returns compared to younger, unprofitable, more volatile and non-paying firms. As we know, in modern finance this theory becomes unreasonable, so that this study tries to explain it more precisely for our sample.
There are two types of systematic risk explanations. The first type tells us that systematic risk of stocks will vary in considerations of their characteristics and the used sentiment proxies, even if they are isolated from macroeconomic conditions. Table 6 analyses periods where sentiment coincides with time-variations in market betas, so that the earlier results are reconciled with a conditional CAPM. Returns are predicted on the characteristics portfolios.
RXit=High, t − RXit=Low, t = c + dSENTIMENTt−1 + β (e + fSENTIMENTt−1)RMRFt
+uit
Analysing the time-varying betas, the composite coefficient βf has sign differences in the returns compared to the estimates of d in Table 5, not in line with the first systematic risk explanation. The values are more diminished and this becomes more accentuated when analysing for the macroeconomic factors. Specifically, for the profitability and dividend policy panel that is more affected.
The second systematic risk explanation is that stocks’ betas are fixed, even though risk premium varies with sentiment. The result of this explanation is that high and low beta stocks vary in proportion with the differences in returns. Analysing this
second systematic risk theory, it is not reflected by the results because of the variation not only in the weight of the returns but also in the signs of the different characteristics. A high percentage of the results do not reflect a compensation for classical systematic risks. The results are in line with those obtained for the Baker and Wurgler’s (2006) systematic risk analysis.
Table 6
Conditional Market Betas
Table 6 present regressions of long-short portfolio returns on the market risk premium (RMRF) and the market risk premium interacted with SENTIMENT.
RXit=High,t − RXit=Low,t = c + dSENTIMENTt−1 + β(e + fSENTIMENTt−1)RMRFt + ut
The long-short portfolios are sorted based on the following firm characteristics: firm size (ME), total risk (Tot_Risk), profitability (E), dividends (D), asset tangibility (PPE/A), book-to-market ratio (BE/ME) and external finance over assets (EF/A). High is defined for firms returns in the top three deciles, Low is defined for returns in the bottom three deciles and finally Medium is defined as the four middle deciles. Before controlling for macroeconomic conditions, average monthly portfolios returns are matched to the lagged SENTIMENT index from the previous year-end. SENTIMENT⊥ is composed by the six sentiment proxies that have been orthogonalised to Consumer Price Index (CPI), the Industrial Production Index (IPI), Gross Domestic Product (GDP) and to the Policy Interest Rate (PIR). The first and third set of columns presents regression results and the second and forth columns include RMRF, SMB, HML and UMD as control variables. P-values are in brackets and all statistically significant.
6. Conclusions
The results obtained indicate that the U.S. results of Baker and Wurgler (2006) extend to the Swiss context and are directionally consistent with theoretical predictions. The sentiment index obtained from the Swiss proxies and the sentiment effects on the different firm characteristics are almost in line with the U.S. results. Traditional finance theories assume rational investors and market efficiency. In classical finance, investor sentiment has no cross-sectional effect on stock returns. This research uses theoretical arguments, an investor sentiment index and also empirical analysis to prove that investor sentiment does have a cross-sectional effect on stocks returns. Implementing Baker and Wurgler’s (2006) measures and sentiment proxies used for the United States, the same sentiment investigation is done for the Swiss market to provide evidences that sentiment has almost equal effects on both of these strong financial markets. In line with Baker and Wurgler’s (2006) findings, this study rejects the standard finance theories arguing that investor sentiment has predictive power in the cross-section of stock returns.
The principal findings found after a sorting approach conclude that for beginning-of-period proxies where sentiment is high, future returns tend to be lower for small stocks, high volatility stocks, unprofitable stocks and value stocks. Moreover, the significance of the patterns presented in the sorting approach was confirmed conducting a regression approach. Principally, during high sentiment periods, subsequent returns are comparably low for small firms, unprofitable firms, high growth and distressed firms. And vice versa. The predictions telling that sentiment has stronger effects on hard to value and difficult to arbitrage stocks are broadly confirmed by the results. Furthermore, the classical finance theory concerning systematic risks says that results reflect systematic risk compensations. However, some aspects are not consistent with the classical finance explanation because they do not reflect systematic risk compensation.
Further researches could bring different results if studied for different types of markets. The cross-sectional predictive power of sentiment could be more accentuated if studied for a country with a higher fraction of retail investors or an emerging market (more prone to sentiment fluctuations).
Appendix 1: Swiss equity market
For most of these periods, the magnitude of the outperformance is significant. Furthermore, the Swiss market has exhibited more attractive risk characteristics, including lower volatility, than comparable markets.
Comparison Period: 20 years. We have arbitrarily chosen 20 years as the outer limit of what one might call the modern era. Going backwards beyond 20 years may place us outside the relevant and expected financial, geo-political, socio-political, regulatory and economic framework limiting the use of the comparison.
Indices: SPI (Switzerland - red), SPXT (U.S. - green), FTPTT350 (UK - orange), CDAX (France - blue), TPXDDVD (Japan – Grey). Our 20 year comparison did not include the other indices outlined previously as their data does not extend back to that date.
Currency: CHF. While the graph below illustrates the SPI’s outperformance in CHF, the Index also outperforms in USD and GBP…and yes even in the local currency. The EUR did not exist 20 years ago.
SPI 20 Year Performance (red) Compared to Major Developed Indices in CHF