Escola de Engenharia
Tiago Costa Oliveira
Improving Web Authentication
with Keystroke Dynamics
Dissertação de Mestrado
Escola de Engenharia
Departamento de Informática
Tiago Costa Oliveira
Improving Web Authentication
with Keystroke Dynamics
Mestrado em Engenharia Informática
Trabalho realizado sob orientação de
Professor Doutor Henrique Manuel Dinis Santos
Nome
Tiago Costa Oliveira
Endereço electrónico [email protected] Telefone 966865492 Bilhete de Identidade 13246998 Título da Tese
Improving Web Authentication with Keystroke Dynamics
Orientador
Professor Doutor Henrique Manuel Dinis Santos
Ano de conclusão
2014
Designação do Mestrado
Mestrado em Engenharia Informática
É AUTORIZADA A REPRODUÇÃO INTEGRAL DESTA TESE APE-NAS PARA EFEITOS DE INVESTIGAÇÃO, MEDIANTE DECLARAÇÃO ESCRITA DO INTERESSADO, QUE A TAL SE COMPROMETE.
Universidade do Minho, 31 de Outubro de 2014 Tiago Costa Oliveira
O processo de autenticação é frequentemente referido como a parte mais importante da segurança de um sistema informático. Normalmente, os uti-lizadores identificam-se utilizando nome de utilizador e palavra-passe, mas este mecanismo nem sempre é suficiente. Considerando serviços baseados na
web, ataques como phishing ou engenharia social podem facilmente levar ao
roubo de identidade. Para além disso, a utilização crescente de serviços de
single sign-on apresenta novos riscos e consequências deste tipo de ataques.
Nestas circunstâncias a autenticação forte é fundamental.
A autenticação forte é tipicamente implementada por meio de passos adi-cionais de autenticação ou módulos de hardware especializado, o que não é adequado a sistemas baseados na web. No entanto, biometrias podem ser usadas para ultrapassar estas limitações. Mais especificamente, biometrias comportamentais baseadas em padrões de digitação no teclado podem for-necer um nível de segurança adicional, sem custo acrescido ou impacto na experiência de utilização.
Este trabalho tem como objetivo avaliar a viabilidade da implementação de autenticação forte na web usando dinâmica de digitação. Isto é conseguido através da implementação de um protótipo sob a forma de uma aplicação
web, captura de dados de digitação e análise de vários algoritmos e métricas
de desempenho sobre os dados recolhidos.
Authentication is frequently referred as the most critical part of a computer system security. Users commonly identify themselves using a combination of username and password, but sometimes this is not enough. Concerning web-based services, attacks like phishing or social engineering can easily result in identity theft. In addition, the widespread use of single sign-on services can seriously increase the consequences of such attacks. In these circumstances strong authentication is mandatory.
Strong authentication is often implemented using additional authentication steps or specialised hardware modules, which is not suitable for web-based systems. However, biometrics can used to overcome these limitations. More specifically, behavioural biometrics based on keyboard typing patterns can provide an extra security layer on top of conventional authentication methods, with no additional cost and no impact to the user experience.
This work aims to evaluate the feasibility of the implementation of strong authentication on the web using keystroke dynamics. This is carried out through the creation of a web application prototype, collection of a keystroke dynamics dataset and analysis of various matching algorithms and performance metrics on the collected data.
I would like to express my sincere gratitude to Professor Henrique Santos, for being my advisor and supporting me with great guidance and insight through the course of this work. Also, a word of acknowledgement to the test subjects that provided valuable and meaningful data to the keystroke dynamics dataset; without their patience and diligent cooperation this work would have never been done. Finally, I’m grateful to my family and Joana, for all the love and support, and for not letting me give up on my master’s degree.
Contents
List of Figures viii
List of Tables ix List of Acronyms x 1 Introduction 1 1.1 Motivation . . . 1 1.2 Goals . . . 2 1.3 Research Methodology . . . 3 1.4 Document Structure . . . 3 2 Literature Review 4 2.1 Strong Authentication on the Web . . . 4
2.2 Biometrics . . . 6
2.2.1 Physiological Biometrics . . . 7
2.2.2 Behavioural Biometrics . . . 8
2.3 Components of a Biometric System . . . 8
2.4 Deployment on the Web . . . 10
2.4.1 Server Deployment . . . 10 2.4.2 Client Deployment . . . 11 2.4.3 Hybrid Deployment . . . 11 2.5 Performance Metrics . . . 11 2.6 Keystroke Dynamics . . . 13 2.6.1 Historical Context . . . 13 v
2.6.2 Extracted Features . . . 14
2.6.3 Previous Studies and Results . . . 16
3 Experimental Design 17 3.1 System Architecture . . . 18
3.2 Implementation . . . 19
3.3 Application and User Interaction . . . 21
3.3.1 Registration . . . 21 3.3.2 Login . . . 23 3.3.3 Attack . . . 24 4 Experimental Results 27 4.1 Collected Data . . . 27 4.2 Matching Algorithms . . . 27 4.3 Performance Analysis . . . 29
4.3.1 Score Distributions and Error Rates . . . 30
4.3.2 Comparison of Matching Algorithms . . . 33
4.4 Template Updating . . . 34
4.5 Feature Vector Size . . . 34
4.6 Discussion of Results . . . 35
5 Conclusions and Future Work 37
A JavaScript Timestamp Resolution 39
B Comparison of Matching Algorithms 40
C Source Code 42
List of Figures
2.1 Knowledge-based authentication . . . 5
2.2 Server-generated one-time password . . . 5
2.3 Client-generated one-time password . . . 6
2.4 Out-of-band authentication . . . 6
2.5 Components and operation of a biometric system . . . 10
2.6 Score distributions in a biometric system . . . 12
2.7 Error rates and ROC curve of a biometric system . . . 13
2.8 Relevant features in keystroke dynamics . . . 15
2.9 Genuine and impostor input compared to the biometric template 15 3.1 Strong authentication with keystroke dynamics . . . 18
3.2 Web application: Home page . . . 21
3.3 Web application: Registration . . . 22
3.4 Web application: Enrolment . . . 22
3.5 Web application: Login (user authentication) . . . 23
3.6 Web application: Login (matching score) . . . 24
3.7 Web application: Attack (attacker identification) . . . 25
3.8 Web application: Attack (enter victim’s credentials) . . . 25
3.9 Web application: Attack (matching score) . . . 26
4.1 EER calculation at existing and estimated points . . . 30
4.2 Euclidean matcher: score distributions and error rates . . . 31
4.3 Manhattan matcher: score distributions and error rates . . . . 31 4.4 Euclidean Scaled matcher: score distributions and error rates . 32
4.5 Manhattan Scaled matcher: score distributions and error rates 32 4.6 Comparison of matching algorithms: ROC and DET curves . . 33 4.7 Frequency of feature vector sizes in the captured data . . . 35
List of Tables
2.1 Previous work on keystroke dynamics . . . 16 3.1 Feature vector calculation based on keystroke timestamps . . . 20 4.1 Comparison of matching algorithms: EER . . . 33 4.2 Comparison of EER, with and without template updating . . 34 4.3 Comparison of EER with different feature vector sizes . . . 35
KBA Knowledge-based Authentication OTP One-time Password
OOB Out-of-band Authentication HCI Human-Computer Interaction FAR False Accept Rate
FRR False Reject Rate TAR True Accept Rate EER Equal Error Rate
ROC Receiver Operating Characteristic DET Detection Error Trade-off
CER Crossover Error Rate
1
Introduction
1.1
Motivation
User authentication has always been a fundamental component of access control. Nowadays, the Internet is the standard platform for communication and a tremendous amount of sensitive data is transmitted between computer systems. This makes the process of identity verification more important than ever. However, basic username and password combination is used the same way we did a decade ago.
Attacks like man-in-the-middle, phishing or social engineering can easily result in identity theft [1]. This can lead to access to private information, exploitation of trust relationships and other criminal activities. Furthermore, with the widespread use of single sign-on services, where a single set of credentials can authenticate users in multiple websites, consequences of identity theft can be devastating [62]. Even though in most cases simple password-based authentication will suffice, other environments like online commerce and banking platforms can definitely benefit from strong authentication to ensure proper protection of sensitive, private and confidential data.
Strong authentication doesn’t have a standard definition, but it generally aims to deliver increased security beyond standard authentication methods. It is often implemented with two-factor authentication and usually based
in knowledge or token-based approaches [14]. Although these methods can effectively improve security in authentication, what is really validated are passwords, tokens and keys. Also, user credentials can be stolen, lost, shared or manipulated, resulting in compromised security [46, 26].
Biometrics can be used to overcome the limitations imposed by classical solutions by allowing identity verification based on the user himself. Unfor-tunately, authentication solutions based on biometrics may not always be easily deployed, since most of them require specific hardware (e.g. fingerprint reader).
Keystroke dynamics, a behavioural biometric, presents itself as a viable con-tender to implement strong authentication on the web. It has the distinct advantage of not requiring specific hardware, while maintaining the desir-able properties of mainstream biometric solutions. Also, as we will explore in this work, it can be seamlessly integrated with existing password-based authentication.
1.2
Goals
This work aims to evaluate the viability of keystroke dynamics as a method for implementing strong authentication on a web-based environment. It should result in an implementation capable of enrolment and identity verification, applying typing behaviour on top of basic username and password credentials. Another goal of this study is to compare the performance of some classical matching algorithms proposed by previous research. Although numerous experiments have achieved encouraging results, there is significant variation in the reported effectiveness, which makes it hard to assess the full potential of keystroke dynamics as a biometric for authentication. We’ll also look at how the number of characters and the application of adaptive techniques can influence the performance of keystroke dynamics.
Finally, most studies on keystroke dynamics tend to use a single pass-phrase for all users; this work’s experiment should account for individual authentication credentials for every user, which is arguably a better representation of the real world.
1.3
Research Methodology
The purpose of this work is to present a solution to the problem of im-plementing strong authentication on the web, involving the specification, implementation and performance analysis of a biometric system based on keystroke dynamics.
A Design Science research methodology will be followed. We start by defining the system requirements and functionality; specifying the general architecture, design, and technical decisions. Then, a concrete implementation will be made available to gather biometric data. Finally, using the collected data, the system will be assessed in terms of performance and effectiveness as stated by initial requirements, using known metrics and algorithms.
1.4
Document Structure
The remaining chapters of this document are organised as follows:
Chapter 2 presents the literature review, giving an overview of biometrics,
architecture and deployment on the web, evaluation metrics and previous research on keystroke dynamics.
Chapter 3 outlines the experimental design, describing the architecture and
technologies used in the solution, collection of biometric data and extraction of biometric features.
Chapter 4 covers the experimental results, outlining performance
measure-ments and comparison of some matching algorithms.
Chapter 5 draws some general conclusions about this work and presents
considerations on further research on keystroke dynamics as a method for authentication within web applications.
2
Literature Review
2.1
Strong Authentication on the Web
Strong authentication, while not being a strictly defined procedure, is gener-ally accepted as a process of authentication which provides validation beyond conventional methods. Regardless of it’s fuzzy definition, strong authentica-tion is even an official recommendaauthentica-tion regarding payments on the Internet [7]. Typical implementations are based on some form of multi-factor authentica-tion, carried out with a compound implementation of two or more classes of human authentication factors [46, 44, 14, 38]:
Knowledge based. Something only known to the user and the target machine, like a password, shared secret or PIN.
Possession based. Something held by the user, like a security token, smart
card or mobile device.
Biometric based. Something inherent to the user himself, a biological or
behavioural trait like facial features, fingerprint or keyboard typing rhythm. When implementing strong authentication on the web, there are some dis-tinctive factors that must be taken into account. Most notably, the entire process is frequently performed from a remote location, using a web browser with limited access to the user’s environment and hardware. Currently, some
common protocols are used to carry out this implementation [37, 14, 24]:
Knowledge-based Authentication (KBA). Typically implemented with
some additional challenge-response requests, allowing the user to prove the claimed identity based on user-specific keys. Some online banking systems use this method to validate transactions. The interaction between user, browser and server is illustrated in figure 2.1.
Browser Server 1 2 1 2 3 3
Figure 2.1: Knowledge-based authentication
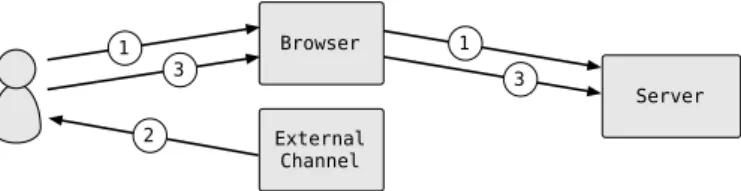
Server-generated One-time Password (OTP). As depicted in figure 2.2,
after the usual password-based authentication, a randomised key is generated on the server and delivered to the user via SMS or another channel other than the web browser. The user then sends the key back to the server. This method is also frequently used in online banking, usually in the form of an SMS token. Browser Server External Channel 3 1 1 3 2 2
Figure 2.2: Server-generated one-time password
Client-generated OTP. Similar to server-generated OTP, the only
differ-ence being that the OTP is completely generated on the client side, as shown in figure 2.3. For instance, mobile devices can incorporate individualised cryptographic software to generate time-based or event-based keys.
Browser Server External Channel 3 1 1 3 2
Figure 2.3: Client-generated one-time password
Out-of-band Authentication (OOB). As presented in figure 2.4, the
second authentication factor is verified completely out of the domain of the first (the web browser). Typical implementations include speech recognition via voice calls or KBA via SMS on the external channel.
Browser Server External Channel 1 1 2 2
Figure 2.4: Out-of-band authentication
As shown, current approaches mainly rely on knowledge or token-based solutions, leaving the domain of biometrics under-explored as a method to implement strong authentication in distributed and web-based environments.
2.2
Biometrics
A biometric system is no more than a pattern recognition system that identifies a user based on his own characteristics. Users are mostly recognised by what they are rather than what they know or possess. Any trait can be used as a biometric, as long as it satisfies some requirements [16, 26, 53, 61]:
Universality. Every individual should possess the trait. The lack of
univer-sality may render a biometric modality not useful for a particular part of the population.
Distinctiveness. The given characteristic should be sufficiently different
Stability. The biometric trait should present little variation over a given
period of time with respect to the matching algorithm.
Collectability. It should be possible to collect the biometric data. Also, collected measurements should be computationally tractable in terms of processing and feature extraction.
Performance. The accuracy, speed or resource restrictions imposed by the
application should be met.
Acceptability. Users that will use the application should be willing to
present their biometric trait to the system. Ideally, biometric techniques should be non-intrusive and require minimum user intervention in order to achieve good acceptability [57].
Circumvention. The given trait should be robust enough against spoofing
and other fraudulent methods.
However, no biometric system is expected to be perfect and no requirement is completely mandatory. Depending on the underlying biometric trait and the specific implementation, some of these features will be more strictly met than others. Also, the relevance of the requirements may vary depending on the application [26]. For instance, a biometric system based on retinal scan will be highly accurate while also suffering from low acceptability due to being intrusive to the users [28]; yet this can be a reasonable compromise in an high security environment.
In terms of classification, biometrics are traditionally grouped into two broad categories: physiological and behavioural [64, 27, 61].
2.2.1
Physiological Biometrics
Physiological biometrics is the class of traits based on a person’s unique physical characteristics. This type of biometrics is well established and subject to the majority of research. Well known examples include fingerprint, hand geometry, face, iris and retina. Some of these traits are incredibly reliable, as they change very little over time; however specialised hardware is often required to perform measurements and gather data from the associated body structure (e.g. fingerprint reader, iris scanner).
2.2.2
Behavioural Biometrics
Behavioural biometrics are the ones based on human behaviour. This type of biometrics is usually less established, however behavioural traits present a number of advantages over their physiological counterpart. In most cases, data collection can be performed without specialised hardware and with minimal or no intervention from the user, enabling cost effective and non-intrusive solutions [64, 61, 45, 40]. While most behavioural biometrics are not as precise as the best known physiological ones, they have been shown to be reliable enough to implement identity verification [61]. Behavioural biometrics are particularly useful in situations where user actions need to be monitored, as in surveillance applications. Examples of behavioural biometrics include gait, mouse dynamics, keystroke dynamics and handwriting.
Behavioural biometrics can be further separated into five categories [64, 61]:
Human-Computer Interaction (HCI). Based on the analysis of the
interaction with input devices such as mouse or keyboard.
Indirect HCI. Related to the low level actions of computer software,
trig-gered by unconscious user actions during system usage. These can include kernel function calls, logs or storage activity.
Motor skills. Probably the most studied type of behavioural biometrics. It
is based on the the analysis of the user’s muscle and joint movements while performing a given task.
Purely behavioural. This type of behavioural biometric is based on direct
behaviour evaluation, not relying on indirect measurements like muscle activity or user movements. This can measure how strategies are employed to resolve some tasks or the way an individual grips a tool.
2.3
Components of a Biometric System
A biometric system is usually composed by four main components [16, 4, 26]:
Sensor module. This module defines the human-machine interface in which
measured, different types of scanning devices can be required. Some care should be taken with data acquisition, as noise or bad reading quality can lead to degraded accuracy on user authentication.
Feature Extraction module. Given the raw data is acquired on the sensor
module, this module is responsible for processing and extracting a meaningful representation that describes the underlying trait.
Matching module. In this module, extracted feature sets are compared
against those stored in a template database, using a classifier or matching algorithm, ranging from statistical to machine learning approaches. Ultimately, this process results in a matching score, that represents a similarity measure between the extracted features and the ones previously stored in the database.
Decision module. Given the matching score and a decision threshold, this
module is responsible for either accepting or rejecting the claimed user identity, based on the matching score and a predefined threshold.
Some works consider the matching and the decision modules as a single component [28, 40], however it’s often convenient to treat them as separate modules, for instance when dealing with multiple biometric traits [28, 54, 65]. More detailed architectural descriptions also include quality assessment and enhancement modules [27].
User’s first contact with a biometric system is usually the enrolment phase, which is the process of registering the user in the system. During enrolment, biometric information is stored in a database; this information is typically referred as the template. Subsequent usage of the biometric system makes use of this template database to authenticate the user. Depending on the application context, a biometric system may operate in two modes: verification and identification [26, 28, 44]. In verification mode, the user claims an identity (e.g. through a username) that is checked by comparison of the captured biometric data against the templates associated with that identity. In identification mode, the system tries to establish the user identity by searching all users in the database for a match. For the purpose of this work, we’ll be considering a biometric system in terms of identity verification.
Figure 2.5 shows a summarised view of the four main modules and their interaction with user input and the template database, both in enrolment and identity verification.
Sensor ExtractionFeature Matcher Decision Template
Database Enrolment
Verification
Figure 2.5: Components and operation of a biometric system
2.4
Deployment on the Web
Concerning deployment, a web-based solution is naturally split between client and server. Given the modular architecture of a biometric system, we can consider some alternative configurations. Generally, deployment strategies can be classified as Server Deployment, Client Deployment or
Hybrid Deployment [40].
2.4.1
Server Deployment
With this configuration almost everything is placed on the server side, only the sensor module is on the client. Raw biometric data is acquired on the client and sent to the server, where feature extraction, matching and decision take place.
Theoretically, a server deployment strategy has the advantage that system updates (e.g. changing the extracted features or the matching algorithm) are only required on the server side, given that almost no functionality is on the client. However, this is not a real advantage in a web-based system, since the authentication client is not a static application, but a web page that is downloaded every time the user connects to the system. This means that client code can be updated as easily as server code. Also, this alternative has
the drawback of requiring more data and more computation being handled on the server.
2.4.2
Client Deployment
This deployment option places all the modules are on the client. Feature extraction, matching score calculation and decision are performed on the client side; only the template database is placed on the server.
Unless the client is some tamper resistant device (which usually is not), client deployment may not be of much use in the context of authentication on the web. In this scenario the decision on the identity verification is processed on the client, which makes identity theft a trivial task. Even if the decision module is placed on the server, the user can always tamper with matching results before sending to the server. As referred in Huang et al. [24], the client application should be as light as possible, since the attacker can be the client itself.
2.4.3
Hybrid Deployment
In this deployment strategy only the sensor and feature extraction modules are on the the client side. Feature extraction is performed on the client and then sent to the server, which takes care of matching and decision.
Hybrid deployment is the middle ground between Server Deployment and
Client Deployment. Computational costs are more balanced between client
and server and communication overhead is lower than in server deployment, but without compromising security.
2.5
Performance Metrics
Unlike in password-based authentication, biometrics have no perfect match; users are authenticated or rejected depending on the degree of similarity between the supplied biometric values and the ones stored in the template database. Matching scores are calculated by the matching module and a score
threshold is defined in order to distinguish between genuine and impostor authentication attempts. However, as shown in figure 2.6, genuine and impostor score distributions are not totally separated; fake identities can be incorrectly accepted and genuine identities incorrectly rejected.
Matching score Probability Genuine Impostor Threshold False Reject False Accept
Figure 2.6: Score distributions in a biometric system
Given these properties, some performance metrics are commonly used to evaluate the effectiveness of a biometric system [44, 16, 53, 43, 27]:
False Accept Rate (FAR). Represents the rate at which the system incorrectly accepts an invalid match for all threshold values. At any given threshold, it’s the percentage of invalid inputs which are incorrectly accepted or the probability that an impostor will be accepted. It’s symmetric value is the True Accept Rate (TAR), also commonly represented as 1-FRR.
False Reject Rate (FRR). Represents the rate at which the system
incor-rectly rejects a valid match for all threshold values. At any given threshold, it’s the percentage of valid inputs which are incorrectly rejected or the probability that a genuine user will be rejected.
Equal Error Rate (EER). Sometimes also referred as Crossover Error
Rate (CER), it’s the point at which FAR and FRR are the same. It can be easily obtained from the intersection of FAR and FRR curves and it’s often used as a single indicator of the system performance [42, 15]. In general, best performing systems have lower EER, however this value may often not be a region of interest when establishing a decision threshold.
Receiver Operating Characteristic (ROC). A representation of the
This representation is usually more useful than the EER alone and a good method of comparing different systems or different matching algorithms for the same system. In general, a larger area under the curve describes a system with better performance.
Detection Error Trade-off (DET). Similar to ROC, represents the
trade-off between FAR and FRR, usually plotted on a logarithmic scale. Although containing exactly the same data, this representation can be useful in high-lighting some details that may not be perceived form the ROC curve.
For some arbitrary score distributions, figure 2.7 shows the graphical repre-sentation of FAR and FRR curves, the corresponding ROC curve and how the EER point can be obtained from both representations.
Score threshold Error rate FRR FAR FAR 1-FRR ROC
Figure 2.7: Error rates and ROC curve of a biometric system
2.6
Keystroke Dynamics
2.6.1
Historical Context
The original concepts behind keystroke dynamics have been around since the World War II, where messages were transmitted using Morse code. With experience, telegraph operators developed a unique rhythm of dots and dashes known as the “fist of the sender”. This signature was often used by military intelligence to help distinguish allies from enemies [12]. In modern terms, keystroke dynamics can defined as the biometric which uses the keyboard typing behaviour to identify or authenticate an individual.
Pioneering studies on the applicability of keystroke dynamics were carried out by Forsen et al. [18] in 1977 and Gaines et al. [19] in 1980. In the first, a small group of subjects was asked to type their own and each others’ names; their results suggested that individuals typing their own name can be distinguished from others typing the same name. In the later, seven subjects typed multiple sentences (around 5000 characters in total) in two sessions; the developed statistical classification method was able to perfectly distinguish the typing behaviour of all subjects. Since then, a substantial amount of research has been done in this field, presenting a wide variety of classification techniques. Many of these were compiled and compared in survey studies composed during the last decade, most notably the works of Peakcock et al. [42], Killourhy and
Maxion [33], Shanmugapriya and Padmavathi [58], Crawford [15], Karnan et al. [30], Banerjee et al.[6] and Teh et al.[59].
Proposed classification algorithms range from purely statistical methods to neural networks, pattern recognition and hybrid approaches. In terms of data collection, studies are further separated into two broad categories: small password-like strings (as in Forsen et al. [18]) and long free-form typing samples (as in Gaines et al. [19]). More recently, also mobile, touch-enabled and pressure-sensitive devices have been successfully used to implement and augment keystroke dynamics solutions [25, 56, 3, 2].
2.6.2
Extracted Features
Typing behaviour can only be analysed when transformed into biometric features. The calculation of these features is based on the duration of various keystroke events of one or more keys, as presented in figure 2.8 (adapted from
Moskovitch et al. [40]):
Interval. Time between the key-up event of one key and the key-down event
of the following key. Despite the visual representation, it’s possible that the key-down event of the second key happens before the key-up event of the first key, resulting in a negative value.
Dwell time. Time between the key-down and key-up events of a given key
Latency. Time between the key-down event of the one key and the key-up
event of the following key.
Flight time. Time between key-down events of consecutive keys.
Up to up. Time between key-up events of consecutive keys. As with interval,
this feature can have a negative value.
time A B Interval A Dwell Time A B
Latency Flight Time
A B
Up to Up
A B
Figure 2.8: Relevant features in keystroke dynamics
Given a sequence of characters and the corresponding keystroke events, the above-mentioned features can be extracted from all keys or key pairs (de-pending on the feature) and combined in the form of a feature vector. Not all features are required to be part of the feature vector; if fact a feature vector can be composed of just one feature type. Once created, this vector is matched against a template vector using a matching algorithm.
Figure 2.9 offers a visual representation of and hypothetical template and genuine and impostor feature vectors. If we consider the matching algorithm to be a distance metric and the feature vector to be a point in the n-dimensional space (n equal to the size of the feature vector), genuine and impostor vectors can be classified by calculating the corresponding distance to the template vector (with smaller distance implying higher validation).
p a s s w o r d
Dwell time
template genuine impostor
2.6.3
Previous Studies and Results
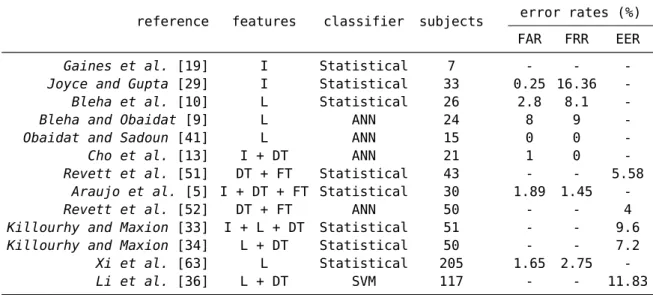
Table 2.1 shown some previous results on keystroke dynamics. As we can see, there are widely disparate results across studies, even when considering the ones within the same classifier. As noted by Killourhy [32], other factors can influence results besides the classifier. Most of keystroke dynamics evaluations involve additional steps, like choice of users, design of typing tasks, collection of keystroke timings and feature selection and extraction. At every step decisions are made, which ultimately determines how a dataset is constructed and performance is evaluated. As such, it’s very hard to compare different studies, unless those are performed over a common dataset and other variables are taken into account.
reference features classifier subjects error rates (%) FAR FRR EER
Gaines et al. [19] I Statistical 7 - -
-Joyce and Gupta [29] I Statistical 33 0.25 16.36
-Bleha et al. [10] L Statistical 26 2.8 8.1
-Bleha and Obaidat [9] L ANN 24 8 9
-Obaidat and Sadoun [41] L ANN 15 0 0
-Cho et al. [13] I + DT ANN 21 1 0
-Revett et al. [51] DT + FT Statistical 43 - - 5.58
Araujo et al. [5] I + DT + FT Statistical 30 1.89 1.45
-Revett et al. [52] DT + FT ANN 50 - - 4
Killourhy and Maxion [33] I + L + DT Statistical 51 - - 9.6
Killourhy and Maxion [34] L + DT Statistical 50 - - 7.2
Xi et al. [63] L Statistical 205 1.65 2.75
-Li et al. [36] L + DT SVM 117 - - 11.83
Table 2.1: Previous work on keystroke dynamics1
1 I = interval; L = latency; DT = dwell time; FT = flight time; ANN = neural
3
Experimental Design
In order to carry out this experiment, a biometric system was implemented from scratch in the form of an interactive web application. This system allows users to register, authenticate and also attack other users. At each step, biometric data is captured and stored for further analysis with different scenarios and matching algorithms, that will be presented in chapter 4. Given this work’s focus on web-based authentication, behavioural biometrics (more specifically HCI) was a natural choice for this particular purpose. Given that web browsers usually have limited access to resources and devices from the operating system, using conventional and largely available input devices can simultaneously provide a seamless experience to the user and be very cost effective in terms of implementation. As such, the implemented system was based on keystroke dynamics, in which the user’s typing behaviour is used as a biometric identifier.
Although some keystroke dynamics datasets are publicly available, most of these use a single password or pass-phrase for all users [39, 20, 33, 8]. This kind of experiment has the advantage that attack data for a given user can be derived from login data of all other users, however this is also not representative of most real-world environments. The lack of public datasets with differentiated credentials constitutes the motivation for building a new system, in which users are allowed to choose their own set of credentials.
Nonetheless, this approach also introduces new challenges, given that attack data must be explicitly collected and variability in user credentials must be accounted for in performance evaluation.
3.1
System Architecture
The implemented system was structured following an hybrid approach, as described in section 2.4.3. Using this deployment configuration both data collection and feature extraction take place on the client side. The user provides input (username and password) via keyboard, biometric data is recorded while the user interacts with the system, and both are sent to the server. On the server side, authentication credentials are verified and biometric features are matched against the biometric template. The user identity is confirmed only if the system validates both authentication factors.
Unlike other alternatives presented in section 2.1, the user provides a single input and biometric data is calculated on the client side according to the user’s typing behaviour. As portrayed in figure 3.1, this is a simpler form of interaction, completely transparent to the user, but still providing the benefits of multi-factor authentication.
Browser Server
1 1
2
Figure 3.1: Strong authentication with keystroke dynamics
From the possible features presented in section 2.6, dwell time and interval were chosen to create a biometric representation of the user input. The motivation for this choice is that these features are enough to characterise the whole typing behaviour. All other features can be derived from these two, meaning that the inclusion of more features would only introduce complexity (a larger feature vector) without additional information. This choice is similar
3.2
Implementation
Given the hybrid deployment approach, the system implementation has also been partitioned between client and server. The client-side was implemented as a web application written in HTML, CSS and JavaScript, while the server-side was implemented in Python, using the Django framework and an SQLite database. Special attention was taken on the implementation of the client-side application, which was required to be functional, accessible and capable of collecting the intended data.
Biometric data collection takes place while the user is typing the login cre-dentials; at each key press both key-up and key-down timestamps are stored. When the user submits the credentials a feature vector is automatically derived from the recorded timestamps and also submitted to the server. Table 3.1 presents an example of how interval and dwell time values are calculated from the user input. For any given set of credentials, the resulting feature vector size is given by U L ∗ 2 + P L ∗ 2 − 2, where U L is the username length and
P L is the password length.
In order to collect keystroke timestamps and calculate the corresponding feature vector, JavaScript was a natural choice, since it’s readily available in all modern browsers. The main concern regarding JavaScript was the resolution of timestamp measurements. To assess the viability of a JavaScript-based implementation a small test was performed in multiple browsers and operating systems; the duration of random events (between 0 and 50 milliseconds) was registered and plotted in the form of an histogram. As we can see from appendix A, most browsers have at least a 1 millisecond resolution, while others present a resolution of around 15 milliseconds, which is shown by the clustering of values around multiples of 15. This disparity is in fact caused by the clock resolution on Microsoft Windows [49, 35, 60].
Although 15 milliseconds is far from negligible, JavaScript has already been used with success on the collection of a keystroke dynamics dataset [8].
Killourhy and Maxion [31] further investigated this matter, concluding that
compared to an high-resolution clock (200 microsecond), a standard clock (15 millisecond) clock will result in a relative penalty of 4.2% in terms of
EER. Other implementation alternatives could certainly yield better accuracy on timestamp measurements, like building a desktop application or using
Flash or Java Servlets. However, this would also force users to install custom
browser plugins or runtime enviroments, decreasing accessibility and ultimately hindering participation on this study. Given these findings, and for the purpose of this work, JavaScript was considered to be the best compromise between all the above-mentioned requirements.
key
key-down timestamp
key-up
timestamp featurevector
K 1412810060936 1412810060944 8 : - - 8 D 1412810060952 1412810061016 64 : - - 56 U 1412810061072 1412810061136 64 : - - -8 S 1412810061128 1412810061216 88 : - - 120 E 1412810061336 1412810061448 112 : - - -64 R 1412810061384 1412810061488 104 K 1412810062544 1412810062608 64 : - - -8 D 1412810062600 1412810062664 64 : - - 80 S 1412810062744 1412810062840 96 : - - 96 E 1412810062936 1412810063008 72 : - - 96 C 1412810063104 1412810063192 88 : - - 144 R 1412810063336 1412810063424 88 : - - -56 E 1412810063368 1412810063480 112 : - - 48 T 1412810063528 1412810063608 80
3.3
Application and User Interaction
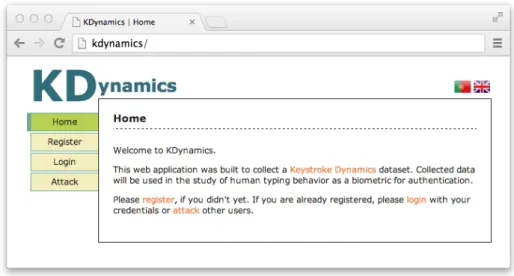
As shown in figure 3.2, the client-side application allows users to either register, login or attack other users. In every page, and as mentioned in section 3.1, collection of biometric data, feature extraction and connection with the server is automatically handled in the background using JavaScript. In case the user provides an invalid input or deletes some content, text areas are reset so biometric data can be collected from a clean state.
Figure 3.2: Web application: Home page
3.3.1
Registration
On registration, depicted in figure 3.3, users are asked to provide their chosen credentials. The only restriction being a minimum size of four characters for username and eight characters for password, which translates to a feature vector size of at least 22, as described in section 3.2.
The enrolment phase (figure 3.4) is also part of the registration process, in which users are required to enter those credentials ten more times. This procedure allows the system to establish a biometric profile and create a template database for each user. At each enrolment step, input is checked, keystroke timestamps are captured and feature vectors are calculated.
Figure 3.3: Web application: Registration
3.3.2
Login
After registration, users can provide login data to the system. On the login page, as shown in figure 3.5, the user only needs to present username and password, like with any standard login form.
Once the login information is submitted, the server-side application checks the provided input. In case the credentials don’t match to the registered username and password, the user is sent back to the login page with an error message. Otherwise the login is considered valid and the corresponding feature vector is stored in the database.
Upon a successful login, the user is also presented with a matching score (figure 3.6), calculated against the corresponding template database. This score is computed using a simple matching algorithm based on the Euclidean distance, and transformed to a percentage value, relative to empirically chosen threshold points. The calculated score is not stored by the system; being it’s sole purpose to provide feedback on the input and keep users engaged in the task of providing data to the system.
Figure 3.6: Web application: Login (matching score)
3.3.3
Attack
In addition to providing login data, users can also attack other users. On the attack page, as shown in figure 3.7, the first step is to identify the attacker. Once the attacker is identified, the server-side application picks another user as the victim, providing his login credentials, as shown in figure 3.8.
Attacker identification serves two main purposes: avoid that a user attacks himself and that the same attacker is repeatedly assigned to the same victim. In order to take these restrictions into account and to evenly distribute attacks, two rules are considered when choosing a victim:
• From all other users that the current user has not attacked yet, pick the one that has been attacked the least.
• If the current user has attacked all other users, pick the one that has been attacked the least.
Once the attacker submits data to the server, credentials are checked and the corresponding feature vector is stored as an attack vector for the victim. As in the login page, the attacker is also presented with a matching score (figure 3.9), computed against the victim’s template database, using the same
Figure 3.7: Web application: Attack (attacker identification)
4
Experimental Results
4.1
Collected Data
Data was gathered over the course of approximately 2 months, from 31 distinct users. Test subjects provided input to the system at their own discretion and without supervision. Other than the 10 initial templates captured in the enrolment phase, 402 logins and 730 attacks were collected. In terms of demographics, participants were mainly males, university students in the area of computer science.
Given that users used the web application at will, there was great variation on the quantity of inputs obtained per user. Some users provided just 5 logins, while others contributed with 20 or more. Regarding attack data, it was more evenly distributed across users, since the attack target selection was made by the application, as explained in section 3.3.
The collected data was anonymised and made available in JSON format, in
http://www.alunos.di.uminho.pt/~pg15384/kd.data.json.
4.2
Matching Algorithms
After collection of login and attack data, the system performance was evaluated using four simple statistical matching algorithms, based on the Euclidean
and Manhattan distance metrics and their scaled variants. These are classical distance metrics, used as matching algorithms in previous studies on keystroke dynamics and other biometrics [66, 10, 29, 11, 5, 55].
Euclidean matcher. This matching algorithm is the direct application of
the Euclidean distance in the n-dimensional space:
S = 1 n v u u t n X i=1 (¯xi− vi) 2 (4.1)
where v is the feature vector provided to the system, ¯x is the average feature
vector from the template database of the target user, n is length of v and S is the matching score.
Manhattan matcher. This matching algorithm is the direct application of
the Manhattan distance in the n-dimensional space:
S = 1 n n X i=1 |¯xi− vi| (4.2)
where v is the feature vector provided to the system, ¯x is the average feature
vector from the template database of the target user, n is length of v and S is the matching score.
Euclidean Scaled matcher. This matching algorithm is similar to the
Euclidean matcher; in addition each sub-distance is divided by the mean absolute deviation of it’s corresponding feature:
S = 1 n v u u t n X i=1 (¯xi− vi)2 di (4.3)
where v is the feature vector provided to the system, ¯x is the average feature
vector from the template database of the target user, n is length of v, d is the mean absolute deviation vector of v and S is the matching score.
Manhattan Scaled matcher. This matching algorithm is similar to the
absolute deviation of it’s corresponding feature: S = 1 n n X i=1 |¯xi− vi| di (4.4)
where v is the feature vector provided to the system, ¯x is the average feature
vector from the template database of the target user, n is length of v, d is the mean absolute deviation vector of v and S is the matching score.
4.3
Performance Analysis
To take the variation of user’s contributions into account, score and error distribution were first normalised for each user, and only then added together to calculate distributions and errors for the whole system. This method prevented the overall performance score from being biased towards the users with most contributions. Also, in order to accommodate temporal changes in the user’s typing behaviour a simple template update strategy was used: on every successful login, the oldest feature vector was discarded and replaced by the new one. This approach has also been used in other studies [23, 50]. In practice, matching scores and error rates are not continuous distributions, so an intersection point did not always exist between FAR and FRR curves. As shown in figure 4.1 and following the procedure described in Petrovska et
al. [43], the EER value was calculated as
EER = F RR(t1)+F AR(t1) 2 if F RR(t1) − F AR(t1) ≤ F RR(t2) − F AR(t2) F RR(t2)+F AR(t2) 2 otherwise (4.5) where t1 = max
t∈T {t|F AR(t) ≤ F RR(t)} , t2 = mint∈T {t|F AR(t) ≥ F RR(t)} and T is the set of threshold values that was used in the calculation of score distributions.
(a) EER point exists (b) EER estimated at t1 (c) EER estimated at t2 tEER FRR(t) FRR(t) t1 t2 t1 t2 EER FAR(t) EER FAR(t) EER FRR(t) FAR(t)
Figure 4.1: EER calculation at existing and estimated points
Given that the analysed matching algorithms are fundamentally distance mea-surements, lower scores denote higher validation. As such, score distributions and error rates are flipped on the score axis, compared to the description presented in section 2.5 (i.e. genuine scores on the left and impostor scores on the right). This is however just a matter of visual representation, and makes no difference when calculation the EER point or the ROC and DET curves.
4.3.1
Score Distributions and Error Rates
Regarding score distributions, all presented a roughly log-normal shape, with a long tail toward less accurate scores. This characteristic has also been observed by Montalvão and Freire [39] when analysing keystroke timing histograms. The Euclidean matcher had an EER value of 24.9% (figure 4.2) and the
Manhattan matcher an EER of 15.7% (figure 4.3). Using these matching
algorithms, genuine and impostor score distributions presented a large area of intersection, which consequently lead to high EER values.
By contrast, the scaled variants presented a much smaller area of intersection between genuine and impostor scores, resulting in lower EER values. The
Euclidean Scaled matcher presented an EER of 9.6% (figure 4.4) and the Manhattan Scaled matcher achieved the best overall performance, with an
0.00 0.05 0.10 0.15 0.20 0.25 0.30 Frequency Genuine Impostor Score 0.0 0.2 0.4 0.6 0.8 1.0
Error rate
EER
=24.
9%FRR FAR
Figure 4.2: Euclidean matcher: score distributions and error rates
0.00 0.05 0.10 0.15 0.20 0.25 0.30 Frequency Genuine Impostor Score 0.0 0.2 0.4 0.6 0.8 1.0 Error rate
EER
=15.
7% FRR FAR0.00 0.05 0.10 0.15 0.20 0.25 0.30 0.35 0.40 Frequency Genuine Impostor Score 0.0 0.2 0.4 0.6 0.8 1.0 Error rate
EER
=9.
6% FRRFARFigure 4.4: Euclidean Scaled matcher: score distributions and error rates
0.0 0.1 0.2 0.3 0.4 0.5 0.6 Frequency Genuine Impostor Score 0.0 0.2 0.4 0.6 0.8 1.0 Error rate
EER
=5.
4% FRR FAR4.3.2
Comparison of Matching Algorithms
The comparison between matching algorithms was done using the EER as an overall performance indicator and the ROC and DET curves as a measurement of the trade-off between error rates. Table 4.1 summarises this experiment’s results in terms of EER, while figure 4.6 shows a graphical overlap between the ROC and DET curves of the four matching algorithms. Appendix B also presents a detailed representation of this comparison in terms of ROC and DET curves. matcher EER (%) Euclidean 24.9 Manhattan 15.7 Euclidean Scaled 9.6 Manhattan Scaled 5.4
Table 4.1: Comparison of matching algorithms: EER
0.0 0.2 0.4 0.6 0.8 1.0 FAR 0.0 0.2 0.4 0.6 0.8 1.0 1-FRR Euclidean Manhattan Euclidean Scaled Manhattan Scaled 10-3 10-2 10-1 100 FAR 10-3 10-2 10-1 100 FRR
4.4
Template Updating
Biometric information can change over time. This can happen with any kind of biometric trait, but it’s specially relevant in the domain of behavioural biometrics [17, 48]. In this case, as users become more accustomed to typing a set of credentials, their behaviour changes. To accommodate these temporal variation and prevent ageing of the user’s biometric information, a template update strategy was used, as described in section 4.3.
In order to evaluate the impact of template updating in the overall system accuracy, score calculation was also performed without template updates, relying on the 10 original samples as the user’s template information. Table 4.2 compares EER values with and without template updating.
matcher template update EER (%) yes no Euclidean 24.9 26.8 Manhattan 15.7 16.9 Euclidean Scaled 9.6 12.4 Manhattan Scaled 5.4 7.8
Table 4.2: Comparison of EER, with and without template updating
4.5
Feature Vector Size
As a side effect of allowing users to choose their own authentication credentials, feature vectors of multiple sizes were part of the dataset, as presented in figure 4.7. This was also an opportunity to evaluate how the size of the feature vector can influence the system performance in terms of EER.
In order to verify how the size of the feature vector can interfere with matching results, users were split into two groups. Discarding the 8 users with a feature vector of size 30 (the median), 12 users with a shorter feature vector (≤ 28) and 11 users with a longer feature vector (≥ 32) remain. Table 4.3 shows a
comparison of the EER values, between the full set of users, users with short feature vector and users with long feature vector.
22 24 26 28 30 32 34 36 38
Feature vector size 1 2 3 45 6 7 8 Frequency
Figure 4.7: Frequency of feature vector sizes in the captured data
matcher
feature vector size EER (%) all [22-38] short [22-28] long [32-38] Euclidean 24.9 28.2 21.1 Manhattan 15.7 21.3 9.4 Euclidean Scaled 9.6 10.2 6.4 Manhattan Scaled 5.4 7.6 3.7
Table 4.3: Comparison of EER with different feature vector sizes
4.6
Discussion of Results
Scaled matchers achieved better performance, as expected. In these matching algorithms, each feature is divided by a variability measure, which in turn gives more weight to more stable features. This achieves better separation between genuine and impostor score distributions, which translates to better identity validation.
The Manhattan Scaled matcher achieved the best overall performance, with an EER of 5.4%. Although not directly comparable to other studies, this result is consistent with some previous research using statistical methods, as presented
in section 2.6. In practice, this EER value means that a genuine user will be incorrectly rejected once every 20 login attempts while an impostor will be authenticated once every 20 successful attacks. Nonetheless, the overlap of the DET curves also highlights that the Euclidean Scaled algorithm has a better trade-off when the FAR is below 1.3%. In a system tailored for low FAR, the Euclidean Scaled matcher would be preferred, in spite of presenting a much higher EER of 9.6%. As pointed in section 2.5, the EER can be misleading as a performance indicator.
In terms of template update, the presented results are also in line with with previous research [21, 22, 47], in which template updating can lead to considerable improvements in terms of detection accuracy. Regarding the size of the feature vector, longer vectors achieved consistently lower EER values. Finally, the fact that all these variables can greatly influence the measured performance, further reinforces the notion that it’s very hard to compare different studies.
5
Conclusions and Future Work
With the conclusion of this work, and regarding the original research goals, keystroke dynamics can be considered a viable choice to implement strong authentication on the web. We’ve shown that this technology can be integrated on top of a tradition authentication procedure, taking advantage of user input to seamlessly capture and classify the associated typing behaviour.
Keystroke dynamics presented some notable advantages over other alterna-tives. No specialised hardware was needed, just a web browser supporting JavaScript. Biometric data acquisition was completely transparent and multi-factor authentication was effectively achieved with a single conscious action from the user. In addition, even simple matching algorithms, as the ones used in this study, can yield reasonable accuracy on authentication (5.4% EER with the Scaled Manhattan matcher).
Although the proposed goals of this work were successfully met, some points could have been improved. An assessment of the system usability should have been done by the users that participated in the study. Furthermore, the target population was greatly biased, mainly computer science students, which are probably better typists than the average individual. Although more complex, applying this study to a more diverse population would give an even closer representation of a real environment.
In terms of future work, there are still many questions that were not addressed
by this work. For instance, it would be interesting to develop a complementary study, focused on the evaluation of more sophisticated algorithms, in order to further improve matching accuracy. Another issue to be tackled is the collection of a much larger and more representative dataset, using the system developed in this work, that could serve as the starting point of subsequent studies on human typing behaviour.
A
JavaScript Timestamp Resolution
5 10 15 20 25 30 35 40 45 50 Dwell time
Frequency
Windows: Internet Explorer
5 10 15 20 25 30 35 40 45 50 Dwell time
Frequency
Windows: Google Chrome
5 10 15 20 25 30 35 40 45 50 Dwell time Frequency Windows: Firefox 5 10 15 20 25 30 35 40 45 50 Dwell time Frequency Windows: Safari 5 10 15 20 25 30 35 40 45 50 Dwell time Frequency Windows: Opera 5 10 15 20 25 30 35 40 45 50 Dwell time Frequency
Mac OS: Google Chrome
5 10 15 20 25 30 35 40 45 50 Dwell time
Frequency
Mac OS: Firefox
5 10 15 20 25 30 35 40 45 50 Dwell time
Frequency
Mac OS: Opera
5 10 15 20 25 30 35 40 45 50 Dwell time
Frequency
Mac OS: Safari
5 10 15 20 25 30 35 40 45 50 Dwell time
Frequency
Ubuntu: Google Chrome
5 10 15 20 25 30 35 40 45 50 Dwell time Frequency Ubuntu: Firefox 5 10 15 20 25 30 35 40 45 50 Dwell time Frequency Ubuntu: Opera
JavaScript timestamp resolution on multiple environments
B
Comparison of Matching Algorithms
0.0 0.2 0.4 0.6 0.8 1.0 FAR 0.0 0.2 0.4 0.6 0.8 1.0 1-FRR Euclidean (EER=24.9%) Manhattan (EER=15.7%)
Euclidean Scaled (EER=9.6%)
Manhattan Scaled (EER=5.4%)
Comparison of matching algorithms (ROC)
10-3 10-2 10-1 100 FAR 10-3 10-2 10-1 100 FRR
FA
R
=
1
.
3%
Euclidean Manhattan Euclidean Scaled Manhattan ScaledC
Source Code
This appendix presents selected parts of the source code used in the implemen-tation of matching algorithms and analysis of the collected data. Also available in http://www.alunos.di.uminho.pt/~pg15384/kd.analysis.zip. Listing C.1: matchers.py 1 # coding: utf8 -*-2 3 ’’’matchers.py 4 Matching algorithms.’’’ 5
6 from math import sqrt, fabs 7
8
9 def template_mean(templates):
10 ’’’Calculates the mean feature vector
11 from the template database.’’’
12 nt = len(templates) # number of templates
13 nf = len(templates[0]) # number of features 14
15 mean_vector = [None] * nf 16 for i in range(nf):
17 features = [t[i] for t in templates]
18 mean_vector[i] = float(sum(features)) / nt 19 20 return mean_vector 21 22 23 def template_mad(templates):
24 ’’’Calculates the mean absolute deviation vector
25 from the user template database.’’’
26 nt = len(templates) # number of templates
27 nf = len(templates[0]) # number of features 28
29 mean_vector = template_mean(templates) 30 mad_vector = [None] * nf
31 for i in range(nf):
32 features = [t[i] for t in templates] 33 diff = 0.0
34 for feature in features:
35 diff += fabs(feature - mean_vector[i]) 36 mad_vector[i] = diff / nt
37
38 return mad_vector 39
40
41 def euclidean(templates, feature_vector):
42 ’’’Matcher based on the Euclidean distance.’’’
43 nf = len(feature_vector) # number of features 44
45 mean_vector = template_mean(templates) 46 sqdistance = 0.0
47 for i in range(nf):
48 sqdistance += pow(mean_vector[i] - feature_vector[i], 2) 49 distance = sqrt(sqdistance)
50
51 score = distance / nf # average distance per feature 52 return score
53 54
55 def manhattan(templates, feature_vector):
56 ’’’Matcher based on the Manhattan distance.’’’
57 nf = len(feature_vector) # number of features 58
59 mean_vector = template_mean(templates) 60 distance = 0.0
61 for i in range(nf):
62 distance += fabs(mean_vector[i] - feature_vector[i]) 63
64 score = distance / nf # average distance per feature 65 return score
66 67
68 def euclidean_scaled(templates, feature_vector): 69 ’’’Matcher based on the Euclidean distance.
70 Each sub-distance is multiplied by a weight
71 calculated for the corresponding feature.’’’
73
74 weight_vector = [1.0 / mad for mad in template_mad(templates)] 75 mean_vector = template_mean(templates)
76 sqdistance = 0.0 77 for i in range(nf):
78 sub_distance = pow(mean_vector[i] - feature_vector[i], 2) 79 sqdistance += sub_distance * weight_vector[i]
80 distance = sqrt(sqdistance) 81
82 score = distance / nf # average distance per feature 83 return score
84 85
86 def manhattan_scaled(templates, feature_vector): 87 ’’’Matcher based on the Manhattan distance.
88 Each sub-distance is multiplied by a weight
89 calculated for the corresponding feature.’’’
90 nf = len(feature_vector) # number of features 91
92 weight_vector = [1.0 / mad for mad in template_mad(templates)] 93 mean_vector = template_mean(templates)
94 distance = 0.0 95 for i in range(nf):
96 sub_distance = fabs(mean_vector[i] - feature_vector[i]) 97 distance += weight_vector[i] * sub_distance
98
99 score = distance / nf # average distance per feature 100 return score
Listing C.2: scores.py
1 # coding: utf8 -*-2
3 ’’’scores.py
4 Scores and EER calculation.’’’
5
6 def calculate_scores(data, matcher, template_updating=True): 7 ’’’Calculates matching scores.’’’
8 logins = [] 9 attacks = [] 10
11 # for each user
12 for user, user_data in data.items(): 13 user_login_scores = []
14 user_attack_scores = [] 15
17 templates = user_data[’template’][:] 18 login_data = user_data[’login’] 19 attack_data = user_data[’attack’] 20
21 # calculate attack scores with initial templates
22 for attack_vector in attack_data:
23 score = matcher(templates, attack_vector) 24 user_attack_scores.append(score)
25
26 # for each user login
27 for login_vector in login_data: 28
29 # get login score
30 score = matcher(templates, login_vector) 31 user_login_scores.append(score)
32
33 if template_updating is True:
34 # update template with new login feature vector
35 templates.append(login_vector) 36 # delete the oldest template
37 del templates[0]
38
39 # get attack scores for updated template database
40 for attack_vector in attack_data:
41 score = matcher(templates, attack_vector) 42 user_attack_scores.append(score)
43
44 # calculate weights to normalize scores
45 lw = 1.0 / len(user_login_scores) 46 aw = 1.0 / len(user_attack_scores) 47
48 # add user scores and weights to the global scores
49 logins.extend([(s, lw) for s in user_login_scores]) 50 attacks.extend([(s, aw) for s in user_attack_scores]) 51
52 return (logins, attacks) 53
54
55 def cumsum(data):
56 ’’’ Calculate cumulative sum.
57 Auxiliary function for EER calculation.’’’
58 result = [] 59 _sum = 0 60 61 for n in data: 62 _sum += n 63 result.append(_sum)
64
65 return result 66
67
68 def histogram(data, weights=None, range=None, bins=100): 69 ’’’Calculate histogram.
70 Auxiliary function for EER calculation.’’’
71 result = [0.0] * bins 72 index = None
73
74 if range is None:
75 range = [min(data), max(data)] 76
77 if weights is None:
78 weights = [1.0] * len(data); 79
80 bin_size = float(range[1] - range[0]) / bins 81 value_threshold = range[0]
82
83 for value, weight in sorted(zip(data, weights)): 84 while value_threshold <= value:
85 value_threshold += bin_size 86 if index is None:
87 index = 0
88 elif index < bins - 1:
89 index += 1
90
91 if index is not None:
92 result[index] += 1.0 * weight 93
94 return result 95
96
97 def calculate_eer(data, matcher, bincount=100000, update=True): 98 ’’’Calculate EER point.’’’
99 # get login a attack score data
100 logins, attacks = calculate_scores(data, matcher, update) 101
102 # get login scores and corresponding weights
103 login_scores, login_weights = [], [] 104 for login in logins:
105 login_scores.append(login[0]) 106 login_weights.append(login[1]) 107
108 # get attack scores and corresponding weights
109 attack_scores, attack_weights = [], [] 110 for attack in attacks:
111 attack_scores.append(attack[0]) 112 attack_weights.append(attack[1]) 113
114 # calculate common range to align bins on both histograms
115 min_score = min(min(login_scores), min(attack_scores)) 116 max_score = max(max(login_scores), max(attack_scores)) 117 hist_range = (min_score, max_score)
118
119 # create login and attack score distribution histograms
120 login_hist = histogram( 121 login_scores, 122 weights=login_weights, 123 range=hist_range, 124 bins=bincount, 125 ) 126 attack_hist = histogram( 127 attack_scores, 128 weights=attack_weights, 129 range=hist_range, 130 bins=bincount, 131 ) 132 133 # cumulative sums 134 login_hist_cumsum = cumsum(login_hist) 135 attack_hist_cumsum = cumsum(attack_hist) 136
137 # false reject rate
138 factor = 1.0 / attack_hist_cumsum[-1]
139 far_hist = [factor * s for s in attack_hist_cumsum] 140
141 # true accept rate (detection rate)
142 factor = 1.0 / login_hist_cumsum[-1]
143 tar_hist = [factor * s for s in login_hist_cumsum] 144 # false reject rate
145 frr_hist = [1.0 - s for s in tar_hist] 146
147 # find left threshold
148 left_index = 0
149 while left_index < bincount \
150 and far_hist[left_index] <= frr_hist[left_index]: 151 left_index += 1
152 left_index = max(0, left_index - 1) 153
154 # find right threshold
155 right_index = left_index
156 while(right_index < bincount \