Surface Roughness Optimization of SAE 1020 and SAE 1045 Turning Process
Using Design of Experiments
Otimização da Rugosidade Superficial dos Aços SAE 1020 e SAE 1045 em
Processo de Torneamento usando Projeto de Experimentos
DOI:10.34117/bjdv6n10-367
Recebimento dos originais: 16/09/2020 Aceitação para publicação: 16/10/2020
Ariane Ferreira Porto Rosa
Doutora em Automatique et Informatique Appliquées (Spécialité Génie Industriel Qualité), pela Université de Nantes, França.
Instituição: Universidade Federal de Pelotas, Centro de Engenharias Endereço: Rua Benjamin Constant, 989 – Porto, Pelotas - RS, Brasil - 96010-020
E-mail: [email protected]
Jonas Müller Hammes
Bacharel em Engenharia de Produção Universidade Federal de Pelotas Instituição: Universidade Federal de Pelotas, Centro de Engenharias Endereço: Rua Benjamin Constant, 989 – Porto, Pelotas - RS, Brasil - 96010-020
E-mail: [email protected]
Rogério Royer
Doutor em Administração pela Universidade Federal do Rio Grande do Sul Instituição: Universidade Federal de Pelotas, Centro de Engenharias Endereço: Rua Benjamin Constant, 989 – Porto, Pelotas - RS, Brasil - 96010-020
E-mail: [email protected]
ABSTRACT
This paper presents an investigation of the surface roughness in a turning process of SAE 1020 and SAE 1045 materials in order to suggest experimental models. The main objectives are to predict the surface roughness, to select the optimal cutting parameters, and to analyze the effects of cutting parameters. The study of this work allows to find more efficient methods to assist the Computer Numeric Control (CNC) turning process, optimizing its cutting parameters: cutting speed, feed rate and depth of cut. Factorial design was used for the experiment plan. At work, we investigated the turning conditions for SAE 1020 and 1045 steels with carbide tool. The measured data were analyzed by regression analysis. From the experimental results and regression analysis, this research project suggested the experimental equations, proposed the optimal cutting parameters, and analyzed the effects of cutting parameters on surface roughness.
Keywords: Design of experiments, turning, surface roughness. RESUMO
Este trabalho apresenta uma investigação da rugosidade superficial em um processo de torneamento de materiais SAE 1020 e SAE 1045 a fim de sugerir modelos experimentais. Os objetivos principais são prever a rugosidade da superfície, selecionar os parâmetros de corte ideais e analisar os efeitos dos parâmetros de corte. O estudo deste trabalho permite encontrar métodos mais eficientes para auxiliar o processo de torneamento por Controle Numérico Computadorizado (CNC), otimizando
seus parâmetros de corte: velocidade de corte, avanço e profundidade de corte. O planejamento fatorial foi usado para o plano de experimento. No trabalho, investigamos as condições de torneamento dos aços SAE 1020 e 1045 com ferramenta de metal duro. Os dados medidos foram analisados por análise de regressão. A partir dos resultados experimentais e da análise de regressão, este projeto de pesquisa sugeriu as equações experimentais, propôs os parâmetros de corte ideais e analisou os efeitos dos parâmetros de corte na rugosidade da superfície.
Palavras-chave: Projeto de experimentos. Usinagem. Rugosidade superficial.
1 INTRODUCTION
The classical definition of productivity is the relation between an output and the controllable factors (LOVELL, 1993). This concept is widely applied in the context of metalworking industry, where it is possible to obtain significant yield from the correct use of turning methods and parameters.
According to Machado et al. (2011), the term turning is widely known as a manufacturing process that transforms metal chips, close to 10% of all productivity, and still employs millions of people worldwide. It is necessary to optimize the manufacturing processes, which must also meet the quality standards and dimensional tolerances expected.
The same authors point out that the variety of options for cutting-in parameters in the machining results in several combinations. There are three ways to address this complexity: initially through experience that is acquired through constant attempts and mistakes over the years; through experimentation, which is time consuming and focused on a particular situation, which can not be generalized; and finally, through theoretical models, from simplistic mathematical models to more sophisticated numerical models.
Therefore, it is necessary to apply new methods to obtain greater efficiency in the surface finish of machined products. In this way, the design of experiments for experimental planning, supported by multivariate statistical techniques, becomes applicable. The purpose of the design of experiments is to construct predictable response models for the interest variables, since there are several factors that vary conjointly (HINES et al., 2006).
The main objective of this work is the elaboration of an explanatory and experimental model for roughness (Ra) capable of assisting in the optimization of the parameters of cutting speed, feed rate and depth of cut in the external cylindrical turning process of SAE 1020 and SAE 1045.
2 MECHANICAL MANUFACTURING PROCESSES
Machado et al. (2011) point out that manufacturing activity in industrialized countries accounts for about 20 to 30% of Gross Domestic Product serving as a parameter to the standard of living of a society.
The manufacture of metal products is performed by mechanical processes that to give shape (geometry, dimensions and surface finish) to the metal alloy or pure metal according to the specifications established for the products. It also to measure a set of properties (hardness, mechanical strength, density, wear resistance, etc.) that is conditioned for good performance of process (KIMINAMI, et al., 2013).
The mechanical processes are constituted by the plastic forming processes and the machining processes. The plastic forming processes applied stresses below the breaking strength limit of the material. The machining processes applied stresses exceeding the breaking strength of the chip-forming material.
Machining operations are understood as the operations that to assign to the pieces shape, dimensions or finish, or even a combination of the three items (FERRARESI, 1970).
For Kiminami et al. (2013) machining processes are used to manufacture certain types of products, which in some cases require dimensional accuracy and surface finishing to semi-finished parts.
Machining is a manufacturing process in which a cutting tool is used to remove material from a solid until it reaches the desired shape. Machining is one of the most important processes for manufacturing assemblies, and can be applied to a wide range of materials, such as flat surfaces, cylinders and round holes (KIMINAMI et al., 2013).
2.1 TURNING
According to Ferraresi (1970) the turning, machining process studied in this paper, is defined by a mechanical machining process to obtain cylindrical surfaces of revolution (cylindrical, conical or profile), with one or more single-cutting tools. The workpiece rotates around the main axis of rotation of the machine and the tool travels along a coplanar path with the axis referenced. More specifically, in the external cylindrical cut, the workpiece rotates around the axis while the cutting tool performs the longitudinal feed motion (MACHADO et al., 2011).
The turning process can be classified for the purpose in roughing and finishing operations. In the turning process the main input variables can be: the characteristics of the workpiece material; the cutting tool (material and geometry); the cutting parameters (cutting speed, feed rate and depth of cut) and finally the lubricating fluid.
The output variables of the turning process can be: temperature; the strength and the finish of the machined surface (roughness and surface tension) (SOUSA, 2011).
As a general rule, the parameters for a finishing operation are defined by a low feed rate due to their influence on roughness, a small depth of cut and a high cutting speed. Thus, the removal rate of
material (volume of material removed per unit time) is reasonable without significant influence of the vibration in the process (SOUSA, 2011).
Moreover, according to Machado et al. (2011) the turning process is an unpredictable process, a complicated and simple process at the same time, in which parts are manufactured by removing the leftover material in chip format. It is an unpredictable process due to the numerous ideal cutting conditions.
2.2 ROUGHNESS
According to Nunes (2011), surface roughness are fine irregularities or micro-geometric errors resulting from the inherent action of the cutting process. The surface roughness is closely linked to the importance of finishing and the accuracy of adjustments between the parts witch have to be coupled. The surface finish of the pieces is measured through the surface roughness, which is expressed in microns (AGOSTINHO, et al., 1977).
Furthermore, the surface roughness is formed by small irregularities, fine or macro geometric errors, coming from the action of a cutting process (marks of advance, wear of tool, etc.). Generally, ripples and failures in the fabrication of a surface should be avoided as they constitute process errors. The surface roughness of the material is defined according to the type of application that will be provided for the surface (MACHADO et al., 2011).
A low value for surface roughness is always preferable for bearing surfaces, surfaces requiring paint, surfaces for gas and fluid flow, and whose appearance must be bright and the surface should reflect rays and lights. A very common example for surfaces that work under lubrication, and require specific roughness, are internal combustion engines.
The roughness measurement is performed with or without contact between a probe and the part. Moreover, it is easier to perform it by contact due to both simplicity and lower cost.
The surface roughness tester equipment is a diamond probe. It runs in a straight line at a defined distance (sampling length). The probe’s displacement is converted in an electrical signal and is then amplified. The speed of travel of a roughness gauge probe is in the range of 2.5 mm/s.
Machado, et al. (2011) assert that when a workpiece is run through the machining process, it is usually examined in macro geometric terms (dimensions, shape and orientation) and micro geometric (surface roughness). Measures defined in the design project, such as tolerances and roughness specifications, must be performed on the machined workpiece.
According to Agostinho et al. (1977), the ABNT standard proposes the M system as the model for Brazil. The M system or midline system is characterized by the concept of the midline (Center Line Average, CLA): which is a parallel line in the direction of the profile, and Sample length, in
such a way that the sum of the upper edges, included between it and the effective profile, is equal to the sum of the lower areas, in the sample length L, shown by Figure 1.
Figure 1. Center Line Average Roughness
Source: Agostinho et al. (1977)
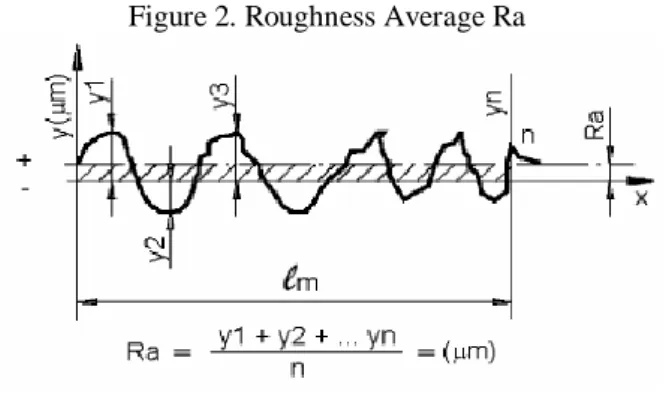
Roughness Average (Ra) is defined from an arithmetic average of the effective part profile values, related to the midline of a sampling length, as shown by Figure 2 (AGOSTINHO et al., 1977). Machado et al. (2011) states that the Ra parameter is the most widely used in industry and is available in the simplest instruments for control and measurement. Since Ra is an average value, it is a stable parameter, and does not receive the influence of other eventual effects.
Figure 2. Roughness Average Ra
Source: Lima and Correa (2008)
Lima and Corrêa (2008) define the maximum roughness Ry through the highest value of the partial roughness (Zi) that is presented in the measurement path (lm), as shown in Figure 3.
Figure 3. Maximum Roughness Ry
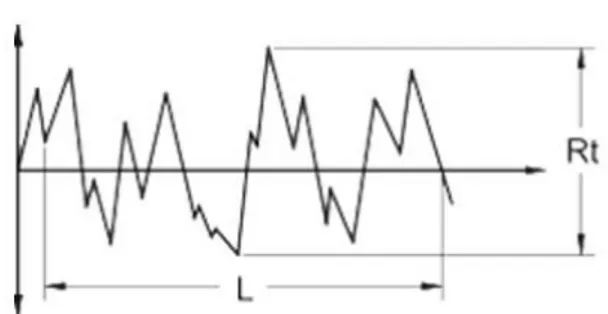
According to Machado et al. (2011) the total roughness Rt can be defined as the vertical distance calculated between the highest peak height of the measured profile and the deepest valley within a sample length (lm), shown in Figure 4.
Figure 4. Total Roughness Rt
Source: Lima and Correa (2008)
3 DESIGN OF EXPERIMENTS
For Hines et al. (2006) experiments are done in all scientific and engineering disciplines, being a large part of learning and discovery in most processes.
A planned experiment can be defined as a test, or a series of tests, in which the values of input variables of a given process are modified. Then, it is possible to identify the corresponding changes in the output variable process (MONTGOMERY, 2004).
Let X1, X2, ..., Xp be the controllable process variables. However, there are still non-controllable variables, which are Z1, Z2, ..., Zp (although they can be controlled by test effects).
Montgomery (2004) points out that experimental planning methods are used in process development and also in solving process problems. They improve both performance and robustness of the process.
In addition, experimental planning is an engineering tool that plays an indispensable role in engineering planning activities, in which new products are developed, and those which already exist are improved.
Montgomery (2004) points out that factorial planning is widely used in process development and improvement. A current experiment is full factorial planning with k factors, where each factor has two levels. The two-level full factorial 2k design is among the most widely used types of design for screening experiments in industry.
Some case studies and researches have been found in the literature on application of design of experiments in the processes of mechanical metalworking. Pereira (2006) presents an application of the two-level full factorial 2k design in order to define an adequate functional relationship between tool life, machined surface roughness and cutting parameters. More specifically, in his work, a study
of the machining conditions of a hardened ABNT 52100 steel with the use of mixed ceramic tools was carried out.
Mendes (2010) studies the determination of an optimized value for the machining parameters (cutting speed and feed rate), insert type, processing time and wear of the insert using a CNC lathe. The goal was to reduce operating costs. For the elaboration of his study, the experimental design techniques were used to verify the significance and, later, application of the multivariate loss function. Campos et al. (2011) presents a mathematical model for several parameters of roughness of the part (Ra, Rt) in the turning process of a hardened ABNT 52100 steel with mixed ceramic tool using wiper geometry. These models were generated by the experimental design methodology, and had as variables of influence the parameters cutting speed, feed rate and machining depth.
Da Rosa et al. (2014) shows an analysis of the tools with wiper and conventional geometry (standard) in the machining of a turning process for dry finishing of an AISI 420C steel. The parameters of average and total roughness were measured under different cutting parameters using design of experiments.
4 EXPERIMENTAL PROCEDURE
4.1 MATERIALS
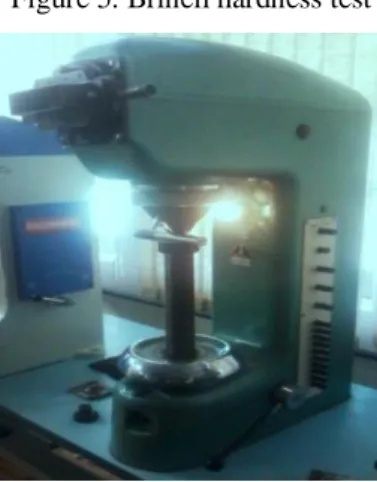
For the certification of the SAE 1020 and SAE 1045 steels the Brinell hardness test was performed. This test is done by penetrating a 2,5 mm diameter steel sphere under the test body using a force of 187,5 kgf. Subsequently, the diameter of the printed material cap was checked. From the data collected, and with the help of the table provided by the equipment manufacturer, it was possible to validate the authenticity of the SAE 1020 and SAE 1045 steels through the HB hardness found. Figure 5 show the Brinell hardness test.
Figure 5. Brinell hardness test
4.2 CUTTING AND WORKPIECES STANDARDIZATION
Initially, 11 workpieces were cut for SAE 1020 and 11 workpieces were cut for SAE 1045 steel, with a length of 185mm. Horizontal band saw was used, with automatic activation.
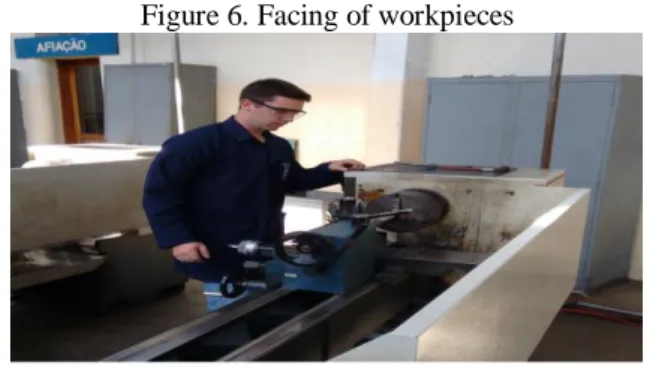
After the cutting of the materials, all one-inch diameter specimens were unified for the 180mm length through the facing operation. Center holes were drilled in all specimens to ensure greater support and avoid vibrations during the machining process. These activities were elaborated in a conventional lathe, shown in Figure 6.
Figure 6. Facing of workpieces
Source: Authors
After the preparation of the machine, all 22 workpieces were machined. The tests were performed according to the variation of the cutting parameters defined in the experimental design developed as shown in Figures 9 and 10. The process of turning the workpieces is shown in Figure 7. For the execution of the machining process, a water-based cutting fluid was used in order to extend the life of the cutting tool.
Figure 7. CNC turning process
Source: Authors
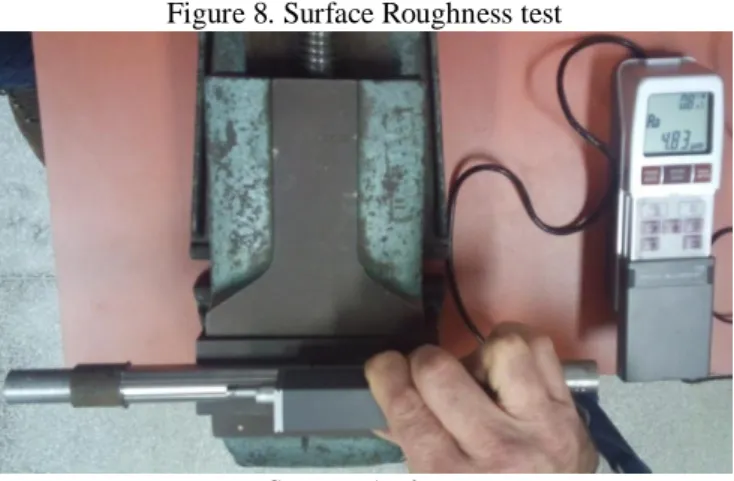
4.3 SURFACE ROUGHNESS TEST
The surface roughness test was carried out in the mechanical manufacturing laboratory of the Federal University of Rio Grande FURG, Brazil. The equipment used was the Mitutoyo portable surface roughness tester. The measurement scale used in this device was the parameter Ra (μm).
The measurement process basically consists in traversing the roughness with a standard shaped probe moving under the workpiece surface. While the probe is following the roughness, the needle movement of the device is transformed into electrical impulses, which in turn is registered in the instrument's display. Figure 8 shows the equipment and the roughness check process.
After the execution of the turning process, the values for surface roughness were measured in each test specimen.
Figure 8. Surface Roughness test
Source: Authors
4.4 2k DESIGN OF EXPERIMENTS
A two-level full factorial design 23 was elaborated with three factors A, B and C. The experimental Factor A was assigned to the Feed Rate parameter, Factor B attributed to the Depth of Cut parameter and Factor C assigned to the Cutting Speed parameter. After the tests were carried out and the roughness data were collected, they were submitted to statistical analysis.
The factorial design was represented geometrically as a cube with 23 = 8 rounds. The data did not have replication, but 3 central points were added, in order to give more degrees of freedom for the experiment. The effects of interest in factorial planning 23 are the main effects A, B and C and the three interactions of two factors (AB, AC and BC) and a three-factor interaction (ABC). The response variable obtained in the experiment is Superficial Roughness Average Ra.
Figures 9 and 10 show the rounds of the experiments performed, the center points studied and the surface roughness values collected for the SAE 1020 and SAE 1045 steels.
Figure 9. Turning process data of SAE 1020
Source: Authors
Figure 10. Turning process data SAE 1045
Source: Authors
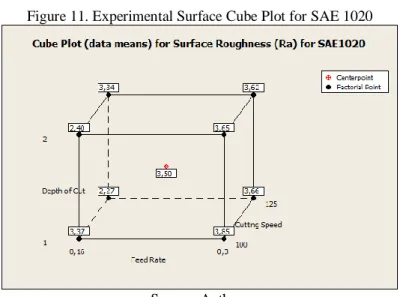
5 RESULTS
The graphs generated by the analysis of the experimental design are presented, Figure 11 presents the experimental surface, cube plot, for SAE 1020.
Figure 11. Experimental Surface Cube Plot for SAE 1020
Source: Authors
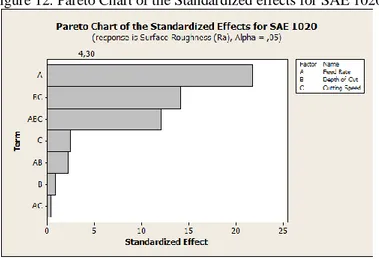
Figure 12 shows the Pareto Chart of the standardized effects as a function of SAE 1020 steel for each model parameter (A, B, C) and interactions (AB, BC, AC and ABC). We can verify through
SAE 1020 A B C Feed Rate (mm/rev) Depth of Cut (mm) Cutting Speed (m/min) Superficial Roughness (Ra)
1 -1 -1 -1 0,16 1 100 3,37 2 +1 -1 -1 0,3 1 100 3,85 3 -1 +1 -1 0,16 2 100 2,40 4 +1 +1 +1 0,3 2 100 3,65 5 -1 -1 +1 0,16 1 125 2,27 6 +1 -1 -1 0,3 1 125 3,66 7 -1 +1 +1 0,16 2 125 3,34 8 +1 +1 + 1 0,3 2 125 3,62 9 0 0 0 0,23 1,5 112,5 3,50 10 0 0 0 0,23 1,5 112,5 3,56 11 0 0 0 0,23 1,5 112,5 3,45
SAE 1045 A B C Feed Rate (mm/rev) Depth of Cut (mm) Cutting Speed (m/min) Superficial Roughness (Ra)
1 -1 -1 -1 0,16 1 100 2,32 2 +1 -1 -1 0,3 1 100 4,46 3 -1 +1 -1 0,16 2 100 2,27 4 +1 +1 +1 0,3 2 100 5,09 5 -1 -1 +1 0,16 1 125 2,64 6 +1 -1 -1 0,3 1 125 4,06 7 -1 +1 +1 0,16 2 125 2,8 8 +1 +1 + 1 0,3 2 125 4,8 9 0 0 0 0,23 1,5 112,5 3,52 10 0 0 0 0,23 1,5 112,5 3,47 11 0 0 0 0,23 1,5 112,5 3,53
the red cut line (corresponding to p-value 4.30) that only the main parameter (A), and the interactions (BC and ABC) were significant for the response variable Roughness Ra. The parameters (B and C), and the interactions between the parameters (AB and AC) are below the cut-off line being therefore not significant for the response variable Roughness Ra.
Figure 12. Pareto Chart of the Standardized effects for SAE 1020
Source: Authors
After the result of the Pareto Chart analysis, the parameters (B and C) and the interactions (AB and AC) of the experimental design model were removed. The regression model containing only the main parameter (A) and the interactions (BC and ABC) was selected.
Equation (1) presents the regression model obtained by the analysis of the design of experiments containing only the main parameter A (Feed rate) and the interactions BC (Feed rate x Depth of cut) and ABC (Feed rate x Depth of cut x Cutting speed) in the coded units of the experimental matrix.
𝑦 = 29,98 − 81,78𝐴 + 0,17𝐵𝐶 − 0,54𝐴𝐵𝐶 (1)
The regression model obtained for SAE 1020 steel has a residual standard deviation of 0,0550 and the adjusted determination coefficient of 98,86%.
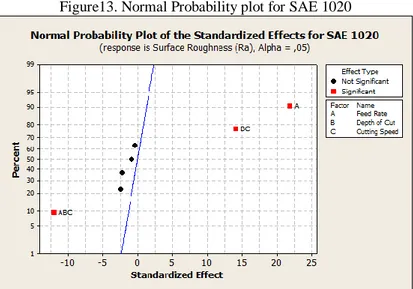
Figure 13 shows the normal probability plot of the standardized effects of the model obtained for SAE 1020 steel. It is possible to visualize that the study parameters that showed significance for the roughness response variable were (A) and the interactions (BC) and (ABC), represented by the red dots in the plot. The other parameters and interactions did not present significance for the variable of interest, remaining next to the blue line, represented by the black points.
Figure13. Normal Probability plot for SAE 1020
Source: Authors
Figure 14 presents the experimental surface, cube plot, for SAE 1045.
Figure 14. Experimental Surface Cube Plot for SAE 1045
Source: Authors
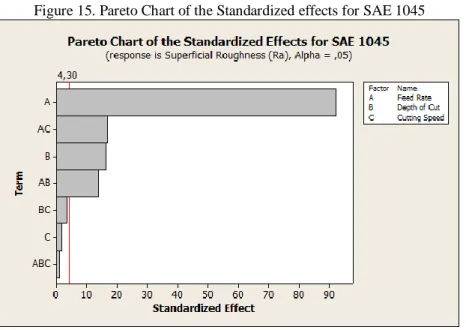
Figure 15 shows the Pareto Chart of the standardized effects as a function of the SAE 1045 for each model parameter (A, B, C) and the interactions (AB, BC, AC and ABC). It can be verified through the red cut line (corresponding to p-value 4,30) that only the main parameters (A and B), and interactions (AB and AC) were significant for the response variable Roughness Ra. The parameter (C), and the interactions between the parameters (BC and ABC) are below the cut-off line being therefore not significant for the response variable Roughness Ra.
Figure 15. Pareto Chart of the Standardized effects for SAE 1045
Source: Authors
After the result of Pareto Chart analysis, the parameters (C and C) and the interactions (BC and ABC) of the experimental design model were removed. The regression model containing only the main parameters (A and B) and the interactions (AB and AC) was selected.
Equation (2) presents the regression model obtained by the analysis of the experimental design containing only the main parameters (A and B) the interactions (AB and AC) in the coded units of the experimental matrix.
𝑦 = −2,57 + 28,14𝐴 − 2,12𝐵 + 7,71𝐴𝐵 − 0,18𝐴𝐶 (3)
were y = Roughness, A = Feed rate, B = Depth of cut and C = Cutting Speed in the units of measure of each parameter.
The regression model obtained for SAE 1045 steel has a residual standard deviation of 0,0321 and the adjusted determination coefficient of 99,89%.
Figure 16 presents the normal probability analysis of the standardized effects of the model obtained for SAE 1045. In Figure 16 it is possible to visualize that the parameters in study that presented significance for the roughness response variable were the parameters (A and B) and the interactions (AB) and (AC), represented by the red dots in the plot. The other parameters and interactions did not present significance for the variable of interest, remaining next to the blue line, represented by the black points.
Figure16. Normal Probability plot for SAE 1045
Source: Authors
More results are presented in Appendix A and B. Appendix A presents Figures 17 to 22 with the tables of the variance analysis for the regression models obtained for Roughness Ra of SAE 1020 and SAE 1045. Appendix B shows Figures 23 to 26 with the effect plots of parameters and the first-order interactions for the regression models obtained for Roughness Ra of the SAE 1020 and SAE 1045.
Using the regression model obtained in equation (1) for SAE 1020, the best values of the significant parameters were obtained for the minimization of roughness Ra: feed with 0,16 mm/rotation, depth of cut of 1mm and cutting speed of 125m/min, resulting in a minimum value of roughness Ra of 2,27μm.
For the SAE 1045, using the regression model obtained in equation (2), the best values of the significant parameters were obtained for the minimization of roughness Ra: feed rate with 0,16 mm /rotation, depth of cut of 2mm and cutting speed of 100m/min, resulting in a minimum value of roughness Ra of 2,27μm.
6 CONCLUSIONS
The main objective of this study was to verify the influence of the machining parameters in the turning process of SAE 1020 and SAE 1045, more specifically in the following factors: feed rate, depth of cut and cutting speed. The response variable studied in the process was surface roughness average Ra. A full factorial 23 design of experiments was used.
The conclusions presented here come from the turning process through the thinning operation of the 11 workpieces made for each of the SAE 1020 and SAE 1045, totaling 22 workpieces machined in a CNC lathe.
Through the analysis of the results of the experimental design, two regression multiple linear regression models were proposed for the response variable Roughness Ra as a function of factors (feed rate, depth of cut and cutting speed), one for each type of material tested, SAE 1020 and SAE 1045.
In order to obtain a low surface roughness in the specimens the feed rate parameter has a positive influence at a low level. When the feed rate value increases, the values of the average roughness Ra also increase.
An important point to be highlighted for the SAE 1020 is that the parameters depth of cut and cutting speed were not statistically significant for the variable Ra.
Also, the interactions between the parameters feed rate versus depth of cut and feed rate versus cutting speed were not statistically significant for the variable Ra.
For the SAE 1045, the parameter cutting speed, and the interactions between the parameters depth of cut versus cutting speed and the interaction between feed rate versus cutting speed versus depth of cut were not statistically significant for the variable Ra.
In relation to the values of the roughness (Ra) collected, a close proximity between the values in both materials SAE 1020 an SAE 1045 was noticed. Although the SAE 1020 produced in some machining the appearance of false indicia at the cutting tool tip, the material had in general a lower surface roughness in the roughing operations performed by the turning process.
This paper showed that 2k factorial experiments are useful tools for the experimental researches, since their elaboration, execution and analysis are simple compared to experiments involving more than two levels for each experimental parameter.
REFERENCES
AGOSTINHO, O. L.; RODRIGUES, A. C. S.; LIRANI, J. Tolerâncias, ajustes, desvios e análise de dimensões. São Paulo: Edgar Blücher, 1977.
CAMPOS, P. H.; DE PAIVA, A. P.; FERREIRA, J. R.; BALESTRASSI, P.P. Modelagem da rugosidade (Ra, Rt) no torneamento duro com cerâmica mista alisadora utilizando projetos de experimentos (DOE). In: XXXI ENCONTRO NACIONAL DE ENGENHARIA DE PRODUÇÃO, Belo Horizonte, 2011.
DA ROSA, G. C.; DE SOUZA, A. J.; FU, K.; WRITZL, D. Análise das variáveis de entrada nos parâmetros de rugosidade em um processo de torneamento de acabamento a seco do aço aisi 420C. In: VIII CONGRESSO NACIONAL DE ENGENHARIA MECÂNICA, Uberlândia, 2014.
FERRARESI, D. Fundamentos da Usinagem dos Metais. São Paulo: Blücher, 1970.
GIL, A. C. Métodos e Técnicas de Pesquisa Social. São Paulo: Atlas S.A., 2009.
HINES, W.W.; MONTGOMERY, D. C.; GOLDSMAN, D.M.; BORROR, C. M. Probabilidade e Estatística na Engenharia. 4ª Ed. Rio de Janeiro: LTC, 2006.
KIMINAMI, C. S.; DE CASTRO, W.B.; DE OLIVEIRA, M.F. Introdução aos processos de fabricação de produtos metálicos. São Paulo: Blucher, 2013.
LIMA, F.E.; CORRÊA, M. Correlação entre os parâmetros de rugosidade: uma abordagem matemática. Revista Tecnologia, v. 29, n. 1, 2008.
LOVELL, C. A. K. Production Frontiers and Productive Efficiency in HAROLD, O. et al. (Ed.). The Measurement of Productive Efficiency: Techniques and Applications: Techniques and Applications. Oxford University Press, 1993.
MACHADO, A.R.; ABRÃO, A.M.; COELHO, R.T.; SILVA, M. B. Teoria da Usinagem dos Materiais. São Paulo: Blucher, 2 ed. 2011.
MENDES, A.A. Aplicação de projeto de experimentos para a otimização de um processo de usinagem em torno CNC. In: XXX ENCONTRO NACIONAL DE ENGENHARIA DE PRODUÇÃO, São Paulo, 2010.
MONTGOMERY, D.C.; RUNGER, G.C. Estatística Aplicada e Probabilidade para Engenheiros. 4ª Ed. Rio de Janeiro: LTC, 2009.
NUNES, L.T. Análise estatística da influência dos parâmetros de corte na rugosidade no torneamento do aço microligado DIN 38MnSiVS5. 2011. Dissertação – Mestrado em Engenharia Mecânica. Programa de Pós Graduação em Engenharia Mecânica. Universidade Federal de Uberlândia, 2011.
PEREIRA, J.C.C. Estudo das condições de corte no torneamento do aço ABNT 52100 endurecido, utilizando a metodologia de projeto de experimentos (DOE). Itajubá: Universidade Federal de Itajubá, Dissertação de Mestrado, 132 p, 2006.
SOUZA, A. J. Processos de Fabricação por Usinagem, Parte 1 Fundamentos da Usinagem de Materiais, GPFAI-DEMEC-UFRGS/Apostila, 2011.
APPENDIX A
Figure 17. Estimated Effects and Coefficients for Surface Roughness (Ra) (coded units) for SAE 1020
Source: Authors
Figure 18. Variance Analysis for Surface Roughness (Ra) (coded units) for SAE 1020
Source: Authors
Figure 19. Estimated Coefficients for Surface Roughness (Ra) using data in uncoded units for SAE 1020
Source: Authors
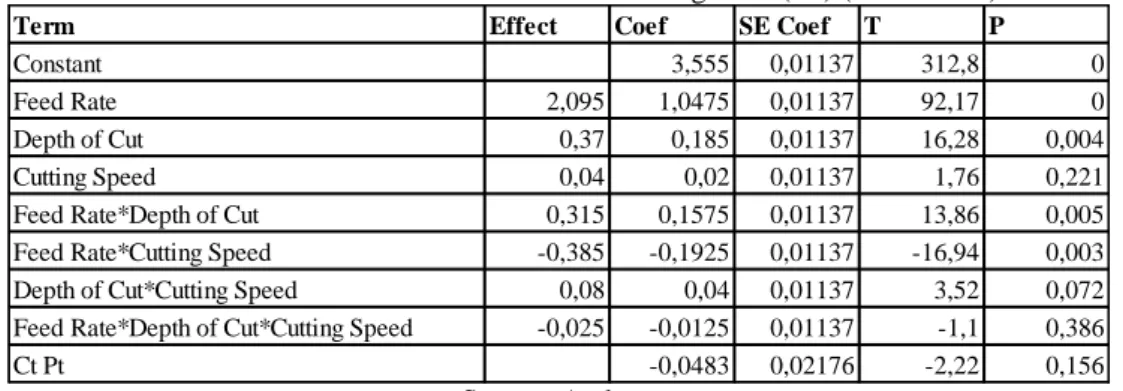
Figure 20. Estimated Effects and Coefficients for Surface Roughness (Ra) (coded units) for SAE 1045
Source: Authors
Term Effect Coef SE Coef T P
Constant 3,27 0,01947 167,93 0
Feed Rate 0,85 0,425 0,01947 21,83 0,002
Depth of Cut -0,035 -0,0175 0,01947 -0,9 0,464 Cutting Speed -0,095 -0,0475 0,01947 -2,44 0,135 Feed Rate*Depth of Cut -0,085 -0,0425 0,01947 -2,18 0,161 Feed Rate*Cutting Speed -0,015 -0,0075 0,01947 -0,39 0,737 Depth of Cut*Cutting Speed 0,55 0,275 0,01947 14,12 0,005 Feed Rate*Depth of Cut*Cutting Speed -0,47 -0,235 0,01947 -12,07 0,007
Center Points 0,2333 0,03729 6,26 0,025
Source DF Seq SS Adj SS Adj MS F P
Main Effects 3 1,4655 1,4655 0,4885 161,04 0,006 2-Way Interactions 3 0,6199 0,6199 0,206633 68,12 0,015 3-Way Interactions 1 0,4418 0,4418 0,4418 145,65 0,007 Curvature 1 0,11879 0,11879 0,118788 39,16 0,025 Residual Error 2 0,00607 0,00607 0,003033 Pure Error 2 0,00607 0,00607 0,003033 Total 10 2,65205
Term Effect Coef SE Coef T P
Constant 3,555 0,01137 312,8 0
Feed Rate 2,095 1,0475 0,01137 92,17 0
Depth of Cut 0,37 0,185 0,01137 16,28 0,004
Cutting Speed 0,04 0,02 0,01137 1,76 0,221
Feed Rate*Depth of Cut 0,315 0,1575 0,01137 13,86 0,005 Feed Rate*Cutting Speed -0,385 -0,1925 0,01137 -16,94 0,003 Depth of Cut*Cutting Speed 0,08 0,04 0,01137 3,52 0,072 Feed Rate*Depth of Cut*Cutting Speed -0,025 -0,0125 0,01137 -1,1 0,386
Figure 21. Variance Analysis for Surface Roughness (Ra) (coded units) for SAE 1045
Source: Authors
Figure 22. Estimated Coefficients for Surface Roughness (Ra) using data in uncoded units for SAE 1045
Source: Authors
APPENDIX B
Figure 23. Main Effects Plot for Surface Roughness (Ra) for SAE 1020
Source: Authors
Source DF Seq SS Adj SS Adj MS F P
Main Effects 3 9,05505 9,05505 3,01835 2920,98 0 2-Way Interactions 3 0,5077 0,5077 0,16923 163,77 0,006 3-Way Interactions 1 0,00125 0,00125 0,00125 1,21 0,386 Curvature 1 0,0051 0,0051 0,0051 4,93 0,156 Residual Error 2 0,00207 0,00207 0,00103 Pure Error 2 0,00207 0,00207 0,00103 Total 10 9,57116
Figure 24. Interaction Plot for Surface Roughness (Ra) for SAE 1020
Source: Authors
Figure 25. Main Effects Plot for Surface Roughness (Ra) for SAE 1045
Source: Authors
Figure 26. Interaction Plot for Surface Roughness (Ra) for SAE 1045