Diana Filipa Pereira Vaz
Graduated in BiochemistryDissertation presented to obtain the Master Degree in Molecular Genetics and Biomedicine
Insights into
Campylobacter jejuni
Desulforubrerythrin catalytic mechanism
Supervisor: Prof. Miguel S. Teixeira, Professor, ITQB-UNL
Co-Supervisor: Dr. Célia V. Romão, Auxiliary Investigator, ITQB-UNL
Membros do júri:
Presidente: Doutora Paula Maria Theriaga Mendes Bernardo Gonçalves Arguente: Doutor Carlos Aberto Gomes Salgueiro
Vogal: Doutora Célia Maria Valente Romão
V
Direitos de cópia
Insights into Desulforubrerythrin catalytic mechanism
Diana Filipa Pereira Vaz
FCT/UNL, UNL
VII
“The scientist does not study nature because
it is useful; he studies it because he delights
in it, and he delights in it because it is beautiful.”
IX
Acknowledgments
Several people were indispensable for making of the work here described.
First, I would like to acknowledge the availability of my supervisors, Professor Miguel Teixeira and Doctor Célia Romão. To Prof. Miguel Teixeira, I would like to thank for giving me the opportunity to start my research work in his laboratory. I hope such an experience made me grow as a young scientist and also as a person. I am also grateful for all the advices, knowledge and work discussions. To Dr. Célia Romão, I acknowledge for all the advices and discussions, for always pushing me forward, and also for her interest and concern in subjects that go beyond the present work.
I also would like to acknowledge all the other members of the Metalloproteins and Bioenergetics Unit: Manuela Pereira, Afonso Duarte, Ana Paula Baptista, Patrícia Refojo, Vera Gonçalves, Sandra Santos, Bruno Marreiros, Elísio Silva, Filipa Calisto, Filipa Sena, Joana Simões, Paulo Castro, Cecília Miranda, Rodrigo David and Joana Carrilho. I would also like to thank to the former members of this unit Miguel Ribeiro and Liliana Pinto. To all of them I am grateful for the help and the advices, namely during my first stages in the laboratory, and also for all the good moments. The following people deserve a special word of gratitude: Liliana, who introduced the laboratorial work to me; Joana C., who was always available to help me; Rodrigo, who lots of times brought me to and from the lab.
I am grateful to my family, especially to my mother. Without her hard work and sacrifice I would have never made it so far.
XI
Abstract
The following work aims to contribute to a better understanding of systems involved in resistance to oxidative stress species, namely hydrogen peroxide. The work is focused in one protein from the pathogen Campylobacter jejuni: desulforubrerythrin. Desulforubrerythrin is a non-heme iron protein in
which the catalytic centre harbours a diiron cluster. Besides, the protein has a desulforedoxin domain at the N-terminal and a rubredoxin domain at the C-terminal. With the objective of understanding the protein catalytic mechanism three site-directed mutants, as well the wild type protein, were over expressed in Escherichia coli, purified and studied through biochemical and spectroscopic techniques.
The amino acid residues selected for mutations are two tyrosines near the catalytic centre (residues 59 and 127). These residues are strictly conserved in rubrerythrins; moreover in diiron centres containing proteins tyrosines play a role in dissipating oxidizing species of iron (IV) by forming a tyrosil radical. The selected residues were replaced by a phenalanine residue which gave rise to three mutants: Y59F, Y127F and Y59F Y127F. These were characterized having as reference the wild type protein. All proteins have a molecular mass of 24 kDa and are tetramers in solution. The EPR and UV-visible techniques confirmed the presence of the three metallic domains in the wild type and Y59F mutant. The Y127F mutant was successfully used to test a protocol for diiron centre reconstitution in desulforubrerythrin.
Finally, crystals of the wild type and, for the first time, of the Y59F and double mutants were obtained. The X-ray data for the mutants were collected with a resolution of 1.9 Å and its structure will be determined.
XIII
Resumo
O trabalho aqui apresentado pretende contribuir para alargar o conhecimento sobre sistemas envolvidos na resistência ao stress oxidativo, nomeadamente na resistência ao peróxido de
hidrogénio. O trabalho foi dirigido para o estudo de uma proteína do patogénio Campylobacter jejuni:
desulforubreritrina. A desulforubreritrina é uma proteína com ferro não hémico cujo centro catalítico comporta dois átomos de ferro. Além disso, a proteína possui no N-terminal um dominio do tipo desulforedoxina e no C-terminal um domínio semelhante a uma rubredoxina
Com o objectivo de compreender o mecanismo catalítico da proteína três mutantes dirigidos, assim como a proteína selvagem, foram sobre expressos em Escherichia coli, purificados e
caracterizados utilizando técnicas bioquímicas e espectroscópicas. Os resíduos de aminoácidos seleccionados para efectuar as mutações são duas tirosinas que se encontram junto do centro catalítico (resíduos 59 e127). Estes resíduos são estritamente conservados em rubreritrinas; além disso, em proteínas que contêm centros binucleares de ferro as tirosinas desempenham um papel importante na dissipação de espécies oxidantes de ferro (IV) à custa da formação de um radical tirosil. Os resíduos seleccionados foram substituídos por uma fenilalanina dando origem a três mutantes: Y59F, Y127F e Y59F Y127F. Os mutantes foram caracterizados tendo como referência a proteína selvagem. Todas as proteínas têm uma massa molecular de 24 kDa e são tetrâmeros em solução. As técnicas de Ressonância Paramagnética Electrónica (RPE) e de espectroscopia de UV-Vis confirmaram a presença dos três domínios metálicos na proteína selvagem e no mutante Y59F. A proteína com a mutação no resíduo 127 foi utilizada com sucesso para testar um protocolo de reconstituição de centros binucleares de ferro na desulforubreritrina.
Finalmente, cristais da proteína selvagem e, pela primeira vez, dos mutantes Y59F e Y59F Y127F foram obtidos. Os dados de difracção de raios-X para os mutantes foram recolhidos com uma resolução de 1.9 Å
XV
Table of contents
Direitos de cópia ... V
Acknowledgments ... IX
Abstract ... XI
Resumo . ... XIII
1. INTRODUCTION ... 1
1.1. Reactive oxygen species (ROS) and oxidative stress ... 1
1.1.1. Oxygen ... 1
1.1.2. Reactive oxygen species... 1
1.1.3. Sources of ROS in living organisms ... 2
1.1.4. Iron and ROS ... 2
1.1.5. Toxicity of H2O2 ... 3
1.1.6. ROS detoxifying systems ... 3
1.2. Rubrerythrins ... 4
1.2.1. Structural domains ... 4
1.2.2. Physiological activity ... 6
1.2.3. Desulforubrerythrin ... 8
1.3. Campylobacter jejuni: an overview ... 9
1.3.1. C. jejuni, oxidative stress and iron ... 11
1.3.2. Pathogenesis mechanisms ... 14
1.4. Campylobacter jejuni, ROS and the immune system response ... 16
2. MATERIALS AND METHODS ... 19
2.1 Strains and resistances ... 19
2.2 Gene cloning ... 19
2.3 Cells transformation ... 19
2.4 Protein expression tests for DRbr mutants ... 20
2.5 Expression of the recombinant DRbr and DRbr mutants ... 20
2.6 Recombinant proteins purification ... 20
2.7 Electrophoretic analysis ... 21
2.8 Determination of protein and iron concentration ... 23
2.9 Molecular mass determination ... 23
2.10 N-terminal sequencing... 24
XVI
3 RESULTS ... 27
3.1 Protein expression tests for the Desulforubrerythrin mutants ... 27
3.2 Proteins expression ... 28
3.3 Biochemical characterization ... 29
3.3.1 Protein purification ... 29
3.3.2 Quantifications ... 33
3.3.3 UV-Visible spectra ... 35
3.3.4 Oligomerization state in solution ... 36
3.3.5 N-terminal sequencing ... 39
3.4 Crystallization experiments ... 40
3.5 EPR studies ... 45
3.5.1 EPR spectra ... 45
3.5.2 Diiron centre reconstitution... 46
3.5.3 Redox titration of the wild type protein ... 47
4 DISCUSSION ... 51
4.1 Diiron proteins ... 51
4.2 Protein expression tests for desulforubrerythrin mutants ... 56
4.3 Proteins expression ... 56
4.4 Biochemical characterization ... 56
4.4.1 Proteins purification ... 56
4.4.2 UV-Vis spectra ... 57
4.4.3 Quantifications ... 58
4.4.4 Oligomerization state in solution ... 58
4.4.5 N-terminal sequencing ... 58
4.5 Into desulforubrerythrin metallic sites: EPR studies ... 59
4.6 Final remarks ... 64
5 REFERENCES ... 67
6 APPENDIX ... 75
6.1 Electronic Paramagnetic Resonance ... 75
XVII
List of figures
Figure 1.1: Structure of Desulfovibrio vulgaris rubrerythrin . ... 4
Figure 1.2: Dendogram of proteins from the rubrerythrin family . ... 5
Figure 1.3: Four-helix bundle of D. vulgaris rubrerythrin... 6
Figure 1.4: Comparison between rubredoxin and desulforedoxin.. ... 6
Figure 1.5: Desulforubrerythrin in a tetrameric conformation... 8
Figure 1.6: Depiction of the diiron centre evidencing its surrounding tyrosines. ... 9
Figure 1.7: Localization of Campylobacter genus in the tree of life. ... 10
Figure 1.8: Campylobacter jejuni scanning microscopy image ... 11
Figure 1.9: Simplified representation of oxidative stress regulation in Campylobacter jejuni... 14
Figure 1.10: NOX role in generation of ROS in phagosomes.. ... 16
Figure 1.11: Importance of ROS in the immune system. ... 16
Figure 1.12: Representative scheme of pathological inflammation.. ... 17
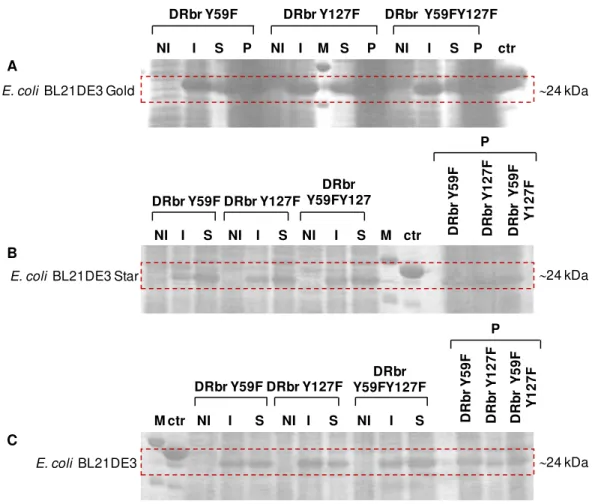
Figure 3.1: SDS-PAGE of non-induced and induced cell samples of the protein expression tests for DRbr mutants. ... 27
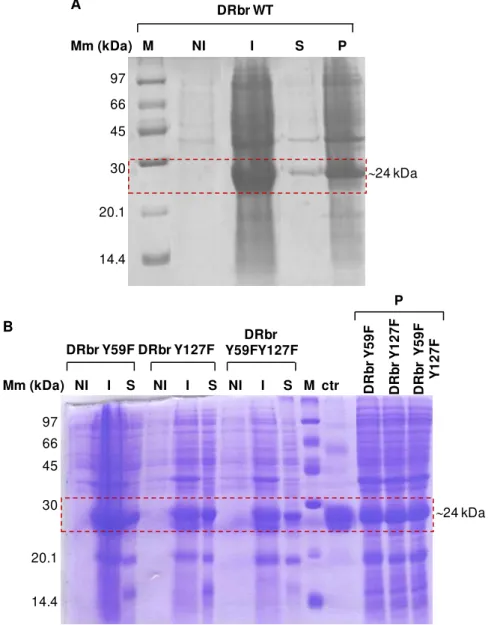
Figure 3.2: SDS-PAGE of samples from protein expression. ... 28
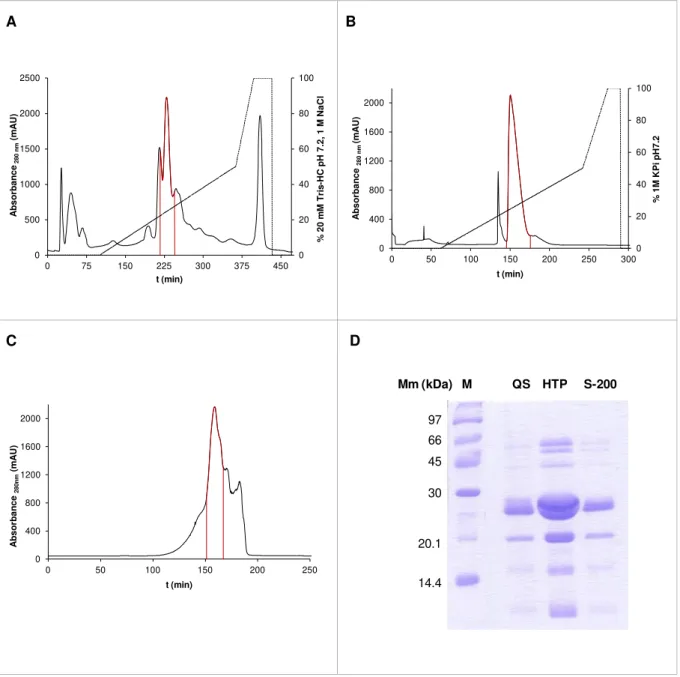
Figure 3.3: Resume of WT DRbr purification.. ... 30
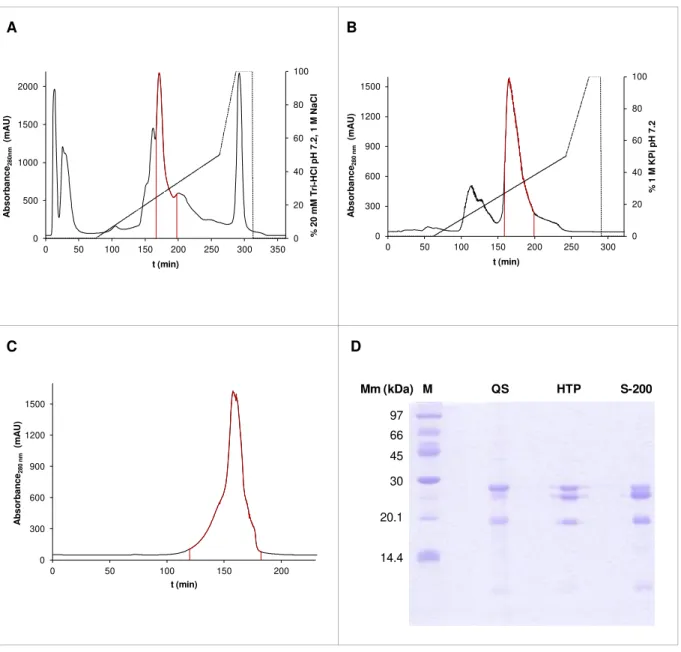
Figure 3.4: Resume of the DRbr Y59F purification. ... 31
Figure 3.5: Resume of the DRbr Y12F purification.. ... 32
Figure 3.6: Resume of the DRbr Y59F Y127F purification.. ... 33
Figure 3.7: Calibration curve to determine the protein concentration through the BCA method. ... 34
Figure 3.8: Calibration curve to determine the iron concentration through the TPTZ method.. ... 34
Figure 3.9: UV-Visible spectra from final fractions of DRbr proteins. ... 35
Figure 3.10: Overlap of the UV -Visible absorption spectra of wild type and desulforubrerythrin mutants... 36
Figure 3.11: Calibration curve of the size exclusion column.. ... 37
Figure 3.12: Elution profiles of DRbr proteins from the analytical size exclusion column. ... 38
Figure 3.13: PVDF membrane after the protein transference and before the bands were cut... 39
Figure 3.14: Examples of some DRbr Y127F crystals obtained using the Structure Screen 1 & 2. ... 40
Figure 3.15: Crystallizations conditions tested for the protein DRbr Y127F with 100 mM Hepes pH 7.5 and 10% isopropanol with different concentrations of PEG 4K. ... 41
Figure 3.16: Crystallizations conditions tested for the protein DRbr Y127F with 100 mM Hepes pH 7.5 and 10% glycerol with different concentrations of PEG 8K... 41
Figure 3.17: Crystallizations conditions tested for the protein DRbr Y127F with 100 Bicine pH 9.0 and 100 mM NaCl with different concentrations of PEG 550. ... 41
Figure 3.18: Crystallizations conditions tested for the protein DRbr Y127F with 100 mM Tris-HCl pH 8.5 and 10 mM NiCl2 with different concentrations of PEG 2K. ... 42
Figure 3.19: Crystallizations conditions tested for the protein DRbr Y127F with 100 mM Hepes pH 7.5 and 10 % PEG 8K with different concentrations of glycerol... 42
XVIII
Figure 3.21: Example of crystals obtained for the wild type protein. ... 43
Figure 3.22: Resume of all crystallization conditions tested for DRbr Y59F and DRbr Y59F Y127F. .. 44
Figure 3.23: Crystals obtained for DRbr Y59F. ... 44
Figure 3.24: Crystals obtained for DRbr Y59F Y127F.. ... 45
Figure 3.25: EPR spectra of DRbr proteins.. ... 46
Figure 3.26: EPR spectra of the DRbr Y127F before and after the diiron centre reconstitution. ... 47
Figure 3.27: Redox titration of desulforubrerythrin wild type... 48
Figure 3.28: Redox titration of DRBr WT followed by EPR spectroscopy. ... 49
Figure 3.29: Redox titration of DRBr WT followed by EPR spectroscopy.. ... 49
Figure 3.30: Redox titration of DRbr WT followed by EPR spectroscopy.. ... 50
Figure 4.1: Amino acid sequence alignment of rubrerythrins and ribonucleotide reductases. ... 55
Figure 4.2: UV-Visible spectra of erythrin and desulforubrerythrin.. ... 57
XIX
List of tables
Table 1.1: Example of genes up and down regulated by Fur, PerR and iron. ... 14
Table 2.1: Instructions for LB and LA media preparation. ... 19
Table 2.2: Instructions for preparation of SDS-PAGE gels.. ... 21
Table 2.3: Solution components for preparing loading buffer with and without urea. ... 22
Table 2.4: Components and respective concentrations of the lysis buffer. ... 22
Table 3.1: Quantifications performed for all final fractions from the protein purifications. ... 34
Table 3.2: Absorbance ratios between the different absorbance peaks... 36
Table 3.3: Elution volumes of the molecular mass standards of the S-200 calibration. ... 37
Table 3.4: Elution volumes and molecular masses of WT and DRbr mutants ... 39
Table 3.5: Elution volumes and molecular masses of WT and DRbr mutants ... 39
Table 3.6: Results of the N-terminal sequencing …...40
XXI
Abbreviations
Å Angstrom (10-10 meters)
BCA Bicinchoninc acid
BSA Bovine Serum Albumine
Cia Campylobacter invasion antigens
CDT Cytolethal Distending Toxin
CD Coestimulatory molecule
Da Dalton
DC Dendritic cell
DRbr Desulforubrerythrin
DRbr Y59F Desulforubrerythrin with residue 59 (tyrosine) replaced by a phenylalanine
DRbr Y127F Desulforubrerythrin with residue 127 (tyrosine) replaced by a phenylalanine
DRbr Y59F Y127F Desulforubrerythrin with residues 59 and 127 (tyrosines) replaced by phenylalanines
Dfx Desulfoferrodoxin
DNA Deoxyribonucleic acid
Dps DNA binding protein from starved cells
Dx Desulforedoxin
E’0 Conditional reduction potential
e- Electron
ε Molar absortivity
EPR Electron paramagnetic resonance
FUR Ferric uptake regulator
g EPR-g factor
H+ Proton
ICP Induced Coupled Plasma
IL Interleukine
IPTG Isopropythiogalactoside
LB Lysogeny broth
LOS Lipooligossacharides
MES 2-(N-morpholino) ethanesulphonic acid
NADH Reduced nicotinamide adenine dinucleotide
NF-B Nuclear factor B
NADPH Reduced nicotinamide adenine dinucleotide phosphate
O.D. Optical density
PAGE Polyacrylamide gel electrophoresis
PEG Polyethylene glycol
XXII
PDB Protein Data Bank
Rbr Rubrerythrin
Rd Rubredoxin
ROS Reactive oxygen species
S Spin quantum number
SDS Sodium dodecyl sulphate
SOD Superoxide Dismutase
TCEP Tris-(2-Carboxyethyl)phosphine hydrochloride
TEMED N, N, N', N'-tetramethylethylenediamine
TNF-α Tumor Necrosis Factor α
TPTZ 2, 4, 6 – tripyridyl-triazine
Tris Tris (hydroxymethyl)-aminomethane
UV Ultraviolet
Vis Visible
Wt Wild type
Latin abbreviations
c.a. circa, approximately
e.g. exempli gratia, for example
1
1. INTRODUCTION
1.1. Reactive oxygen species (ROS) and oxidative stress
1.1.1. Oxygen
Molecular oxygen (O2) is essential to all aerobic organisms but at the same time it can cause
serious cellular damage. O2 has a strong oxidizing potential, which makes this molecule very suitable
for accepting electrons in reduction-oxidation reactions (Bartz and Piantadosi, 2010). The complete reduction of O2 to water has a reduction potential of 0.815 V at pH 7.0 (Wood, 1988) (eq 1.1).
O2 + 4 H+ + 4 e- 2 H2O2 (eq 1.1)
Oxygen has two unpaired electrons with the same spin, what limits its reactivity due to spin restriction rules (Fridovich, 2013).
1.1.2. Reactive oxygen species
Reactive oxygen species are molecules derived from oxygen reduction that can cause serious cell damaging. The most common ROS in living organisms are superoxide anion (O2.), hydrogen peroxide
(H2O2), hydroxyl radical (HO.) and singlet oxygen (1O2) (Birben et al, 2012; Dröge, 2002).
These molecules can be free radicals on non-radicals with unstable bonds. In the first the high reactivity is due to the presence of unpaired electrons (Burton and Jauniaux, 2011).
Superoxide anion is formed by one electron reduction of oxygen (eq 1.2). It can react with another molecule of superoxide and form again oxygen and hydrogen peroxide in an autodismutation process (eq 1.3) (Jena, 2012).
O2 + 1e- O2.- (eq 1.2)
2O2.- + 2H+ O2 + H2O2 (eq 1.3)
Hydrogen peroxide can also be formed by the reduction of oxygen by two electrons (eq 1.4) or dimerization of two hydroxyl radicals (eq 1.5). In the case of hydrogen peroxide its reactivity is due to its low energy bonds when compared with O2 and O2.- (Brieger et al, 2012).
O2 + 2H+ + 2e- H2O2 (eq 1.4)
2HO. H
2O2 (eq 1.5)
The hydroxyl radical, the most dangerous ROS for in vivo systems, can be formed by reacting
superoxide and hydrogen peroxide, through the Haber-Weiss reaction (eq 1.6).
2
Singlet oxygen is very reactive and highly toxic in biological systems. This species corresponds to an excited form of molecular oxygen in which one of the electrons underwent a spin inversion, in an endothermic process (Fridovich, 2013). One of its sources is enzymatic reactions of photo-oxidation of biological compounds. Singlet oxygen reacts with DNA, particularly with guanine bases due to their lower redox potential (Agnez-Lima et al., 2012).
1.1.3. Sources of ROS in living organisms
ROS are produced by all living organisms as a result of the normal aerobic metabolism and can be produced by external agents, such as ionizing radiation and transition metal ions (Birben et al.,
2012).
The production of ROS assumes particular importance in organisms in which O2 is the final
electron acceptor in the respiratory chain due to the leakage of electrons from respiratory enzymes. These electrons can lead to one electron reduction of O2 and the subsequent formation of O2.-, the
most common radical in living organisms. The main source of hydrogen peroxide is the dismutation of O2.- by superoxide dismutase (SOD). This is readily converted to water by several enzymatic systems,
such as catalase and glutathione reductase. When these systems fail, H2O2 becomes available to
react with O2.- and yield the dangerous HO.. This radical has no known scavenger and reacts very
rapidly with biological molecules. Besides, H2O2 can diffuse freely through biological membranes and
cells have to cope with H2O2 produced in the outside of the cell (Brieger et al., 2012).
Singlet oxygen can be formed by photo-oxidation of molecular compounds or by enzymatic reactions.
1.1.4. Iron and ROS
Iron is essential for all organisms. The couple Fe2+/Fe3+ in biological systems has a redox potential that varies from -500 mV and +300 mV. This characteristic and its ability to exist in different redox states make iron a perfect co-factor for electron transfer reactions (van Vliet et al., 2002). Iron can
present oxidation numbers between -2 and +6, but in biological systems is only found Fe (II), Fe (III) and Fe (IV), respectively ferrous, ferric and ferryl forms (Cornelis and Andrews, 2010).
In biological systems iron is present in heme containing proteins and non-heme containing proteins, such as iron-sulfur proteins and non iron-sulfur proteins. These proteins have a wide diversity of functions, such as transcriptional regulation, electron transference, respiration or ROS detoxifying proteins (van Vliet et al., 2002).
In spite of its importance, iron can cause serious injury when allowed to remain free in the cell, for its reaction with oxygen is one of the sources of ROS in the cell. This is mainly due to the Fenton reaction (eq 1.7) In the presence of iron (II) hydrogen peroxide is reduced and HO. is formed. The
3 Fe2+ + H2O2 + H+ Fe3+ + HO. + H2O (eq 1.7)
Fe3+ + O2.- Fe2+ + O2 (eq 1.8)
To prevent these nefarious effects organisms have several proteins to capture free iron in a controlled way through sensor and regulatory systems. In more complex organisms this restriction is
per se a defence against microbial colonization, given that all (pathogenic) organisms need iron
(Holmes et al., 2005), a process called nutritional immunity (Damo et al., 2012). Also it is not
surprising that iron and oxidative stress response genes are regulated by common mechanisms.
1.1.5. Toxicity of H2O2
The toxic effects of ROS, especially H2O2, for the bacterial cells can be used for human benefit.
The immune system already takes advantage of ROS to kill invading pathogens and also to initiate the adaptive immune response. The great advantage of these substances is their non specific mode of action, thus they can be use against several bacteria (Linley et al., 2012). But these compounds can
also be use as disinfectant agents in industry or medical services. Its cellular targets are also very distinct. Hydrogen peroxide can react with co-factors from metallic proteins; can damage the DNA via Fenton reaction and lipids peroxidation which will lead to unstable cellular membranes (Finnegan et al., 2010).
1.1.6. ROS detoxifying systems
Antioxidants keep ROS levels balanced by competing with other oxidizing substrates (Droge, 2002). Antioxidants can be enzymes, such as superoxide dismutase, catalase, or glutathione peroxidase, or small molecules as glutathione, vitamin C and vitamin E (Birben et al., 2012).
When an organism reaches a state in which the amount of antioxidants and oxidative species is unbalanced favouring the later, we can say to have a situation of oxidative stress (Birben et al., 2012).
Superoxide dismutases are enzymes responsible by dismutation of superoxide anion to hydrogen peroxide and oxygen. They can be separated in three families depending on the co-factor utilized. FeSOD/MnSOD can utilize iron or manganese as co-factor; the Cu, Zn SOD family in which the protein uses an atom of copper as co-factor and a zinc atom as structural element; and finally a family of SOD that uses nickel as co-factor (NiSOD) (Aguirre and Culotta, 2012).
Peroxidases are the mainly responsible enzymes for H2O2 reduction, being catalase a specific
enzyme within this family. The first reduce hydrogen peroxide to water by oxidizing other substrates, while catalase catalyses the dismutation to water and oxygen (eq 1,9). This family includes gluthatione peroxidases and peroxiredoxins (Prx). Contrary to what is observed in many ROS destoxifying enzymes, Prx does not possess any metal co-factor. The reduction of hydrogen peroxide is performed by active cysteine residues and the resultant disulfide bond is reduced by thioredoxin (Rhee et al.,
2012).
4
1.2. Rubrerythrins
Rubrerythrins (Rbr) are non-heme iron containing proteins. The first rubrerythrin was identified in
Desulfovibrio vulgaris (Figure 1.1) (Legall et al., 1988), but other rubrerythrins were lately found in
organisms from all life domains, mainly anaerobic and microaerophilic ones (e.g. Pütz et al., 2005;
Wakagi, 2003). They belong to the ferritin-like super family mainly by their four-helix bundle domain (Andrews, 1998; Cooley et al., 2011).
Most rubrerythrins are composed by two domains: a diiron oxo-bridged centre incorporated in a four-helix bundle and a rubredoxin domain at the N-terminal which contains an iron atom coordinated by four cysteines. Rubrerythrins are usually purified as homodimeric proteins with a “head to tail”
arrangement (Coulter et al., 2000; Lumpio et al., 2001; Weinberg et al., 2004).
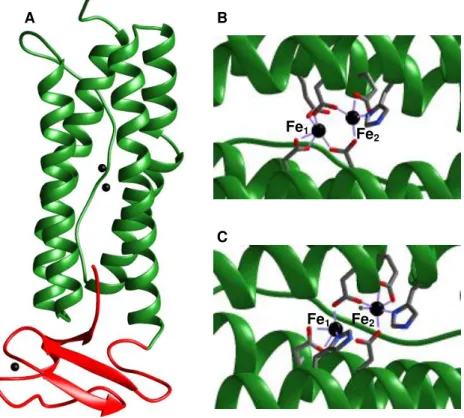
Figure 1.1: Structure of Desulfovibrio vulgaris rubrerythrin (PDB codes: A. 1RYT. B. 1LKM and C. 1LKO). The green area corresponds to the four-helix bundle domain and the red area is the rubredoxin domain. The iron atoms are represented in black. (A) Protein in a monomeric conformation. (B) Diiron centre all ferric. (C) Diiron centre all ferrous. Pictures created with Chimera.
1.2.1. Structural domains
The family of rubrerythrins is large and diverse due to the occurrence of several domains addition at the C and N-terminals (Figure 1.2).
A B
C
Fe1 Fe
2
5 Figure 1.2: Dendogram of proteins from the rubrerythrin family (Pinto, 2012).
The simplest rubrerythrin contains only the four helix-bundle domain, like simerythrin from
Cyanophora paradoxa or sulerythrin from the archeon Sulfolobus tokodaii (Cooley et al., 2011;
Wakagi, 2003). The four-helix bundle carries a diiron centre responsible for the catalytic activity of the protein. The iron ligands are two histidines, four carboxylates and one glutamate, depending upon its oxidation state. When oxidized the Fe1 is coordinated by four glutamate residues and Fe2 is
coordinated by three glutamates and one histidine. The two iron atoms are connected by two of the glutamate residues ligands and one molecule of solvent. In the reduced form the molecule of solvent disappears and each iron is coordinated by one histidine, three glutamates and one molecule of water (Figure 1.1) (Pinto, 2012).
6
Figure 1.3: Four-helix bundle of D. vulgaris rubrerythrin. Image coloured from blue (N-terminal) to red (C-terminal). PDB code: 1ryt. The helixes are designated by the letters (A-D). Picture created with Chimera.
The C-terminal of rubrerythrins usually has a rubredoxin domain. Rubredoxins are iron-sulfur proteins harbouring an iron atom coordinated by four cysteine residues (Bentrop et al., 2001).
Two types of rubredoxin proteins are so far described in literature. The difference between type I and type II rubredoxins is based on the distance between the cysteine ligands to the iron. Type I rubredoxins have a binding motif of the type CX2CXnCX2C and are the most common rubredoxins.
Type II rubredoxins have two extra residues between the first pair of cysteines. In rubrerythrins the rubredoxin like domain resembles a type I rubredoxin. Desulforedoxin is a rubrerythrin-like protein in which the amino acids between the first pair of cysteines are absent, that causes a distortion in the protein structure (Figure 1.4) (Archer et al., 1995).
Figure 1.4: Comparison between rubredoxin and desulforedoxin. (A) Three-dimensional structure of
Desulfovibrio vulgaris rubredoxin. Structure 1RB9 from PDB. (B) Three-dimensional structure of D. vulgaris
desulforedoxin. Structure 1DXG from PDB. Iron atoms are coloured in black. Figures created with Chimera.
1.2.2. Physiological activity
Considering the structural domains present in rubrerythrins it was initially thought that they can be involved in iron storage or in protection against oxidative stress. The diiron centre of rubrerythrins has a three-dimensional structure similar with that of ferritins and is able to oxidize ferrous iron (eq 1.10
A
B C D
7 and 1.11) (Coulter et al., 2000), however rubrerythrins do not form a hollow sphere that could store
iron.
Fe2+ + Rbrox Fe3+ + Rbrred (eq 1.10)
Rbrred + O2 Rbrox + [O2]red (eq 1.11)
To study the possible role ofrubrerythrin, Lumppio and collaborators transformed an Escherichia coli strain (QC774) deficient in sodA and sodB that requires supplementation of the minimal medium in
order to grow in aerobic conditions. This observed phenotype is probably due to the accumulation of superoxide anion and free iron. They transformed this strain with a plasmid coding for rubrerythrin and compared the growth rates of the non-transformed strain versus the transformed strain and found no
significant differences, excluding the hypothesis of this protein acting as a superoxide dismutase. On the other hand they also transformed an E. coli strain (NC202) deficient in katG and katE (genes that
encode catalase) and observed that the strain expressing the rubrerythrin had a higher survival rate when aerobically exposed to 2.5 mM H2O2 than that of the wild type strain. Similar results were obtain
for nigerythrin, a Rbr-like protein also identified in D. vulgaris, thus indicating a role in hydrogen
peroxide detoxification for these proteins (eq 1.12 and eq 1.13) (Lumpio et al., 2001).
NADH + Rbrox Rbrred + NAD+ + H+ (eq 1.12)
2 H+ + Rbr
red + H2O2 Rbrox + 2 H2O (eq 1.13)
In another work the authors studied the ability of wild type and mutant rubrerythrins from D. vulgaris to perform the referred functions attributed to rubrerythrins (peroxidase and ferroxidase). The
work was performed with wild type and rubrerythrin mutants. The results obtained for Rbr Y27F and hydrogen peroxide are of particular importance, given the subject under study in this work. Observing the results obtained for the wild type protein the NADH peroxidase activity (251 3.2 M min-1) seems
to be more likely to occur in vivo than the ferroxidase activity (2 0.3 M min-1). Furthermore, the
Y27F mutant showed only 30% of the wild type peroxidase activity, thus indicating the residue in position 27 as being important to this activity. (Coulter et al., 2000).
In Pseudomonas gingivalis W83 was detected the presence of a Rbr. Initial studies done by M.
Sztukowsaka and collaborators showed the impact of Rbr gene disruption. They showed an increase in Rbr gene transcription upon exposure to oxygen or hydrogen peroxide and also the P. gingivalis rbr
-mutant is more sensitive to oxygen and hydrogen peroxide (Sztukowsaka et al., 2002). Later, Mydel
and collaborators studied the importance of Rbr for P. gingivalis infection using a murine model.
Although they showed the importance of Rbr in P. gingivalis proliferation in vivo through protection
against reactive nitrogen species (RNS) (Mydel et al., 2006). Having in mind the previous results this
8
1.2.3. Desulforubrerythrin
Desulforubrerythrin (Figure 1.5) was identified in Campylobacter jejuni NCTC11168. After
exposing cells to H2O2, it was observed that a protein of approximately 27 kDa started to degrade.
After N-terminal sequencing it was identified as the product of the gene cj0012c (Yamasaki et al.,
2004).
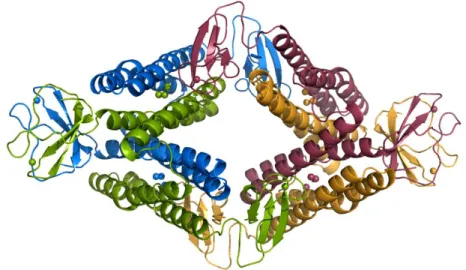
Figure 1.5: Desulforubrerythrin in a tetrameric conformation. Each monomer is represented with a different colour. (Unpublished data under refinement).
The sequence analysis of the protein revealed the presence of a desulforedoxin like domain at the N-terminal, wrongly labelled by the authors as rubredoxin oxidoreductase (Rbo) and a rubrerythrin like domain at the C-terminal, leading to the first designation of the protein: Rrc (Rbo/Rbr like protein from C. jejuni). Lately the domain at the N-terminal was identified as a desulforedoxin domain, leading
to the actual denomination of the protein: desulforubrerythrin - DRbr (Pinto et al., 2011). This similarity
with rubrerythrins leaded the authors to speculate about the protein function as being related with oxidative stress protection. Although the levels of protein decrease upon cells exposure to hydrogen peroxide, no significant alterations were detected in the mRNA levels (Yamasaki et al., 2004).
In case the protein is involved in hydrogen peroxide reduction its degradation at higher levels of its substrate may be an auto-regulation mechanism. It is clear that the protein needs to be reduced by some enzymatic system which in last instance should lead to NAD(P)H consumption. Thus, in elevated concentrations of hydrogen peroxide exists the serious possibility of depletion the cell of its reducing equivalents.
Lately, A.F. Pinto and collaborators showed that the protein has NADH-linked hydrogen peroxidase activity. They showed that the protein is able to reduce hydrogen peroxide to water in the presence of NADH, flavorubredoxin oxidoreductase and rubredoxin domain of flavorubredoxin, both from Escherichia coli (Pinto et al., 2011). The same work also showed that the protein is isolated as a
tetramer and has an isoelectric point of 5.37.
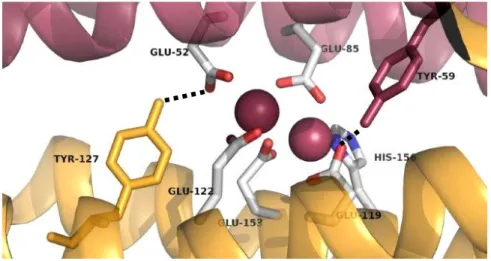
9 in rubrerythrins and are hydrogen bounded to iron ligands (Figure 1.6). Besides, tyrosines surrounding diiron centres are known for being important in dissipation of oxidizing species such as Fe (IV) by formation of a tyrosil radical (Pinto, 2012). The residues were replaced by a phenylalanine, a structuraly similar amino acid but lacking the hydroxyl group. This difference should be enough to induce changes in protein activity (in case the residues are important for its activity) but should not be enough to change the three-dimensional structure around the catalytic centre.
The work here presented was based in expression, purification and characterization of the mutant proteins having as reference the wild type protein.
Figure 1.6: Depiction of the diiron centre evidencing its surrounding tyrosines. Iron atoms are represented in red; tyrosine 59 is represented in red; tyrosine 127 is represented in yellow. The dashed black lines represent hydrogen bonds between the tyrosines and glutamates. (Unpublished data under refinement).
1.3. Campylobacter jejuni: an overview
Campylobacter jejuni is a microaerophilic Gram-negative bacterium. It belongs to the delta-epsilon
class of proteobacteria (Figure 1.7) and is a flagellate spiral bacterium (Figure 1.8). This species is the main cause of foodborne gastroenteritis in the world. The infection is acquired by consumption of contaminated meat, especially poultry. In developing countries contaminated water can also be a source of infection. The symptoms include fever, abdominal pain and diarrhoea (Dasti et al., 2010;
Young at al., 2007). The disease can cause different symptoms apparently depending on the
socio-economic level of the country. In developed countries the infection causes bloody diarrhoea with mucus while in developing countries the infection is more common in children and causes watery diarrhoea (Young et al., 2007). This could be due to the fact that in developing countries people are
exposed to the pathogen at early stages of life and this could confer a certain immunity against subsequent infections. In any case the infection in self-limiting, but in more severe cases antibiotic therapy may be required, generally erythromycin but also quinolones. Initially erythromycin was the chosen antibiotic to treat campylobacteriosis, being replaced nowadays by fluroquinolones. Although initially these drugs were efficient in treating the infection, soon cases o antibiotic resistance started to emerge due to the indiscriminate use of antibiotics in animals (Engberg et al., 2001), making urgent
10
11 The infection can cause serious sequelae, such as reactive arthritis and Guillian-Barre syndrome (GBS), a muscular neuropathy (Altekruse et al., 1999; Kassem et al., 2012; Young et al, 2007). The
GBS seems to be an auto-immune response to the infection to the lipooligosacharides (LOS) of C. jejuni that are similar to human gangliosides. This results in temporary paralysis of the peripheral
nerves and more rarely it can lead to death (Bingham-Ramos and Hendrixson, 2008; Kaakoush et al.,
2007).
Figure 1.8: Campylobacter jejuni scanning microscopy image (Altekruse et al.,1999)
The genome of C. jejuni NCTC11168 has 164 148 base pairs, from which 94.3% encodes proteins
making it one of the densest genomes sequenced. The analysis of the genome revealed homopolymeric tracts with great variability, probably coding for LOS, flagellar systems or other extracellular components (Parkhill et al, 2000). This diversity in extracellular surface structures may be
one way to escape the immune system.
C. jejuni requires low O2 concentrations (5-10%) and 5-10% of carbon dioxide to grow, which
makes this microorganism microaerophilic and capnophilic, respectively. Its optimum growth temperature is 42ºC, just the same temperature of the chicken gut: its commensal host. In vitro growth
of this microorganism requires media supplemented with blood or fetal bovine serum (Atack and Kelly, 2009). This makes one wonder how C. jejuni survives in the environment while travelling between
hosts (see section 3.1).
Campylobacter members have a full tricarboxylic acid cycle (TCA) but are unable to utilize
carbohydrates as energy source; they rely on intermediates of the TCA cycle (Brenner et al., 2005). C. jejuni possesses a highly branched respiratory chain allowing the organism the use of a wide
range of substrates, including formate, malate, succinate and lactate, amongst others (Hoffman and Goodman, 1982; Kassem et al., 2012).
1.3.1. C. jejuni, oxidative stress and iron
Although C. jejuni requires specific conditions for optimal growth it has the ability to colonize
different hosts and to survive in different environments, where may face different type of stresses: nutrients depletion (namely iron), atmospheric concentrations of O2, ROS produced by the host,
amongst others. To be able to survive these stressful conditions C. jejuni needs oxygen consuming
12
The respiratory chain of C. jejuni possesses a cbb3 type oxygen reductase and a bd-type quinol: O2 oxidoreductase, which are important for O2 consumption (Smith et al., 2000).
C. jejuni is a catalase-positive organism. Its genome analysis shows the presence of only one
catalase coding gene named katA. W. A. Day and collaborators showed that a C. jejuni catalase
deficient strain loses its viability after 15 minutes exposure to H2O2, while the wild type bacteria
maintains a viability of approximately 60% after 1 hour in the same conditions. They also showed that the wild type strain could survive upon uptake by murine and porcine macrophages, while the mutant bacteria were not able to recover. Moreover, in macrophages treated with an oxidative burst inhibitor no differences were detected between the wild type and catalase deficient strains. Altogether these results show the importance of catalase in H2O2 resistance for C. jejuni (Day et al., 2000).
The superoxide dismutation is performed by an iron superoxide dismutase (Fe-SOD). A mutant strain lacking the sodB gene was less able to survive inside human embryonic intestinal cells when
compared with the wild type strain (Pesci et al., 1994).
Proteins belonging to the family of peroxiredoxins were also identified in C. jejuni. These are alkyl
hydroperoxide reductase (AhpC), thiol peroxidase (Tpx) and bacteoferritin comigratory protein (Bcp). The AhpC protein was showed to increase the aerotolerance under normal atmospheric conditions of
C. jejuni but showed no detected effects in H2O2 resistance (Baillon et al., 1999). Studies with Tpx and
Bcp suggest that these two proteins may have a redundant role by comparing the phenotype of a wild type C. jejuni strain with tpx and bcp single mutants and with a double mutant. When growing the
strains microaerobically the single mutants showed growth profiles very similar with the wild type strain. The double mutant reached the same cellular density than the wild type strain, but took more than twice as long. This was also verified when the cells were exposed to 1 or 2 mM of H2O2. The
same study shows that Tpx and Bcp have substrate specificity. Both enzymes can reduce H2O2 in the
presence of thioredoxin, thioredoxin reductase and NADH but only Bcp was able to reduce cumene hydroperoxide and tert-butyl-hydroperoxide, common artificial substrates to measure peroxidase activity (Atack et al., 2008).
C. jejuni also contains a DNA binding protein from starved cells (Dps). Dps are DNA binding
proteins, that also bind iron, thus preventing the production of HO. (Miyamoto, et al., 2011). It was
observed that the Dps confers H2O2 resistance by binding iron in the cell, because bacteria lacking the
Dps showed the same H2O2 resistance than the wild type bacteria when an iron chelator was added to
the growth medium (Ishikawa et al., 2003). Just recently was shown that the C. jejuni Dps has DNA
binding ability in the presence of H2O2 and Fe2+, thus protecting DNA from the nefarious effects of
H2O2 (Huergo et al. 2013).
A truncated globin (Ctb) was identified in C. jejuni as important to bacteria survival even under
microaerophilic conditions, the ctb mutant showed a slower growth when compared with the wild type
protein (Wainwrigh et al., 2005).
Although C. jeujuni seems to be lacking siderophores (iron chelators exported by microorganisms
(Pi et al., 2012)) it is able to use siderophores from other bacteria present in the bowel and iron is then
transported to the cell by a ferric-enterobactin (CfrA). Furthermore, C.jejuni is able to use the heme
13 All these ROS detoxifying systems need to be tightly regulated. Contrarily to other bacteria C. jejuni lacks the regulators OxyR and SoxR, respectively involved in hydrogen peroxide and superoxide
sensing. Instead, this bacterium possesses the PerR protein, usually found in Gram-positive bacteria, which is an hydrogen peroxide regulator (Butcher et al., 2010) The iron uptake also needs to be
carefully controlled since it is involved in the generation of the dangerous hydroxyl radical. This is regulated by the ferric uptake regulator (Fur), a member of the PerR family. Fur is a repressor that in the presence of ferrous iron Fur binds itself to the promoter of iron uptake genes and inhibits their transcription (Palyada et al., 2004). Fur also represses genes involved in ROS detoxifications (katA, ahpC) (Table 1.1) (Butcher et al., 2010). This last result seems contradictory given that iron is tightly
connected to the formation and elimination of ROS via the Fenton reaction and by its role in detoxifying enzymes, respectively. So under iron rich conditions an over expression in iron-containing proteins would be expected to avoid the dangers of free iron in the cell.
PerR works by inhibiting the transcription of genes involved in oxidative stress response. Its own expression is iron-dependent but not H2O2 dependent and is auto regulated by binding to the perR
promoter (Kim, et al., 2011). In the absence of iron Apo-PerR is unable to bind to the promoter region
in the DNA resulting in induction of oxidative stress resistance genes, even in the absence of ROS (Butcher et al., 2010)
The implication of PerR in H2O2 resistance is corroborated by studies where a strain lacking perR
is more resistant to H2O2, due to continuous transcription of katA and ahpC (Palyada et al., 2009).
Due to the close relation between iron and oxidative stress several genes are co-repressed by PerR and Fur (Figure 1.9).
In a fur mutant cj0012c transcription is activated under iron rich conditions and is repressed in the
absence of iron. In the wild type strain its transcription is also decreased when iron is not available (Butcher et al., 2012; Holmes et al., 2005). Furthermore cj0012c is also repressed by PerR (Palyada et al., 2009), which is in agreement with the results shown by Yamazaki et al. that observed
14
Figure 1.9: Simplified representation of oxidative stress regulation in Campylobacter jejuni. Anti-oxidant systems are in blue coloured boxes; oxidants species are coloured in red; Fur is coloured in the green box; Per-R is in the yellow coloured box. Full trace lines represent primary repression and dashed lines represent secondary repression. Adapted from Palyada et al., 2009.
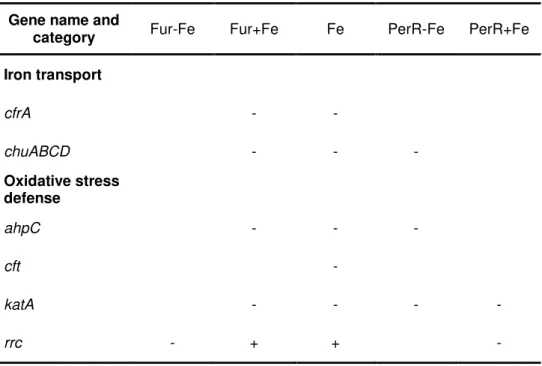
Table 1.1: Example of genes up and down regulated by Fur, PerR and iron. The signals
“-” and “+” stand for repression or activation, respectively. Adapted from Butcher et al., 2010.
Gene name and
category Fur-Fe Fur+Fe Fe PerR-Fe PerR+Fe
Iron transport
cfrA - -
chuABCD - - -
Oxidative stress defense
ahpC - - -
cft -
katA - - - -
rrc - + + -
1.3.2. Pathogenesis mechanisms
Approximately 90% of the campylobacteriosis cases are due to Campylobacter jejuni and the
other cases are almost entirely attributed to Campylobacter coli.
ChuABCD PerR-Oxi PerR-Fe Fur-Fe CfrA SodB Fe2+ Heme [4Fe-4S] KatA AhpC
H2O2
H2O2
Fe2+ Fe2+
H2O2
O2
.-Fe2+
ROOH ROOH
Fe3+ +OH-+ RO.
Fe3+ +OH-+ HO.
ROH + H2O
15 Based on the symptoms two disease mechanisms are hypothesised: adherence of the bacteria to the intestine and production of toxins or invasion and replication inside the host cells which will initiate an inflammatory disease. In the first case the symptoms include watery diarrhea, while in the second bloody diarrhea (Janssen et al., 2008).
Colonization of the host occurs in the small bowel and in the colon (Altekruse et al.,1999). The
first barrier that the bacteria should overcome is the acidic environment of the stomach, followed by the barrier of the gastrointestinal tract, namely the mucus layer. The bacteria overpass the mucus layer thanks to their corkscrew shape, motility and chemotaxis (Altekruse et al., 1999; Young et al.,
2007; Kassem et al., 2012). To fulfil the colonization process the bacteria must adhere to the epithelial
cells through membrane proteins. Several proteins are involved in cell adherence: CadF, CapA, PEB1 and JlpA (Dasti et al., 2010). CadF is also required for cell invasion in a fibronectin dependent way.
Mutants in CadF and JlpA have shown impaired ability to invade several cell lines in vitro and are also
less prone to colonize chicken gut (Dasti et al., 2010; Young et al., 2007).
More than being involved in motility the flagella also seem to be important for cell invasion and toxicity. The flagellar filament is composed by two proteins: FlaA and FlaB. Deletion studies in a human clinical strain showed that deletion of flaA results in impaired motility and invasion, but the
adherence ability of the bacteria was enhanced. The double mutant in flaA and flab showed even a
greater adherence improvement but the invasion was poorer than in the flaA mutant. (Konkel et al.,
2004).
The secretion mechanisms are not yet clear, but no type III secretion system was identified. It is believed that secretion is dependent on the flagellar machinery due to homology of secreted proteins with flagellins. These secreted proteins are named Campylobacter invasion antigens (Cia) and their
functions are still unknown. The secretion pathway via flagellum is corroborated by mutagenesis studies. In the mutant flaAflaB no secretion of this CiaB was detected although the protein was
expressed (Konkel et al., 2004). This highlights the importance of the flagellar apparatus in secretion
and consequently on the disease.
The only toxin identified so far in C. jejuni is the cytolethal distending toxin (CDT) which is also
found in other species in the same genus and in Escherichia coli. CDT is a holotoxin composed of
smaller proteins: CdtA, CdtB and CdtC. This toxin arrests the cellular cycle at G2 phase and causes cell distension. CdtB is responsible for the protein activity, while CdtA and CdtC probably play a role in the uptake by the host cells but there is no evidence if these subunits enter the cell or not. The sequence of the CdtB subunit showed similarity with DNase-I like proteins, and CdtB was showed to have DNase activity in plasmidic DNA (Ohara et al., 2004).
The mechanism by which CDT is exported from the bacterial cell is unknown but one study suggests that outer membrane vesicles (OMV) may be a vehicle for toxin export (Lindmark et al.,
2009). CdtB is probably translocated to the nucleus of the host cell via via retrogade transport (Young
16
1.4. Campylobacter jejuni, ROS and the immune system response
The role of ROS in the immune system concerns both the innate and acquired immunity. After ingestion of microorganisms by
phagocytic cells a “respiratory burst” takes place
inside the phagolysosome. This process starts with the production of O2.-by the NADPH oxidase
enzyme present in the phagossome membrane (NOX2) that transfers electrons from NADPH to two O2. As seen in section 1.1, O2.- production will
lead to production of several oxidant molecules, namely H2O2 and HO.. The hydrogen peroxide can
also be converted in hypoclorous acid, a strong oxidant, by mieloperoxidase or eosinophil peroxidase (Winterbourn, 2008) (Figure 1.10). These molecules will hopefully cause serious damage in the pathogenic bacteria. The importance of NOX is corroborated by a reduced resistance to infections in mice lacking NOX subunits (Alfadda and Sallam, 2012;, Droge, 2002). Besides, NOX1 is present at the cellular membrane and transfers electrons to O2 present
at the outside of the cell (Winterbourn, 2008), allowing to fight bacteria that resist phagocitosis.
The role of ROS goes beyond this non-selective response. The production of ROS at the infection local decreases the threshold activation of T -lymphocytes due to amplification in signalling cascades (Figure 1.11) (Kaakoush et al., 2007).
Figure 1.11: Importance of ROS in the immune system. ROS production by activated macrophages is a non-specific defence against invading pathogens. ROS also play an important role in activation of T-lymphocytes along with pathogen determinants presented by Major Complex of Histocompatibility (MHC) molecules. (Adapted from Droge, 2002)
AR
Activated
macrophage MHC Antigenic Peptide
Pathogen T-Lymphocyte ROS Pathogen Pathogen Pathogen + First line of defense Proliferation and differentiation of effector cells Figure 1.10: NOX role in generation of ROS in phagosomes. NOX generates O2-. that dismutes into
H2O2. Myeloperoxidase converts hydrogen peroxide
17 After interaction of C. jejuni with epithelial cells cytokine production is induced, namely IL-8. IL-8
secretion leads to recruitment of dendritic cells (DCs), macrophages and neutrophils (Zheng et al.,
2008).
Dendritic cells (DC) seem to play a fundamental role in the immune response to C. jejuni
activation. Based on in vitro results C. jejuni is rapidly internalized by DC promoting the DCs
maturation verified by expression of coestimulatory molecules (CD40, CD80 and CD86) (Hu et al.,
2006). In the same study production of cytokines by infected DC was also observed, especially IL-8 and TNF- (Tumor Necrosis Factor ) as well NF-B (Nuclear Factor-B) activation. The activation of DCs is extremely important to stimulate naive T cells through antigen presenting. The same study also points LOS as one important feature in cytokine production (Young et al., 2007).
The production of IL-8 by epithelial cells seems to be dependent of the flagellum and the CDT given that mutants in one of these features are less efficient in promoting IL-8 secretion. Furthermore this secretion also seems to be dependent of NF-B activation (Figure 1.12) (Zheng et al., 2008).
Figure 1.12: Representative scheme of pathological inflammation. This response of the immune system is
19
2. MATERIALS AND METHODS
Unless stated otherwise all procedures were performed with wild type and DRbr mutants.
2.1 Strains and resistances
Competent Escherichia coli strain BL21DE3GOLD cells were used to over express the proteins
under study. In the expression assays BL21DE3 and STAR strains from E. coli were also used.
2.2 Gene cloning
The pMAL system from New England Biolabs was used for cloning the gene cj0012c from C. jejuni NTTC11168 with and without the desired mutations. The clone for the wild type protein was
provided by Yamazaki M.1,2, Amano F.2 and Ignimi S3.
The clones for the mutant proteins were done by Pinto, A. using the Quick Change Multi-Site Directed Mutagenesis Kit from Agilent Technologies. The residues chosen for mutation were tyrosines 59 and 127. In two mutants one of the residues was replaced by a phenylalanine and in a third both tyrosines were replaced, also by two phenylalanines.
2.3 Cells transformation
Competent E. coli BL21DE3 GOLD cells were transformed with plasmids containing the gene for
the wild type or mutant proteins. To 100 L of competent cells were added 2 L of plasmid at c.a. 83
ng/L. The mixture was incubated in ice for 30 minutes. Afterwards cells were heated at 42ºC during 20 seconds and then immediately put in ice for 2 more minutes. To the cells were added 900 L of lysogeny broth (LB) medium (Table 2.1) and the mixture was incubated for 1 hour at 37ºC with shaking. Cells were harvested by centrifugation and resuspended in 100 L of supernant before plating in LB agar (LA) medium (Table 2.1) supplemented with 100 g/mL ampicilin. The plates were incubated at 37ºC overnight.
Table 2.1: Instructions for LB and LA media preparation.
Components LB medium (Adjust pH to 7.0) LA medium
Tryptone 10 % (w/v) 10 % (w/v)
Yeast extract 10 % (w/v) 5 % (w/v)
NaCl 10 % (w/v) 10 % (w/v)
Agar - 5% (w/v)
1 Faculty of Agriculture, Tokyo University of Agriculture and Technology, Japan
20
2.4 Protein expression tests for DRbr mutants
A few colonies from the LA plates were used to inoculate 25 mL of LB medium with 100 g/mL ampicilin. Cells were grown at 37ºC until the optical density (OD) at 600 nm reached 0.6. Then 250 M of isopropyl-1-thio--D-galactopyranoside (IPTG) was added. After 4 hours cells were harvested by centrifugation at 5000 g during 10 minutes at 4ºC. Two samples were analyzed, corresponding to the cells before and after induction. Both samples were disrupted by freezing/thawing cycles with liquid nitrogen. The levels of protein in the soluble fraction were evaluated by sodium dodecyl sulfate polyacrylamide gel electrophoresis (SDS-PAGE).
2.5 Expression of the recombinant DRbr and DRbr mutants
A pre-inoculum of 100 mL with 100 g/mL of ampicilin was prepared overnight at 37ºC, from fresh colonies (prepared plate).
Over-expression of DRbr and mutants was achieved by growing the cells aerobically at 37ºC in M9 minimal medium supplemented with 20 mM glucose, 400 M FeSO4 and 100 g/mL ampicilin. The
medium was inoculated with 1% from the pre-inoculum. At OD600 of 0.3 it was added 250 M IPTG.
Cells were grown overnight and then the cells were harvested by centrifugation at 7000 g during 10 minutes and 4ºC and then stored at -20ºC.
Minimal medium M9 was prepared accordingly the following instructions: for 1 litre of medium 5 times concentrated the following quantities were dissolved in deionized water: 64 g of Na2HPO4.7H2O,
15 g of KH2PO4, 2.5 g of NaCl and 5 g of NH4Cl.
2.6 Recombinant proteins purification
The purification process was performed in anaerobic conditions in a Coy glove box under an atmosphere of approximately 95% argon and 5% hydrogen at room temperature. All buffers were previously degassed and the atmosphere was replaced with nitrogen, prior to their introduction in the glove box
The cells were unfrozen and washed in a buffer containing 10 mM Tris-HCl H 7.2 for three times, then were harvested by centrifugation and resuspended in a buffer containing 50 mM Tris HCl pH 8, 100 mM NaCl, 1 mM MgCl2, 0.1 mg/mL lysozyme and 20 g/mL DNase I. The cellular extract
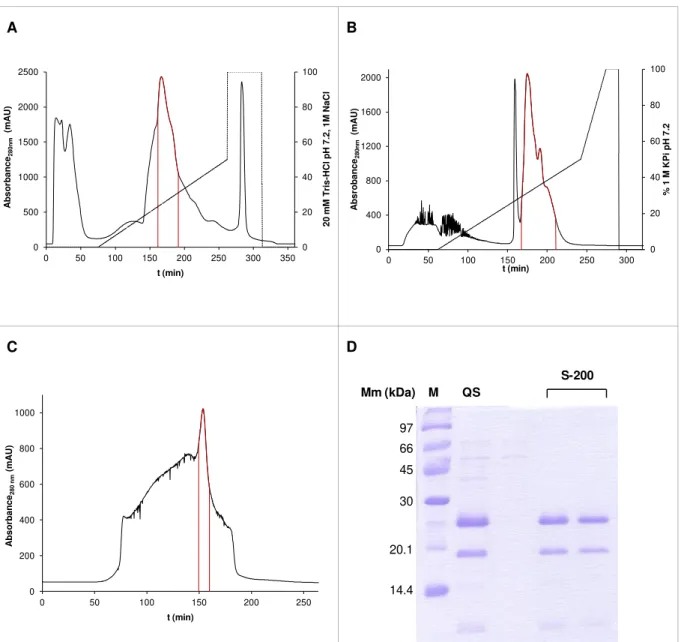
21 linear gradient from 10 mM to 1M of KPi pH 7.2. Fractions containing the protein were collected at approximately 0.3 M of KPi pH 7.2 and concentrated to a maximum volume of 2 mL in a Diaflo (Amicon) using a YM30 membrane. Finally the protein was applied to a Superdex-200 (XK 16/170, GE Healthcare) column equilibrated with 20 mM Tris-HCl pH 7.2 and 150 mM NaCl and eluted with the same buffer. The final fraction was concentrated using a Diaflo (Amicon) and stored at -20ºC in anaerobic conditions.
The purity of the final fractions was accessed by 15% SDS-PAGE.
2.7 Electrophoretic analysis
All SDS-PAGE analysis were performed in a 15 % gel with 1 mm thickness. The solution components and volumes are listed in Table 2.2
Table 2.2: Instructions for preparation of SDS-PAGE gels. Components and volumes for preparing one resolving 15% SDS-PAGE gel and one stacking 5% SDS-PAGE gel.
Solution components Stacking gel (mL) Resolving gel (mL)
30% Acrylamide mix 0.67 5
1.5 M Tris-HCl pH 8.8 - 2.5
1 M Tris-HCl pH 6.8 500 -
Deionised Water 2.7 2.3
10% SDS 0.04 0.1
10% Ammonium persulfate (APS) 0.04 0.1
N, N, N', N'-tetramethylethylenediamine
(TEMED) 0.004 0.004
The electrophoresis were performed with a BioRad MiniProtean system and a power supply from Amershan Biosciences at 180 V during approximately one hour. The running buffer contained 0.6 % (w/v) Tris-(hydroxymethyl) aminomethane (Tris), 4 % (w/v) glycine and 0.2 % (w/v) SDS. The pH was adjusted to 8.3 with HCl.
The molecular weight of the samples was inferred from the low molecular mass markers from GE Healthcare.
Sample visualization was achieved by staining the gel in a solution containing 0.1% Coomassie G, 50% methanol and 10 % acetic acid for approximately 30 minutes. Next the gel was submersed in a destaining solution with 40 % acetic acid and 10 % methanol for 30 minutes. The gels were left in water overnight.
22
Induced versus non-induced cells: 1 mL of culture media before and after induction was centrifuged to
collect the cells. Next, 30 µL of Loading Buffer with urea (Table 2.3Table 2.4) was added to resuspend the pellet and the mixture was heated at 100 ºC during 5 minutes. Finally the mixture was centrifuged for 2 minutes at 14 000 g and 15 µL of the supernatant were applied in the gel.
Soluble versus non-soluble fraction: 2 mL of culture media was collected after finishing the protein
expression tests or the growths and centrifuged to collect the cells. Cells were lysed by adding 500 µL of lysis buffer (Table 2.4) and by doing freezing/ thawing cycles with liquid nitrogen. The mixture was centrifuged and the supernatant was collect and once more centrifuged. The supernatant and the pellet were both collected corresponding to the soluble and non-soluble fractions respectively; to both were added 30 µL of Loading Buffer with urea and applied in the gel after heating at 100 ºC for 5 minutes and centrifuged at 14 000 g.
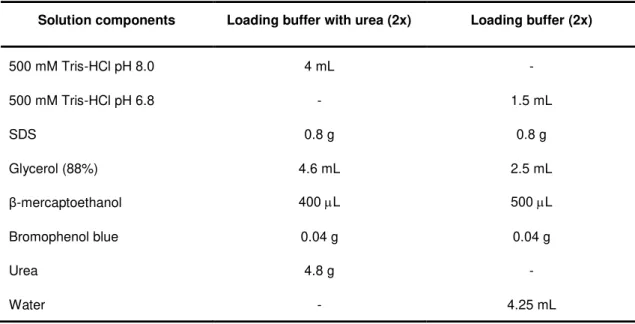
Table 2.3: Solution components for preparing loading buffer with and without urea.
Solution components Loading buffer with urea (2x) Loading buffer (2x)
500 mM Tris-HCl pH 8.0 4 mL -
500 mM Tris-HCl pH 6.8 - 1.5 mL
SDS 0.8 g 0.8 g
Glycerol (88%) 4.6 mL 2.5 mL
β-mercaptoethanol 400 L 500 L
Bromophenol blue 0.04 g 0.04 g
Urea 4.8 g -
Water - 4.25 mL
Table 2.4: Components and respective concentrations of the lysis buffer.
Lysis buffer
50 mM Tris-HCl pH 8.0
20 % (w/v) sucrose
100 mM NaCl
1mM MgCl2
0.1 mg/mL lysozyme
23 Protein samples: To 15 µL of sample 15 µL of Loading Buffer were added (Table 2.3). The mixture was heated at 100º C during 5 minutes, centrifuged at 14 000 g and applied in the gel.
2.8 Determination of protein and iron concentration
Protein concentration was determined using the bicinchoninic acid (BCA) (Pierce) method and the iron content was assayed using 2, 4, 6-tripyridyl - 1, 2, 3-triazine (TPTZ) method and by Inductevily Coupled Plasma Atomic Emission spectroscopy (ICP). The zinc content was also determined by ICP. The ICP was performed at REQUIMTE Analysis Laboratory at Faculdade de Ciências e Tecnologia da Universidade Nova de Lisboa.
For the BCA method were prepared 8 tubes with BSA (Bovine Serum Albumin) concentrations between 0 and 1 mg/mL, plus the samples tubes. To each tube was added 1 mL of BCA solution previously prepared by mixing 50 parts of reagent A (Bicinchonic acid and tartrate in an alkaline carbonate buffer) with one part of reagent B (4% copper sulfate pentahydrate). This method is based in the chelation of Cu1+ with protein in an alkaline buffer, the biuret reaction, which forms a light blue
complex. The second step is the reaction of the BCA reagent with the Cu1+ to yield a purple product, which increases the sensitivity of the method 100 times when compared with the traditional biuredtmethod. After 30 minutes incubation on the dark the absorbance at 562 nm was registered. The calibration and the samples were prepared in triplicates.
For the TPTZ method a calibration was performed by preparing tubes with iron concentrations between 0 and 25 M. The tubes with the samples were also prepared by diluting a small amount (5 L) with water. To all tubes was added 100 L of 8 M HCl followed by mixing in the vortex to remove the iron from the protein. Next, 100 L of a solution of TCA (Trichloroacetic acid) 80% was added to precipitate the protein and the mixture was again homogenised in the vortex. The standards and the samples were centrifuged during 10 minutes at 14 000 g and 800 L of supernatant were transferred to a new vial. To each tube was added 200 L of 75% of ammonium acetate to set the pH around 4.5 and 80 L of 10% ammonium hydroxide which reduces the iron to ferrous. The solutions were mixed and finally 80 L of 4 mM of TPTZ was added. After incubation for 10 minutes in the dark, the absorbance was measured at 593 nm (Fischer and Price, 1964).
2.9 Molecular mass determination
24
2.10 N-terminal sequencing
All solutions used in the protocol for N-terminal sequencing were prepared with ultra pure MiliQ water except TEMED.
To perform the N-terminal sequencing a sample of protein was applied in 15% SDS - acrylamide gel. The running buffer was prepared with 1.5 % (w/v) Tris, 7.2 % (w/v) glycine, 25 mL 0.5 % (w/v) SDS and the pH was set to 8.3. All solutions were prepared following the instructions in section 2.7.
A pre-run with 40 M glutathione added in the cathode was performed at 100 V during 2 hours. Subsequently the buffer inside the cathode was removed and new buffer was added, alongside 6 µL of thioglycolic acid. The sample was applied and the run was performed at 150 V during approximately one and a half hour. The run was tracked by the addition of molecular mass marker pre-coloured from Bio-Rad.
The transference to a PVDF membrane with 0.2 m pore was performed using a Trans-Blot SD semi-dry transfer cell at 15 Volts for 20 minutes at room temperature. The transference buffer was 1 x CAPS (Cyclohexylamino propanesulphonic acid) (w/v) and 10 % methanol (v/v). Before the transference the membrane was activated in 100 % methanol for 15 seconds followed by washing with water for 5 minutes and finally was submersed in transference buffer. The gel and the filter paper were also submersed in transference buffer immediately before the assembly of the system.
To visualize the bands corresponding to the samples the membrane was submersed in a solution of Coomassie R followed by alternate washing with water and a solution of 50 % methanol.
The sequencing was performed at the Analytical Laboratory, Analytical Services Unit, Instituto de Tecnologia Química e Biológica, Universidade Nova de Lisboa.
2.11 Spectroscopies
UV-Vis spectra, as well all spectrophotometric data, were collected with a Shimadzu UV-1603 or Shimadzu UV-1700 spectrophotometers.
EPR spectra were acquired with a Bruker EMX spectrometer, equipped with an ESR 900 continuous-flow helium cryostat from Oxford Instruments.
2.12 Redox titrations
Redox titrations were analysed by EPR spectroscopy and performed under argon at room temperature. At appropriate potentials a sample was collected into an EPR tube and immediately frozen in liquid nitrogen. The assays were performed in 50 mM Tris-HCl pH 7.2 by stepwise addition of sodium dithionite as a reducing agent. The protein final concentration was 80 M as well the following redox mediators: potassium ferricyanide (E’0 = +430 mV), N,N dimethyl-pphenylenediamine (E’0 =
+340 mV), tetramethyl-p-phenylenediamine (E’0 = +260 mV), 1,2-naphtoquinone-4-sulphonic acid (E’0
= +215 mV), 1,2-naphtoquinone (E’0 = +180 mV), trimethylhydroquinone (E’0 = +115mV), 1,4
-naphtoquinone (E’0 = +60 mV), menadione (E’0 = 0 mV), plumbagin (E’0 = -40 mV), indigo