2009 / 2010
João Pedro Ribeiro Miranda
21560 João Pedro Ribeiro Miranda
Siemens S.A.
Dissertation submitted in
Faculdade de Ciências e
Tecnologia
of
Universidade Nova de Lisboa
for the
degree of Master in Biomedical Engineering
Outubro de 2010
João Pedro Ribeiro Miranda v I dedicate this thesis to my parents:
João Pedro Ribeiro Miranda vii Throughout the last five years that culminate in this thesis, several people have crossed my way and have marked my personal and professional evolution. I take this opportunity to acknowledge their influence.
I would like to start by thanking SIEMENS and Eng. Filipe Janela for the opportunity of developing my work in this environment. It has truly been a great challenge and has made me develop a large amount of skills.
I also acknowledge my other supervisor Prof.ª Carla Quintão. More than the scientific advice given, which were crucial, the support and experience shared throughout all the stages of my thesis were of great importance for me to reach this goal. I am deeply thankful.
I am also thankful to Dr. Pedro Vilela and Prof.ª Patrícia Figueiredo for suggesting this study and for all the orientation provided.
At SIEMENS I would also like to thank Dr.ª Celina Lourenço for all help and constant care provided along this internship. Your reviews have also been of great importance to my work.
I also acknowledge Eng. Inês Sousa for all the scientific advice and for introducing me to this area of studies. Your teachings, especially on the early stages of my work, were of high importance.
I also wish to thank Eng. Marco Pimentel, for the help and orientation provided in a crucial stage of my study.
An acknowlegdement word goes to my MSc. colleagues here at SIEMENS, especially to Catarina Barros and Patrícia Silva, who made this experience more bearable.
An additional word to acknowledge Eng. João Amaro, for constant care an experience shared and to Eng. Carlos Caldeira for the fine conversations.
At FCT I would like to thank my friends Carlos, André, Nuno, Francisco, Cláudio, Joana and Ana Sofia. These last years have been filled with moments I will never forget. Thank you!
Functional Studies on Magnetic Resonance
João Pedro Ribeiro Miranda viii
I thank my family, for all the support, especially my grandmothers Maria José and Helena who always have a supportive word.
I thank my “little” sister Ana, for always being by my side. In many ways, you are already an example to me.
I gratefully acknowledge all the support given by my girlfriend Ana. Everything you have done throughout this thesis has made this work possible. Simple words written here would never make justice to what you mean to me. Throughout all these pages I may find a little piece of you. Thank you!
João Pedro Ribeiro Miranda ix Functional Studies on Magnetic Resonance
Magnetic Resonance Imaging (MRI) is an imaging technique used primarily to produce high quality structural and functional images of the human body. Functional MRI techniques, among which are included the Arterial Spin Labeling (ASL) and the Blood Oxygenation LevelGDependent (BOLD), are used to measure brain activity. Several studies have shown that ASL holds several advantages when compared with BOLD, namely the fact of being more reproducible and perfusion quantitative.
The main aim of this work is to obtain perfusion quantification of the human brain within several of its territories and to compare the results obtained using two different ASL protocols. Secondarily this study aimed to validate an ASL protocol to be used in clinical exams – Protocol #2 by comparing the values obtained for all the regions considered with the ones present in literature.
The methodology used in this study was applied to fifteen adult volunteers. Two ASL protocols were used in a single functional imaging session. Subjects were asked to perform a motor finger tapping task with their right hand while being scanned. Images were acquired on a 3 Tesla equipment – Magnetom Verio MRI System from SIEMENS in Hospital da Luz. For the definition of the regions to study the Talairach
anatomical atlas was used and the brain was segmented considering five different segmentation levels.
Perfusion quantification studies have demonstrated that ASL allows a correct calculation of Cerebral Blood Flow (CBF), especially when compared to other studies which used other invasive perfusion measuring techniques. The perfusion values obtained for several regions considered are in agreement with the ones available in literature.
ASL protocols are now becoming commercially available and have been demonstrating coherent results with other techniques already established. The current study presents one of the first detailed perfusion studies using this technique to evaluate several structures of the brain. The adequacy of Protocol 2 for functional studies was also proved considering the stimulus used.
! " # Functional Magnetic Resonance Imaging (fMRI),
Functional Studies on Magnetic Resonance
João Pedro Ribeiro Miranda x
João Pedro Ribeiro Miranda xi $ Estudos Funcionais em Ressonância Magnética
% &' A imagem por Ressonância Magnética é uma técnica utilizada para se
obterem principalmente imagens estruturais e funcionais de alta qualidade do corpo humano. As técnicas de Ressonância Magnética Funcional, entre as quais se incluem o Arterial Spin Labeling e o Blood Oxygenation Level Dependent são utilizadas para medir e estudar a actividade cerebral. Vários estudos têm demonstrado que o ASL tem várias vantagens quando comparado com o BOLD principalmente pelo facto de ser mais reprodutível e de permitir a quantificação da perfusão cerebral.
( ) * O principal objectivo deste trabalho é a quantificação da perfusão em determinados territórios cerebrais e comparar os resultados obtidos através de dois diferentes protocolos de ASL. Este estudo teve também o objectivo de validar um protocolo para ser usado em exames clínicos – Protocolo 2, comparando os valores obtidos para todas as regiões consideradas com os existentes na literatura.
+ A metodologia utilizada neste estudo foi aplicada a quinze voluntários adultos. Dois protocolos ASL foram usados numa sessão única de imagem funcional. Os indivíduos executaram uma tarefa motora com a mão direita enquanto estavam a ser examinados. As imagens foram adquiridas num equipamento de 3 Tesla G Magnetom Verio MRI System G da SIEMENS no Hospital da Luz. Para a definição das regiões a estudar o atlas anatómico de Talairach foi utilizado e o cérebro foi segmentado em diversas regiões considerandoGse cinco níveis de segmentação diferentes.
Estudos de quantificação de perfusão têm demonstrado que o ASL permite um cálculo correcto do Fluxo Sanguíneo Cerebral, especialmente quando comparado com outros estudos que utilizaram outras técnicas invasivas de quantificação de perfusão. Os valores de perfusão obtidos para diversas regiões consideradas estão de acordo com os disponíveis na literatura.
, Protocolos de ASL estão agora a tornarGse disponíveis comercialmente e têm demonstrado resultados coerentes com outras técnicas já estabelecidas. Este trabalho representa um dos primeiros estudos de perfusão cerebral detalhada utilizando a técnica ASL para avaliar diversas estruturas do cérebro. A adequação do Protocolo 2 para estudos funcionais também foi provada, considerando o estímulo utilizado.
* * " # Ressonância Magnética Funcional, Fluxo
Functional Studies on Magnetic Resonance
João Pedro Ribeiro Miranda xii
João Pedro Ribeiro Miranda xiii --- *
--- .
--- .
---.
/ ---.*
---. .
---..
0 % --- 0
0-0 --- 0
0-1 ) --- 1
0-2 --- 2
0-3 4 --- 2
0-5 --- 3
1 6 / 6 --- 7
1-0 4 --- 7
2.1.1 Cerebrum ... 8
1-1 / ( 8 --- 9
1-2 --- 0:
1-3 * --- 00
2.4.1 Cerebral Arteries ... 11
2.4.2 Cerebral Vascular Territories ... 13
1-5 --- 05
2.5.1 Perfusion ... 15
2.5.2 Perfusion Measuring Techniques ... 16
2 % --- 07
2-0 % --- 07
Functional Studies on Magnetic Resonance
João Pedro Ribeiro Miranda xiv
2-2 <(. * %--- 11
2-3 % = 4 --- 13
3.4.1 Arterial Spin Labeling Techniques – PASL and CASL ... 25
3.4.2 Perfusion Quantification ... 27
3.4.3 ASL Pulse Sequences ... 30
3 --- 22
3-0 4 ) --- 22
3-1 % ; --- 23
3-2 4 % --- 25
4.3.1 Perfusion Quantification Method ... 35
4.3.2 CBF Quantification in Activation and Rest Conditions ... 35
3-3 4 --- 2> 5 --- 29
5-0 / ? = --- 29
5-1 / ? = --- 30
5.2.1 First level of segmentation G Hemisphere... 41
5.2.2 Second level of segmentation G Lobe ... 44
5.2.3 Third level of segmentation – Gyrus ... 47
5.2.4 Fourth level segmentation – Tissue Type ... 52
5.2.5 Fifth level segmentation – Cell Type ... 54
> --- 59
>-0 4 ) * * --- 59
>-1 ( --- >: >-2 @ / --- >0 >-3 / --- >0 --- >2 . = . % ? --- 70
João Pedro Ribeiro Miranda xv
/
Figure 2.1 – Representation of brain anatomic structure – main divisions (adapted from
(10)) ... 8
Figure 2.2 – Illustration of brain’s anatomic structure – representation of the four lobes
(10)... 8
Figure 2.3 – Illustration of the location of the five primary sensory areas and the
primary motor cortex (13) ... 10
Figure 2.4 – Illustration of the five segmentation levels that were taken into account in
the current study (14) ... 11
Figure 2.5 – Illustration of the arterial circulation of the brain (adapted from (10)) ... 12
Figure 2.6 – Representation of vascular territories of the cerebral arteries (courtesy of
Dr. Savoiardo) ... 14
Figure 3.1 – The magnetization M precesses around the z axis with the angle α, and it
is divided into the longitudinal component, Mz and the transverse component Mxy. A RF
coil is placed in the y axis direction to collect the MR signal. (38) ... 19
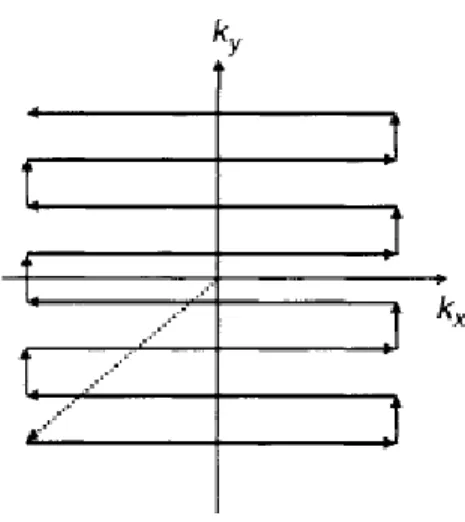
Figure 3.2 – Graphic of EPI k9space coverage order during one TR (40). ... 20
Figure 3.3 – GRE9EPI pulse sequence scheme – After the application of the 90º
excitation pulse it may be seen the FID signal that is acquired (adapted from (40)) ... 21
Figure 3.4 – SE9EPI pulse sequence scheme – Unlike GRE9EPI in SE9EPI we may see two
pulses applied that produce a series of waveforms (adapted from (40)). ... 21
Figure 3.5 – Different contrasts a) T1 weighted b) Proton9density weighted c)T2
weighted ... 22
Figure 3.6 – Hemodynamic changes in neuronal activity. a) Rest b) Activation – Red
circles represent oxyhemoglobin and its increase is well seen. The blue circles represent
deoxyhemoglobin and its relative decrease is also patent in the scheme (adapted from
(43)). ... 23
Figure 3.7 – Hemodynamic response function (HRF) 9 a) response to brief stimulus b)
response to long stimulus. (adapted from (44)) ... 24
Figure 3.8 – The EPISTAR PASL sequence, which labels everything at once and uses two
Functional Studies on Magnetic Resonance
João Pedro Ribeiro Miranda xvi
an inversion pulse (green) is applied and the signal generated by the inverted spins
(blue) is acquired at t=TI. On the bottom sequence the inversion pulse is not applied
(orange) and the spins (red) are not inverted, generating a control image. (adapted
from (47)) ... 25
Figure 3.9 – The FAIR PASL sequence compared with EPISTAR sequence. EPISTAR
sequence is described in Figure 3.8. For the FAIR sequence it is possible to view the
position of the applied inversion label (adapted from (49)). ... 26
Figure 3.10 – CASL sequence scheme. In CASL there is a continuous inversion pulsed
applied in the Inversion Plane. After a period of time δt in which the blood arrives to the
acquisition plane the signal is acquired. The signal will weaken as the labeled water in
the blood moves through the tissue (54). ... 27
Figure 3.11 9 Theoretical curves of pulsed ASL signal versus time calculated from
Equation 3.9. (55) ... 30
Figure 3.12 – Pulse sequence for Q2TIPS. On the right are shown the locations of the in9
plane pre9saturation slab, the imaging slice(s), periodic saturation slice and inversion
slab used in the PICORE labeling scheme. Double in9plane 90º presaturation pulses are
followed by a hyperbolic secant inversion tagging pulse. The gradient lobe in gray is
alternately applied for tag and control states. The first inversion time TI1 allows the
inverted arterial spins to flow to the imaging slab. Periodic saturation pulses applied
from TI1 toTI1S (TI1s is the stop time) consist of a train of 90º excitation pulses each
followed by a crusher gradient that eliminates the signal from the large feeding
arteries (58). Single or multislice EPI acquisition is applied at TI2. (57) ... 31
Figure 5.1 – Perfusion map from a male subject. The nine axial slices are displayed
from bottom to top. The ninth slice is not displayed as it does not present information.
... 40
Figure 5.2 – Plot comparing mean perfusion values (ml/100g/min) for both protocols.
... 41
Figure 5.3 – Left Cerebrum in a) Talairach Standard Space b) ASL space – perfusion
map ... 42
Figure 5.4 9 Plot comparing mean perfusion values (ml/100g/min) for both protocols
and for the two states in first segmentation level. ... 43
Figure 5.5 – Left Temporal Lobe in a) Talairach Standard Space b) ASL space –
João Pedro Ribeiro Miranda xvii Figure 5.6 9 Plots comparing mean perfusion values (ml/100g/min) for both protocols in
second segmentation level for a) Protocol 1 b) Protocol 2 ... 45
Figure 5.7 9 Left Precentral Gyrus in a) Talairach Standard Space b) ASL space –
perfusion map ... 47
Figure 5.8 – Plot comparing mean perfusion values (ml/100g/min) for Protocol 1 in
third segmentation level. ... 48
Figure 5.99 Plot comparing mean perfusion values (ml/100g/min) for Protocol 2 in third
segmentation level. ... 49
Figure 5.10 – White Matter in a) Talairach Standard Space b) ASL space – perfusion
map ... 52
Figure 5.11 9 Plot comparing mean perfusion values (ml/100g/min) for both protocols
in second segmentation level for Protocol 1 and Protocol 2 ... 53
Figure 5.12 – Corpus Callosum in a) Talairach Standard Space b) ASL space – perfusion
map ... 54
Figure 5.13 9 Plot comparing mean perfusion values (ml/100g/min) for Protocol 1 in
fifth segmentation level. ... 55
Figure 5.14 9 Plot comparing mean perfusion values (ml/100g/min) for Protocol 2 in
João Pedro Ribeiro Miranda xix Table 4.1 – Acquisition parameters – EPI readout ... 34
Table 4.2 – Acquisition parameters – PICORE Q2TIPS ... 34
Table 5.1 – Mean CBF values (ml/100g/min) in GM for each subject for both protocols
... 40
Table 5.2 – Mean perfusion values (ml/100g/min) in first level segmentation regions of
the brain ... 43
Table 5.3 – Mean CBF values (ml/100g/min) in second level segmented brain regions 46
Table 5.4 – CBF mean values obtained in current study copmpared with the ones from
literature: ... 51
Table 5.5 9 Mean perfusion values (ml/100g/min) in fourth level segmentation regions
of the brain ... 53
Table B.1 – Mean perfusion values (ml/100g/min) in third level segmentation regions of
the brain ... 85
Table B.2 9 Mean perfusion values (ml/100g/min) in third level segmentation regions of
João Pedro Ribeiro Miranda xxi ASL Arterial Spin Labeling
ATP Adenosine Triphosphate
BOLD Blood Oxygenation LevelGDependent CASL Continuous Arterial Spin Labeling
CBV Cerebral Blood Volume CCA Common Carotid Artery CVR Cerebrovascular Reactivity DSC Dynamic Susceptibility Contrast
DU Doppler Ultrasound EPI EchoGplanar Imaging
EPISTAR Echo Planar Imaging and Signal Targeting with Alternating Radiofrequency
FOV Field of View
GLM General Linear Model GRE GradientGecho Sequence
HRF Hemodynamic Response Function
MPRAGE Magnetization Prepared Rapid Acquisition Gradient Echo MR Magnetic Resonance
MRI Magnetic Resonance Imaging MTT Mean Transit Time
NMR Nuclear Magnetic Resonance PASL Pulsed Arterial Spin Labeling
PCT Perfusion Computed Tomography PET Positron Emission Technique
Functional Studies on Magnetic Resonance
João Pedro Ribeiro Miranda xxii
QUIPSS Quantitative Imaging of Perfusion using a Single Subtraction rCBF Regional Cerebral Blood Flow
RF Radio Frequency SE SpinGecho Sequence
SPECT Single Photon Emission Computed Tomography T1 Longitudinal Relaxation Time
T2 Transverse Relaxation Time
TE Echo Time TI Inversion Time TR Repetition Time
XeCT XenonGenhanced Computed Tomography
B0 External Magnetic Field
ν Precession Frequency
João Pedro Ribeiro Miranda 1
0
%
0-0
Magnetic Resonance Imaging (MRI) is a technique used in clinical diagnosis to obtain structural and functional images of the brain that does not require ionizing radiation. Within the last years, MRI has become more sophisticated and rigorous, especially concerning its spacial resolution and contrast. (1)
Functional MRI (fMRI) can be used to obtain the neuronal responses to stimulus. The most commonly used techniques are Blood Oxygenation LevelGDependent (BOLD) contrast and, more recently, Arterial Spin Labeling (ASL). (2)
Functional Studies on Magnetic Resonance
João Pedro Ribeiro Miranda 2
introduced major improvements in brain function assessment and mapping as compared to other invasive perfusion measuring techniques available (3) (4) (5). Both BOLD and ASL are non invasive techniques that can be used to detect the neuronal response to a stimulus and thereby evaluate brain function. Some studies have demonstrated that ASL holds several advantages when compared with BOLD, namely the fact of being more reproducible and allowing perfusion quantification (6). However, ASL has also some drawbacks mainly related to its low Signal to Noise Ratio (SNR), but high field MRI scanners are now benefiting this technique by improving this parameter (7).
ASL has recently been available for clinical purposes and is not yet recognised as the gold standard for brain functional studies. However, using high field scanners, its capacity to quantify perfusion nonGinvasively is turning ASL in an important technique to take into account in clinical exams.
0-1
)
The main aim of this work is to obtain perfusion quantification of the human brain within several of its territories and to compare the results obtained using two different ASL protocols.
As an innovative technique it is also important to compare the values calculated with others obtained by other techniques. However, it was rather difficult to find in literature values for all the regions considered in the current work.
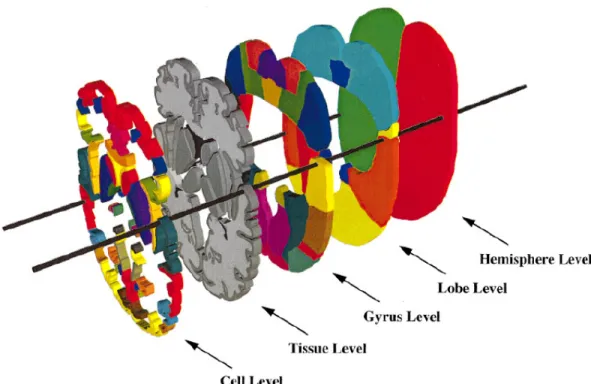
These regions were calculated regarding five different segmentation levels of the brain, dividing the brain within its hemispheres, lobes, gyri, tissue and cell types The detail applied in this study was important to obtain perfusion quantification in areas where it has not been measured yet, specially in the fifth level – Cell Types.
The current work is integrated in a more general study that is being conducted by the R&D group of Siemens Portugal which is validating and developing new acquisition parameters for ASL.
All the work undertaken in this project opens the doors for a more detailed study on Cerebral Blood Flow (CBF) within brain’s vascular territories.
In order to obtain functional data, fifteen subjects were scanned while performing a motor finger tapping test with their right hand.
João Pedro Ribeiro Miranda 3 Data analysis was performed with FSL and self written Linux Shell Scripts that are attached to this document.
0-2
The major contribution of the current work is a systematic study of perfusion quantification using ASL in preGestablished cerebral regions of healthy volunteers in rest and during a functional motor task.
In order to perform a correct perfusion evaluation of the brain it is important to study it in detail. This work provides a study in great detail of the human brain, dividing the brain within its hemispheres, lobes, gyri, tissue and cell types. It may be used in the future not only for comparative purposes but also to promote an even more detailed evaluation of the brain’s perfusion.
Moreover, the validation of the ASL technique for both rest perfusion quantification and fMRI is of high importance for the introduction of this technique in clinical routine. This kind of study has also an impact for SIEMENS. Being the first company to have ASL commercially available it is of high interest for them to see their solutions being well received in clinical routines.
The great difficulty to find similar studies for value comparison illustrates the innovation that is evident in this project.
0-3
4
For a better understanding of the current work and for a correct interpretation of the results, this thesis initiates by giving a theoretical introduction to Functional Neuroimaging in Chapter 2. The second chapter presents the description of the brain’s structure and its functional organization, a summary of cerebrovascular anatomy and a brief introduction to the concept of Cerebral Blood Flow and measurement of perfusion. The third chapter presents a general approach to Magnetic Resonance Imaging and its physics, as well as a more detailed description about techniques used in Functional Magnetic Resonance Imaging.
The description of the methodology of data analysis is provided in the fourth chapter and the results obtained are presented in Chapter 5 as well as its discussion.
Functional Studies on Magnetic Resonance
João Pedro Ribeiro Miranda 4
0-5
With 500 production centres in 50 countries and representation in 190 countries, Siemens is spread all over the world. In Portugal, Siemens S.A. encloses two factories, software research & development centres (Lisbon and Oporto) and has a significant representation all over the country through its partners and company headquarters. Since 2008, the company is organized in three major sectors: Industry, Energy and Healthcare.
The % 4 and its solutions address Industry customers regarding production, transportation and building systems. This Sector is organized in five divisions: Industry Automation and Drive Technologies, Building Technologies, Industry Solutions, Mobility and OSRAM.
The B 4 offers products and solutions for generation, transmission and distribution of electrical energy. This Sector is organized in six divisions: Fossil Power Generation, Renewable Energy, Oil & Gas, Energy Service, Power Transmission and Power Distribution.
The C 4 stands for innovative products and complete solutions, as well as service and consulting in healthcare industry. This Sector is organized in three divisions: Imaging & Information Technologies, Workflow & Solutions and Diagnostics. The Imaging & IT Division provides imaging systems for early diagnosis and intervention, as well as for a more effective prevention, namely Magnetic Resonance Imaging Systems (MR), Computer Tomography Systems (CT), Radiography and Angiography Systems, Positron Emission Tomography Systems (PET/CT), SingleGPhoton Emission Tomography Systems (SPECT and SPECT/CT), Ultrasound Units, among others. These systems are networked with highGperformance healthcare IT to optimize processes (such as hospital data systems like 4 D, image processing systems like 4 D, and knowledgeGbased technologies for diagnoses support).
João Pedro Ribeiro Miranda 5 The Diagnostics Division covers business with inGvitro diagnostics, including immune diagnostics and molecular analysis. The Division’s solutions range from pointGofGcare applications to automation of large laboratories.
Thus, Siemens Healthcare Sector is the first fully integrated diagnosis company, providing a complete technological portfolio for the entire supply chain in healthcare 4 % 4 4 * , leader in Information Technologies services, works as a transverse business unit.
In Portugal, Siemens SA Healthcare Sector is a market leader in the healthcare area, known for its competence and innovation skills in diagnostic and therapy systems, as well as information technologies and systems’ integration.In recent years, Siemens SA Healthcare Sector has promoted the contact and cooperation with key partners in the areas of science and biomedical technology, namely Universities and Research Institutes, establishing a knowledge network and strategic partnerships and thus promoting innovation, research and development in healthcare.
Today, the Healthcare Sector’s R&D Group in Portugal is comprised by over 15 elements, working in strategic areas, such as Information Systems, Computational Imaging, Automatic Medical Imaging Analysis, Modelling and Decision Support Tools and Strategic Technology Evaluation. This collaborating work has already been demonstrated by one approved patent application, two filed invention disclosures and over ten scientific publications.
• Breast Pathology Service in Hospital de São João in Oporto, Hospital da Luz in Lisbon and Clínica Dr. João Carlos Costa in Viana do Castelo – first total patient focus units, including all necessary technologies for the complete clinical process;
• Hospital da Luz in Lisbon – first hospital in Portugal with SOARIAN ® clinical information system, becoming one of the most modern health care installations in Europe;
• Clínica Quadrantes, in Lisbon – inGvitro diagnostics and information technology systems, which together with a PET/CT system, complemented the existing Siemens inGvivo diagnostic systems at the clinic;
Functional Studies on Magnetic Resonance
João Pedro Ribeiro Miranda 6
Network Grid, a scientific cooperation network which integrates the Universities of Coimbra, Aveiro, Porto and Minho.
@ C
• Patent number DE 10 2007 053 393, System zur automatisierten Erstellung medizinischer Reports;
• F. Soares, P. Andruszkiewicz, M. Freire, P. Cruz e M. Pereira, SelfGSimilarity Analysis Applied to 2D Breast Cancer Imaging, HPCGBio 07 G First International Workshop on High Performance Computing Applied to Medical Data and Bioinformatics, Riviera, France (2007);
• J. Martins, C. Granja, A. Mendes e P. Cruz, Gestão do fluxo de trabalho em diagnóstico por imagem: escalonamento baseado em simulação, Informática de Saúde – Boas práticas e novas perspectivas, edições Universidade Fernando Pessoa, Porto (2007);
João Pedro Ribeiro Miranda 7
1
6
/
6
The human brain has always been one of the organs that most aroused the curiosity of researchers throughout the years. The attempts to study its function and even its blood flow proved to be mainly fruitless and scientists have always been eager to discover and study methods that make the evaluation of brain’s function possible. The current work is one more approach to develop scientific knowledge of the brain. Some general considerations on this organ are described in the following chapters.
1-0
4
The human brain is the center where all the great motor, sensory and cognitive functions are elaborated. Its average weight is 1370 grams representing only about 2% of the human weight although receiving 25% of all the blood volume that leaves the heart (8).
Functional Studies on Magnetic Resonance
João Pedro Ribeiro Miranda 8
system). The midbrain consists of the tectum and tegmentum. The hindbrain is made of the cerebellum, pons and medulla. The midbrain, pons, and medulla together are referred to as the brainstem (9). An illustration of this divison may be seen in Figure 2.1.
Figure 2.1 – Representation of brain anatomic structure – main divisions (adapted from
(10))
1-0-0
The cerebrum is nearly symmetrical, composed by two hemispheres, separated by the longitudinal fissure, each one divided into four lobes (Figure 2.2). The frontal and parietal lobes are separated by the central sulcus, and the temporal lobe is separated by the lateral fissure. The corpus callosum joins left and right hemispheres (8).
Figure 2.2 – Illustration of brain’s anatomic structure – representation of the four lobes
(10) Thalamus
Hypothalamus
Medulla
Cerebrum
Cerebellum
João Pedro Ribeiro Miranda 9 It is composed of an outer layer of gray matter, internally supported by deep brain white matter, and it is responsible for the so called “higher functions”, such as thinking and cognition (8).
Gray matter consists of cell bodies of neurons, while white matter consists of axons that connect neurons. The axons are often surrounded by a fatty insulating cover called myelin, which gives the white matter its distinctive colouration. The function of this fatty sheath is to insulate nerve endings, enable smooth movements of brain signals and to accelerate the transmission of the nerve signals (8). Finally there are also the glial cells. These are not just homeostatic, providing a stable environment to neurons, but they also communicate with each other and with neurons in a manner that is cooperative, yielding many of the changes in nervous system function that leads to adaptative behaviour of the whole organism. (11)
1-1
/
(
8
The functional organization of much of the brain is poorly understood. However many of the regions involved in sensory and motor function have already been identified. There are three main blocks involved in the organization of the behavior. The first one is composed of the brain stem and the old cortex and it is responsible for wakefulness and the response to stimuli. The second block, composed by the posterior area of the cerebrum, plays a key role in the analysis, coding and storage of information. The third block, the anterior area of the cerebrum, is involved in the formation of intentions and programs. (12)
Functional Studies on Magnetic Resonance
João Pedro Ribeiro Miranda 10
Figure 2.3 – Illustration of the location of the five primary sensory areas and the
primary motor cortex (13)
1-2
The Talairach atlas is based on anatomical landmarks of the brain of a 60 years old female.
The Talairach atlas is highly detailed, has well labeled brain sections for all three dimensions and featuresGa coordinate system that allows studying the brain in alignment with the space described in the atlas.
However, this atlas presents some major drawbacks, mainly the fact of being derived from only one subject and the fact that it ignores leftGright hemispheric differences, only one hemisphere was studied and all the information gathered was extrapolated to the other one.
João Pedro Ribeiro Miranda 11 Figure 2.4 – Illustration of the five segmentation levels that were taken into account in
the current study (14)
The anatomical region labels, available in www.talairach.org/labels.txt and whose information was used in this work, were electronically derived from axial sectional images in the 1988 Talairach Atlas. (15)
1-3
*
As previously stated, the human brain requires about 25% of the entire blood volume. The brain receives its blood supply from the heart by way of the aortic arch that gives rise to the brachiocephalic artery, left common carotid artery (CCA) and the left subclavian artery. (16)
1-3-0
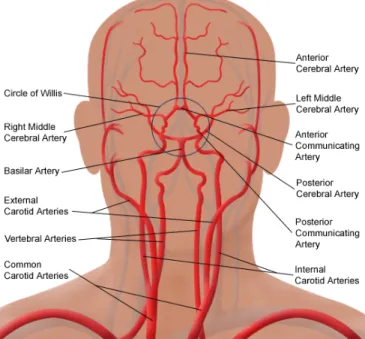
After the path described above, the blood supply is carried into the brain by the two internal carotid arteries and the two vertebral arteries that anastomose at the base of the brain to form the Circle of Willis (17).
Functional Studies on Magnetic Resonance
João Pedro Ribeiro Miranda 12
2.4.1.1 Carotid Arterial System
The left Common Carotid Artery (CCA) arises from the aortic arch while the right one arises from the bifurcation of the Brachiocephalic trunk.
The external carotid artery starts at the bifurcation of the CCA. Its branches supply the jaw, face, neck and meninges.
The internal carotid artery starts at the carotid sinus at bifurcation of CCA at the level of the upper border of the thyroid cartilage at the level of the fourth cervical vertebra. It passes up the neck without any branches to the base of the skull where it enters the carotid canal of the petrous bone. It then runs through the cavernous sinus, pierces the dura mater and then ascends to bifurcate into anterior cerebral artery and the larger middle cerebral artery. (18)
Some branches of the internal carotid artery are the ophthalmic artery, the posterior communicating artery and the anterior choroidal artery.
Figure 2.5 – Illustration of the arterial circulation of the brain (adapted from (10))
To conclude this system, there are also two other main arteries that need reference: the Anterior Cerebral Artery (ACA) and the Middle Cerebral Artery (MCA).
João Pedro Ribeiro Miranda 13 The second one is the largest branch of the internal carotid artery and appears to be almost its direct continuation. It passes through the lateral sulcus where it then branches and projects to many parts of the lateral cerebral cortex. It also supplies blood to the anterior temporal lobes and the insular cortices.
1-3-1 E
The brain can naturally be divided into vascular territories which are regions based on the feeding artery of each region (19). Therefore, and taking into account what was said previously, it is possible to divide the brain into some main regions.
The Posterior Inferior Cerebellar Artery (PICA) territory is on the inferior occipital surface of the cerebellum and is in equilibrium with the territory of the Anterior Inferior Cerebellar Artery (AICA), which is on the lateral side. (Figure 2.7) (19) (18) (20)
The Superior Cerebellar Artery (SCA) territory is in the superior and tentorial surface of the cerebellum. (Figure 2.7) (18) (20)
The branches from the vertebral and basilar arteries supply the medulla oblongata and the pons. (Figure 2.7) (20) (17)
The territory of the Anterior Choroidal Artery (AChaA) is part of the hippocampus, the posterior limb of the internal capsule and extends upwards to the area lateral to the posterior part of the cella media. (Figure 2.7) (18)
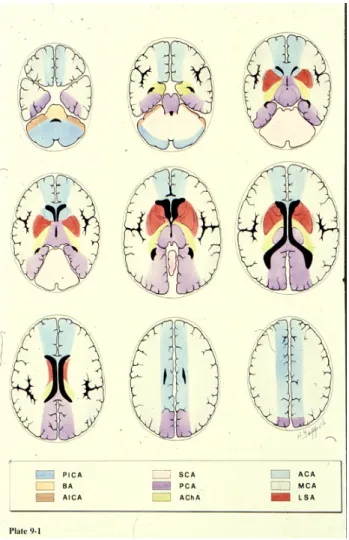
João Pedro Ribeiro Miranda Figure 2.6 – Representation
Dr. Savoiardo)
The ACA supplies the medi portion of the corpus callos The cortical branches of th for the medial part of the and the inferior part of the Artery (PCA). (Figure 2.6) The PCA is divided into P1 (PCOM). Penetrating branch thalamus arise primarily fro the PCA supply the inferom and splenium of the corpus
Functional Studies on Mag
tion of vascular territories of the cerebral arteries
edial part of the frontal and the parietal lobe and losum, basal ganglia and internal capsule. (Figure the MCA supply the lateral surface of the hemisp
e frontal and the parietal lobe, which is supplied the temporal lobe, which is supplied by the Poste
P1 and P2 segments by the Posterior Communica nches to the mesencephalon, subthalamic, basal s
from the P1 segment and the PCOM. (22) Cortica omedial part of the temporal lobe, occipital lobe us callosum. (17)
agnetic Resonance
14 ies (courtesy of
nd the anterior re 2.6) (21)
isphere, except ied by the ACA, sterior Cerebral
João Pedro Ribeiro Miranda 15
1-5
Neuronal activity results in focal changes in hemodynamics, metabolism and blood oxygenation of associated brain areas. (23)
The brain vascular system is both unique and heterogeneous in terms of structure, microvascular organization and function. Cerebral capillary abundance ranges from 260 mm/mm3 (average of cerebrum white matter) to 2000 mm/mm3 in the paraventricular and supraoptic nuclei of the hypothalamus. In addition to these quantitative differences, which reflect variations in metabolic rate as well as the existence of specialized endocrine secretory mechanisms, there are also wide variations in capillary structure. (24)
This differences lead to a difference in the regional Cerebral Blood Flow (rCBF) throughout the different areas of the brain. However, rCBF is tightly controlled in order to meet the brain’s metabolic demands.
On average the normal cerebral blood flow is approximately 60ml/100g/min, which is roughly 15% of the cardiac output. (25)
1-5-0
In physiology, perfusion is characterized as the volumetric flow rate per volume of tissue. A proper blood perfusion is vital for normal tissue physiology since it is responsible for the transport of oxygen, nutrients and waste products. Also, blood perfusion is the principal part of the thermal regulatory system of the body. (26)
A large perfusion value range has been reported for human tissue (0.001G0.1 ml/ml/s), representing resting muscle to kidneys. (26)
There is a growing interest in the study of blood perfusion as its variations may indicate abnormal physiologic and pathologic conditions.
One important parameter to bear in mind when studying perfusion is the Cerebral Blood Volume (CBV) which is the fraction of the tissue volume occupied by blood vessels. A typical value for the brain is 4%. (27)
Functional Studies on Magnetic Resonance
João Pedro Ribeiro Miranda 16
1-5-1 ;
Methods for measuring CBF in humans include Positron Emission Tomography (PET), Single Photon Emission Computed Tomography (SPECT), XenonGenhanced Computed Tomography (XeCT), Magnetic Resonance Imaging (MRI) with contrast agents such as Gadolinium and Arterial Spin Labeling (ASL) MRI. (28)
PET is a nonGinvasive diagnostic tool that provides tomographic images of quantitative parameters describing various aspects of brain hemodynamics, including rCBF and rCBV. (29) It requires a radioactive tracer that is introduced into the blood supply. These isotopes are cyclotron products that have a very short halfGlife. A solution of glucose that has been tagged with a radioactive chemical isotope, usually inhaled C15O2, is
introduced into the blood stream and perfusion maps are created from the radioactive emissions. (26)
SPECT was introduced after PET, and generates tomographic images of the threeG dimensional distribution of a specific radiopharmaceutical. It is a technique widely used in nuclear medicine for the imaging of many organs, as well as for whole body imaging for the detection of tumors. (30) Brain SPECT is used for perfusion or receptor imaging of the brain. Unlike PET, that uses positron emissions, SPECT uses radioisotopes that emit gamma radiation, like 133Xe and 99Tc. (29)
João Pedro Ribeiro Miranda 17
2
%
Magnetic Resonance Imaging is an imaging technique used primarily to produce high quality structural medical images of the human body. MRI is based on the principles of Nuclear Magnetic Resonance (NMR) which is a spectroscopic technique used to obtain chemical and physical information about molecules present in a sample. As an image technique it provides an effective, nonGinvasive and high resolution method of scanning several inner organs with special focus on the human brain (1).
2-0
%
Magnetic Resonance (MR) is based upon the interaction between an applied magnetic field and a nucleus that possesses spin (35). The most common nuclei used in MR investigation are: 1H, 13C, 19F, 23Na and 31P. However, and mainly due to its abundance
in living organisms, the most used in clinical applications is 1H. When hydrogen nuclei
are not under influence of an external magnetic field (B0), the spins are randomly
Functional Studies on Magnetic Resonance
João Pedro Ribeiro Miranda 18
When these spins are placed under the influence of B0, they will precess around an axis
parallel to the direction of the field and they will align themselves into two energy states: one highGenergy (antiGparallel to B0) and one low energy (parallel to B0).
The precession frequency (ν) of the nuclei is easily calculated using the Larmor equation (taking into account the gyromagnetic ratio of the nucleus considered, γ):
γB0 = ν Equation 3.1
After the application of B0, a RF pulse at the Larmor frequency and perpendicular to this
field is applied, which will dishevel the spins of hydrogen that were aligned in a process called excitation and will tip the net magnetization vector from the longitudinal direction into the transverse plane. This causes the net magnetization to change over time in the transverse plane, generating the MR signal (37).
When the RF pulse is turned off, the MR signal created will decay over time. This phenomenon is called spin relaxation. There are two primary mechanisms that contribute to the loss of the MR signal: longitudinal relaxation and transverse relaxation. For a given substance in a magnetic field of a certain strength, the rates of longitudinal and transverse relaxation are given as time constants (37).
As they lose energy, excited spins in the highGenergy state go back to their original lowG energy state. This phenomenon is known as longitudinal relaxation (Figure 3.1) and the time constant associated with this process is called T1. The amount of longitudinal
magnetization, Mz, present at time t following an excitation point is given by Equation
3.2, where M0 is the original magnetization. (37)
1 Equation 3.2
After the net magnetization is tipped into the transverse plane by an excitation pulse, it is initially coherent, in the sense that all of the spins in the sample are precessing around the main field vector at about the same phase. That is, they begin their precession within the transverse plane at the same starting point. Over time, the coherence between the spins is gradually lost and they become out of phase. This phenomenon is known as transverse relaxation Figure 3.1. The signal lost by this mechanism is called spinGspin decay, described in Equation 3.3, and is characterized by a time constant known as T2.
João Pedro Ribeiro Miranda 19
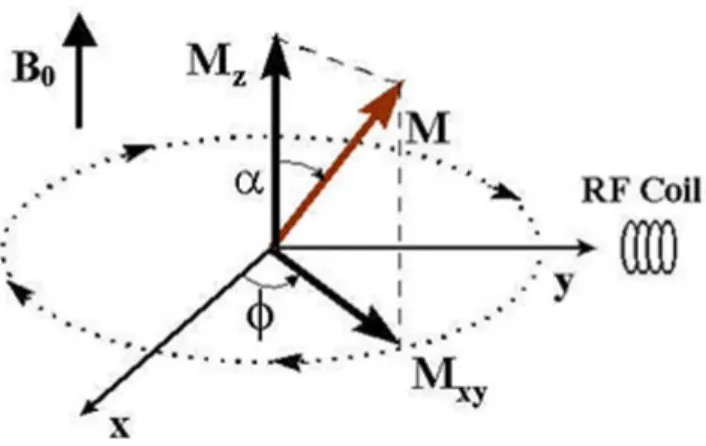
Figure 3.1 – The magnetization M precesses around the z axis with the angle α, and it
is divided into the longitudinal component, Mz and the transverse component Mxy. A RF
coil is placed in the y axis direction to collect the MR signal. (38)
An additional, extrinsic source of differential spin effects is the external magnetic field. Because each spin precesses at a frequency proportional to its local field strength, variations in field from location to location cause spins at different spatial locations to precess at different frequencies, also leading to the loss of coherence. The combined effects of spinGspin interaction and field inhomogeneity lead to signal loss known as T2*
decay, characterized by the time constant T2*. Note that T2* decay is always faster than
T2 decay alone, since it includes not only spinGspin interaction but also the additional
factor of field inhomogeneity. (37)
When the nuclear magnetic moment is perturbed into the transverse plane the signal obtained by its rephasing will be an oscillating signal that decays away under an exponencial envelope G Free Induction Decay (FID). (39)
2-1
;
In this subGchapter a brief introduction to image formation and to pulse sequences is done. Even if it is not this work’s objective it is important to bear in mind some of these considerations. For a more extensive reading on this matter it is recommended Bernstein et al (40).
Functional Studies on Magnetic Resonance
João Pedro Ribeiro Miranda 20
The spin9echo (SE) sequence is one of the most used and is made up of a series of events: 90º pulse – 180º rephasing pulse at TE/2 (Echo Time) – signal reading at TE. This series is repeated at each time interval TR (Repetition Time). With each repetition, a k9 space line is filled, thanks to a different phase encoding. The 180º rephasing pulse
compensates for the constant field heterogeneities to obtain an echo that is weighted in T2 and not in T2*. (40)
The gradient9echo (GRE) sequence has some differences when compared to the SE
sequence, especially regarding the flip angle, which is usually below 90º and the absence of a 180º RF pulse, reducing the time needed to acquire the images, since the longitudinal magnetization component is never inverted by an RF refocusing pulse. Therefore it does not require a long recovery T1 and GRE pulse sequences can use short TR. Adding to the advantage that the less amount of time required represents, there is also another advantage associated with GRE sequence G the fact that it provides images with hypertense blood signal (40).
However, and in order to be used also in functional studies, several sequences have been developed with the objective of reducing even more the acquisition time.
Echo9planar imaging (EPI) uses a different method for data collection. EPI sequences
are characterized by a series of gradient reversals in the readout direction. Each reversal produces a gradient echo, with the second half of one readout period being rephased by the first half of the subsequent readout period. Because of the use of gradient echoes, EPI sequences are very sensitive to T2* effects. The raw data matrix is acquired in a rectilinear, zigzag flashion (Figure 3.2) (40).
João Pedro Ribeiro Miranda 21 Gradient9Echo EPI (GREGEPI) pulse sequence starts with a selective excitation pulse to
produce a FID signal. The flip angle is set to 90º to maximize the Signal to Noise Ratio (SNR). In GREGEPI each k9space line along the phaseGencoded direction is acquired at a different TE (40). The scheme of the GREGEPI pulse sequence may be seen in Figure 3.3.
Figure 3.3 – GRE9EPI pulse sequence scheme – After the application of the 90º
excitation pulse it may be seen the FID signal that is acquired (adapted from (40))
Spin9Echo EPI (SEGEPI) pulse sequence comprises two selective RF pulses, one excitation
pulse with a typical flip angle of 90º and a refocusing pulse with a flip angle of 180º. The two RF pulses generate a SE and during the time window around its peak EPI readout and phaseGencoding waveforms are played to produce a series of spatially encoded gradient echoes. Like GREGEPI, SEGEPI relies on gradient echoes to sample k9 space lines, except that the gradient echoes are formed under the envelope of a SE
instead of a FID (Figure 3.4) (40).
Figure 3.4 – SE9EPI pulse sequence scheme – Unlike GRE9EPI in SE9EPI we may see two
pulses applied that produce a series of waveforms (adapted from (40)).
With the use of a refocusing pulse, the prephasing gradient in either the readout or the phaseGencoded direction does not have to be played immediately before the readout or the phaseGencoding gradient. In many implementations, the prephasing gradients are placed between the excitation and the refocusing pulses.
Images may be weighted in its relaxation times or even in proton density. For a T1
weighted image in a SE sequence the TR and TE used are short, while in a T2 weighted
Functional Studies on Magnetic Resonance
João Pedro Ribeiro Miranda 22
Figure 3.5 – Different contrasts a) T1 weighted b) Proton9density weighted c)T2
weighted1
2-2
<(.
*
%
ASL is an innovative technique that addresses some of the main issues concerning the current gold standard for functional studies. Taking that in consideration, it is important to do a brief introduction to BOLD technique, even for comparative purposes.
Paramagnetic deoxyhemoglobin in venous blood is a naturally occurring contrast agent for MRI (41). It has been demonstrated that deoxyhemoglobin alters the proton signal from water molecules surrounding a blood vessel in GE MRI, producing BOLD contrast. If an area of the brain becomes active through activation due to a certain task, its necessity of ATP will increase, as well as its need for oxygen and glucose. As a result, there is an increase in rCBF mainly in the activated area and consequently there will be an increase in the number of hemoglobin molecules.
When inside the lungs, hemoglobin has a great affinity to oxygen, but by leaving them this affinity changes and the oxygen molecules become more loosely and reversibly bonded to the iron atom that lies in the center of the heme molecule within the hemoglobin complex. (42)
When arriving to the tissues, the oxygen is released from the hemoglobin, leaving the electrons from the iron atom unpaired. This will modify the magnetic field near the deoxygenated hemoglobin.
Hemoglobin is paramagnetic when deoxygenated whereas oxyhemoglobin is diamagnetic so that presence of deoxyhemoglobin in a blood vessel causes susceptibility differences between the vessel and the tissue surrounding it. Such
1Images generated with the software MR Image Expert
João Pedro Ribeiro Miranda 23 susceptibility differences cause faster dephasing of the MR proton signal, leading to a reduction in the value of T2*. In a T2* weighted imaging experiment, the presence of
deoxyhemoglobin in the blood vessels causes a darkening of the image in those voxels containing vessels.
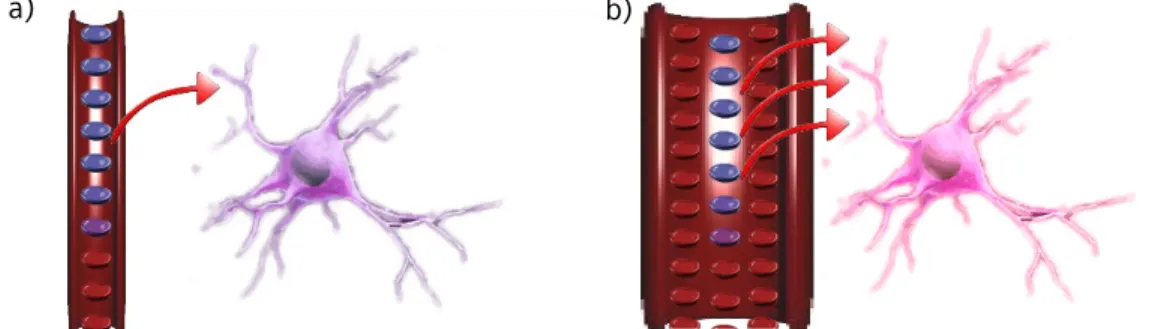
It would be expected that with the increase of neural activity, and since oxygen consumption is increased, the level of deoxyhemoglobin in the blood would also increase, and the MR signal would decrease. However, what is actually observed is an increase in signal, which implies a relative decrease in deoxyhemoglobin. This is because upon neural activity, as well as the slight increase in oxygen extraction from the blood, there is a much larger increase in rCBF, bringing with it more oxyhemoglobin (Figure 3.6). Thus the bulk effect upon neural activity is a regional decrease in paramagnetic deoxyhemoglobin, and an increase in signal.
Figure 3.6 – Hemodynamic changes in neuronal activity. a) Rest b) Activation – Red
circles represent oxyhemoglobin and its increase is well seen. The blue circles represent
deoxyhemoglobin and its relative decrease is also patent in the scheme (adapted from
(43)).
In conclusion, BOLD contrast does not reflect a single physiological process, but rather represents the combined effects of rCBF, CBV and CMRO2. So, the BOLD signal observed
is a sum of signals produced by separated neural events.
Soon after the stimulus applied, a slight depression is found. This initial dip in the BOLD signal is the result of the increased metabolic activity precisely at the prior to the increase of blood flow, i.e. the local consumption of oxygen increases causing a decrease in the fraction of oxyhemoglobin in relation to the concentration of deoxyhemoglobin (Figure 3.7).
Functional Studies on Magnetic Resonance
João Pedro Ribeiro Miranda 24
Figure 3.7 – Hemodynamic response function (HRF) 9 a) response to brief stimulus b)
response to long stimulus. (adapted from (44))
Thus, rCBF increases as well as the concentration of oxygen in the blood, giving rise to a positive response in the BOLD signal approximately 5G8 seconds after the stimulus applied. Finally, after the stimulus ceases, it is observed a decrease in the BOLD signal, the postGstimulus undershoot, due to a slower response by the CBV compared to the rCBF (Figure 3.7) (44).
2-3
% =
4
The nonGinvasive characteristic of ASL has uncovered a whole new world into the study of human brain function and perfusion physiology. This new technique allows to obtain quantitative information about tissue perfusion by evaluating the rCBF. This is done by assessing the inflow of magnetically tagged arterial water into an imaging slice. Following this assessment, the rCBF is measured from the signal intensity differences of the MR with and without tagging, thereby subtracting out the static magnetization of the imaging slice. (45)
João Pedro Ribeiro Miranda 25 image). The control image and the tag image are then subtracted to produce a perfusion image. This image will reflect the amount of arterial blood delivered to each voxel of the slice after a certain transit time.
2-3-0 4 ; = 4 4
There are two main types of ASL techniques available in the market: Pulsed ASL (PASL) and Continuous ASL (CASL). Within this last one, there is also a variation which is the pseudoGContinuous ASL (pCASL). However, the current work will only focus on the first one.
The PASL approach labels a thick slab of arterial blood at a single instance in time, and the imaging is performed after a time long enough for that spatially labeled blood to reach the tissue and exchange at the region of interest as seen in Figure 3.8. (47) In 1994, Edelman proposed the first pulsed ASL scheme, known as Echo Planar Imaging and Signal Targeting with Alternating Radiofrequency (EPISTAR). (48)
Functional Studies on Magnetic Resonance
João Pedro Ribeiro Miranda 26
Shortly after this sequence was released, an alternative to this asymmetric method of labeling was proposed by Kim et al. (49), who named it Flow Alternating Inversion Recovery (FAIR). In this approach, the label is symmetrically applied using a nonG selective inversion pulse, while the control employs a concomitant slice selective gradient pulse (Figure 3.9).
Figure 3.9 – The FAIR PASL sequence compared with EPISTAR sequence. EPISTAR
sequence is described in Figure 3.8. For the FAIR sequence it is possible to view the
position of the applied inversion label (adapted from (49)).
There is also one third technique, named Proximal Inversion with a Control for OffG Resonance Effects (PICORE) that was developed by Wong et al. (50), and uses a labeling scheme similar to EPISTAR. The only difference is that the inversion slab in the control acquisition was replaced by an RF pulse applied at the same frequency as in the label experiment but in the absence of a magnetic field gradient. (50)
João Pedro Ribeiro Miranda 27 Figure 3.10 – CASL sequence scheme. In CASL there is a continuous inversion pulsed applied in
the Inversion Plane. After a period of time δt in which the blood arrives to the acquisition plane
the signal is acquired. The signal will weaken as the labeled water in the blood moves through
the tissue (54).
Comparing both spin labeling schemes, although CASL provides stronger perfusion contrast, it is more difficult to implement than PASL because of its hardware demands – the external coil, and it deposits a higher level of RF power into the subject.
2-3-1 ?
A general kinetic model for perfusion quantification was developed by Buxton et al. (55). This model relates the magnetization that is carried into the voxel by arterial blood, magnetization difference ∆M(t), with the perfusion in that voxel. Then, the amount of magnetization in the tissue at a time t will depend on the history of delivery of magnetization by arterial flow and clearance by venous flow and longitudinal relaxation. ∆M(t) can be described as a sum over the history of delivery of magnetization to the tissue weighted with the fraction of that magnetization that remains in the voxel. After the inversion pulse, the arterial magnetization difference is 2αMob, where Mob is the equilibrium magnetization of arterial blood and the factor α
accounts for incomplete inversion during the tagging pulse: α is the fraction of the
maximum possible change in the longitudinal magnetization that was achieved. The amount delivered to a particular voxel between t’ and t’ + dt’ is 2αMobfc(t’), where f is
the CBF (expressed in units of ml of blood per ml of voxel volume per second) and c(t’) is the delivery function, which is the normalized arterial concentration of magnetization arriving at the voxel at time t’. The fraction of magnetization that remains at time t is r(t G t’)m(t G t’) being r(t) the residue function and m(t) the magnetization relaxation function. (55)
Functional Studies on Magnetic Resonance
João Pedro Ribeiro Miranda 28
Then,
∆ 2
2 ! " #$ Equation 3.4 (55) where * denotes convolution.
There are some basic assumptions that have been taken into account in order to create this model:
1. The arrival of labeled blood at a particular voxel is assumed to be via uniform plug flow, so that before an initial transit delay ∆t, no labeled blood arrives, between t = ∆t and t = ∆t + τ (being τ the time width of the label), the arriving blood is uniformly labeled; and for t > ∆t + r, the arriving blood is again unlabeled.
2. The kinetics of water exchange between tissue and blood are assumed to be described by single compartment kinetics. The essential assumption of singleG compartment kinetics is that whatever subcompartments may exist within the tissues are undergoing such rapid exchange of water that their concentration ratios remain constant even though the total tissue concentration is a function of time.
3. After the inversion pulse, the magnetization initially decays with the relaxation time of blood, T1b, but after the labeled water molecules have reached the tissue
voxel, the magnetization is assumed to decrease with the relaxation time of the tissue, T1.
Thus, the standard model can be summarized as:
0 0 ' ' ∆ ( * +) ,-./ ∆ ' ' 0 1 ∆
( ∆+ 23 43-2-/ ∆ ' ' 0 1 ∆
0 0 1 ∆ '
Applying these assumptions to Equation 3.4 leads to the following expression for the PASL difference signal:
Δ 6 7
8 0 0 ' ' Δ
2 9 Δ (
)
* +:; Δ ' ' 0 1 Δ
2 9 0( )
* +:; 0 1 Δ '
<
João Pedro Ribeiro Miranda 29 with,
:;
= > =∆ = ?
@ ∆ ∆ ' ' 0 1 ∆
AB)>ACB∆) ACB DE∆)?
=F 0 1 ∆ '
@ G1
H
1 GH
1 GHI
1 GH1 J
Under the normal parameter range, and for t > dt + τ, q(t) is close to the unity.
The parameters ∆ and 0 are both dependent of vessel geometry and distribution of flow velocities. MOB and T1B are spatially invariant constants that can be estimated. Two
alternative modifications (QUIPSS and QUIPSS II) of basic PASL pulse sequence were introduced by Wong et al. (56) in order to eliminate the dependence of the perfusion value from ∆t. Moreover, the 0 value started to be defined by the user. These modifications are described in more detail in the following subchapter. However, for quantification purposes, the main conclusion drawn from this new introduction is that if the magnetization difference signal is acquired at a time t after ∆t +τ, then the signal is independent of both ∆t and τ and is given by the last branch of the standard kinetic model with q(t) = 1, i.e.: If,
TI1 < t
TI2 > TI1 + ∆
Being TI1 the time of application of the saturation pulse and TI2 the time when the
image is acquired, and:
∆ GKL 2 9 GKH M⁄ M +
That can be rearranged in order to calculate the CBF:
OPQ LUT RST
V M AC*W * +⁄ Equation 3.9 (55) Where M0 is the tissue magnetization, λ = TV
TV+, being M0b the equilibrium magnetization of the arterial blood.
In Figure 3.11 are shown the effects of varying the parameters that are used in Equation 3.9 and how it may affect the PASL signal that is being calculated.
Equation 3.6 (55)
Equation 3.7 (55)
Functional Studies on Magnetic Resonance
João Pedro Ribeiro Miranda 30
Figure 3.11 9 Theoretical curves of pulsed ASL signal versus time calculated from
Equation 3.9. (55)
Parameters for solid curve in each plot are f = 0.8 ml/minGml, ∆t = 0.5 s, τ = 1.0 s, and T1
= 1.0 s. Each panel illustrates the effect of varying one of these parameters: perfusion f (upper left), transit delay ∆t (upper right), tissue relaxation time T1 (lower left), and duration of arrival of tagged blood τ (lower right). After the initial transit delay ∆t, the
ASL curve is proportional to local perfusion at all time points, but the early times are also sensitive to the local value of ∆t and the later times are sensitive to the local T1(55)
2-3-2 4 4 ;
For whatever the sequence used, the ASL difference signal (controlGtag image) is approximately proportional to the perfusion. However, several misleading factors, as explained previously, have been reported that complicate the calculation of a quantitative rCBF map.
The ASL sequence pulse used in this work is commercially available by SIEMENS – PICORE Q2TIPS.
João Pedro Ribeiro Miranda 31 errors remain due to incomplete saturation of spins over the slabGshaped tagged region by the QUIPSS II saturation pulse, and spatial mismatch of the distal edge of the saturation and inversion slice profiles. By replacing the original QUIPSS II saturation pulse with a train of thinGslice periodic saturation pulses applied at the distal end of the tagged region, the accuracy of perfusion quantification is improved. (57)
The QUIPSS II with thinGslice TI1 periodic saturation sequence (Q2TIPS) addresses both of
the sources of errors of QUIPSS II. By applying Q2TIPS, the accuracy of perfusion measurements is improved. Figure 3.12 shows the Q2TIPS pulse sequence and positions of the inGplane presaturation slab, the inversionGtagged region, the periodic saturation slice, and the imaging slices.
Figure 3.12 – Pulse sequence for Q2TIPS. On the right are shown the locations of the in9plane
pre9saturation slab, the imaging slice(s), periodic saturation slice and inversion slab used in the
PICORE labeling scheme. Double in9plane 90º presaturation pulses are followed by a hyperbolic
secant inversion tagging pulse. The gradient lobe in gray is alternately applied for tag and
control states. The first inversion time TI1 allows the inverted arterial spins to flow to the
imaging slab. Periodic saturation pulses applied from TI1 toTI1S (TI1s is the stop time) consist of a
train of 90º excitation pulses each followed by a crusher gradient that eliminates the signal
from the large feeding arteries (58). Single or multislice EPI acquisition is applied at TI2. (57)
João Pedro Ribeiro Miranda 33
3
The data used for this study has been previously acquired and processed for a different study (59). In the next sections, besides presentation of the data processing steps specific for this work, acquisition and preGprocessement methodology will also be summarised for a better understanding of the results.
3-0
4
)
Functional ASL data in response to a motor task was collected from fifteen adult volunteers (six females, mean age 25.6, range 22G51 years old). Participants were selected not taking into account any type of consideration to ethnicity, race or any other criteria. All subjects were right handed and none of them had a history of major medical, psychiatric or neurological disorders. The experiments were not carried out in the same day neither in the same period of the day, and subject’s state was not controlled.