NUTRIENT CYCLING AND CO
2EMISSIONS IN AREAS OF PRESERVED AND
THINNED CAATINGA
1DEODATO DO NASCIMENTO AQUINO2*, EUNICE MAIA DE ANDRADE3, HELBA ARAÚJO DE
QUEIROZ PALÁCIO4 and LÉCIO RESENDE PEREIRA JÚNIOR5
1 Received on 01.02.2016 accepted for publication on 24.04.2017.
2 Instituto Nacional de Colonização e Reforma Agrária, Doutorado em Engenharia Agrícola, Teresinha, Brasil. E-mail:
3 Universidade Federal do Ceará, Departamento de Engenharia Agrícola,Ceará, Brasil. E-mail: <[email protected]>. 4 Instituto Federal de Educaçãoe Tecnologia, Ceará, Campus Iguatu, Brasil. E-mail: <[email protected]>. 5 Universidade Federal do Ceará, Programa de Pós-Graduação em Recursos Naturais, Ceará, Brasil. E-mail: <[email protected]>.
*Corresponding author.
ABSTRACT – The aim of this study was to investigate changes that occurred due to land use and ground cover in the deposition, accumulation and rates of litter decomposition, as well as of soil respirometry, in a dry tropical forest. The study was carried out in two adjacent watersheds in the town of Iguatu, in the State of Ceará, Brazil. One of the watersheds had been under preserved vegetation for 35 years (RC35), while the other had been subjected to thinning for 5 years (TC5). The main variables among those being analysed were the litter fractions deposited in collectors and accumulated on the ground, the decomposition constant, and soil respirometry. The data were submitted to statistical analysis and compared by t-test (pd”0.05). The total litter deposited in the collectors during the 12 months of monitoring (April 2013 to March 2014) was around 1,300 kg ha-1 yr-1 for TC
5, differing statistically (pd”0.05) from RC35 (4,019 kg ha-1 yr-1). There was no
difference in the litter accumulated on the ground for type of land use (p>0.05). The conservation of litter on the ground in TC5 is associated with larger inputs of woody, lignified biomass from the thinning, and the consequent lower rates of decomposition and CO2 emission.
Keywords: Dry tropical forest; Respirometry; Ground cover; Nutrient cycling.
CICLAGEM DE NUTRIENTES E EMISSÃO DE CO
2EM CAATINGA
CONSERVADA E RALEADA
RESUMO – Objetivou-se com este trabalho investigar as alterações ocorridas na deposição, acumulação e taxas de decomposição da serapilheira, além da respirometria do solo em floresta tropical seca decorrente do uso e cobertura do solo. O estudo foi conduzido em duas microbacias hidrográficas adjacentes no município de Iguatu, Ceará, Brasil. Uma das microbacias encontrava-se com a vegetação conservada há 35 anos (RC35) enquanto a segunda foi submetida ao raleamento da vegetação por 5 anos (TC5). Dentre as variáveis analisadas as principais foram: frações de serapilheira depositada em coletores e acumulada no solo; constante de decomposição e respirometria do solo. Os dados foram submetidos à análise estatística e confrontados pelo Teste t (pd”0,05). A deposição total de serapilheira nos coletores durante os 12 meses monitorados (abril/ 2013 a março/2014) foi da ordem de 1.300 kg ha-1 ano-1 para TC
5, diferindo estatisticamente (pd”0,05)
da RC35 (4.019 kg ha-1 ano-1). A serapilheira acumulada no solo para os dois usos não apresentaram diferença
entre si (p>0,05). A manutenção da conservação de serapilheira no solo da TC5 está associada aos maiores aportes de fitomassa lenhosa lignificada proveniente do raleamento, e consequentemente das menores taxas de decomposição e emissão de CO2.
1.INTRODUCTION
Despite their importance, dry tropical forests are among the most threatened and least studied forest ecosystems on the planet, and as a result, may be at greater risk than wet forests (Portillo and Sánchez, 2010; Aide et al., 2010). For example, it is estimated that the dry forests of the Pacific islands have been reduced by more than 90% of their original area, with the remainder still threatened by human activity (Gillespie et al., 2012). The caatinga biome, the predominant dry tropical forest in the Brazilian semi-arid region (11% of the country), with a population of approximately 27 million people, has suffered increasing deforestation in recent years. It is currently estimated that 46% of the total area of the biome has been deforested (Brasil, 2014). As this is a region with a rainy season concentrated over 3 to 4 months only (Guerreiro et al., 2013), with shallow soils, such areas easily begin a process of desertification.
Among the management alternatives suggested for this biome, researchers such as Araújo Filho (2002), Pimentel (2010) and Palácio (2011) demonstrate that a technique of thinning can be adopted as an alternative in the conservation of natural resources in semi-arid ecosystems. Such a technique consists of the selective control of woody species, reducing plant density and ground cover by the woody layer (Pimentel, 2010). Araújo Filho et al. (2002) point out that when properly handled and managed, caatinga vegetation can maintain an adequate level of production, with no significant losses in biodiversity or the productive potential of herbaceous plants for the production of animal feed.
Knowledge of processes on different scales in natural ecosystems is essential for understanding the behaviour of the intrinsic characteristics of these ecosystems (Silva et al., 2015). In this context, the deposition, accumulation, and rates of decomposition of the fractions that make up the litter, as well as the CO2 emissions from the soil to the atmosphere through
the action of heterotrophic microorganisms and root respiration, are basic to the study of environmental dynamics.
Plants incorporate C in their tissues through the process of photosynthesis, forming plant biomass; during growth, part of the biomass produced returns to the soil, and makes up the litter layer (Costa et al., 2004). Litter, the main transfer path for nutrient flow,
is fundamental to the sustainability of a forest, since it allows for many of the nutrients absorbed by the plants to return to the soil, where they are again assimilated by microorganisms and plants.
The dynamics of litter deposition in habitats is a process that affects the cycling of matter (energy flow), nutrient availability to plants, erosive processes, and CO2 emissions into the atmosphere (Araújo et al.,
2009). Understanding the patterns of litter production and its consequent decomposition under different types of land use is essential for understanding the dynamics and functioning of ecosystems, as well as for their monitoring (Vidal et al., 2007).
In view of the above, the aim of this study was to quantify changes in the deposition, accumulation and decomposition rates of litter, as well as changes in soil respirometry, in a dry tropical forest submitted to two different managements of land use and ground cover.
2.MATERIAL AND METHODS 2.1. Location of the experimental areas
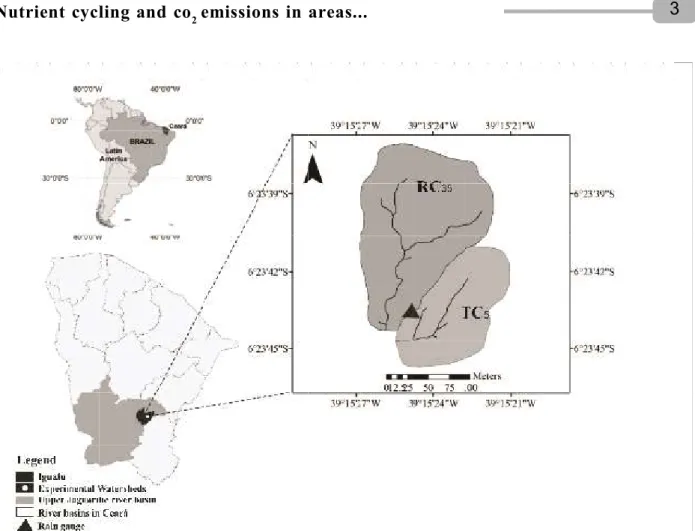
The study was carried out in two adjacent watersheds located in the town of Iguatu, in the State of Ceará, Brazil (Figure 1).
The watersheds have different types of plant cover, RC35 (dry tropical forest, caatinga preserved for 35 years) and TC5 (dry tropical forest, caatinga thinned for 5 years), with areas of 2.1 and 1.1 ha, and average slopes of 10.6 and 8.7% respectively. Thinning consisted of eliminating plants with a stem circumference at breast height of less than 10 cm, this being the smallest size for plant material (smaller-diameter twigs and branches shredded and left on the ground). The management was carried out in December of 2008, 2010 and 2012. Vegetation in the study area is typically composed of steppe-like, deciduous savannah, with a large variety of thorny species in secondary ecological succession. The predominant vegetation is composed of individuals with an average height of from 7 to 15 m, and of variable density in the arboreal layers (Lima, 1981).
which 80% is concentrated during only 3 to 4 months of the year, giving a total historical average of 970 mm ± 316 mm. The region is also characterised by high potential evaporation (1,988 mm yr-1), with higher values
during the seven months of less rainfall (June to December) (Rodrigues, 2013). The soil from both areas was classified as a carbonatic Ebanic Vertisol (Embrapa, 2013). The predominance of 2:1 expansive clay of the montmorillonite group was later confirmed in the soil, using techniques of nuclear diffraction and X-ray fluorescence (Bleicher and Sasaki, 2000).
2.2. Accumulated litter in the collectors and on the soil surface
In both types of plant coverage (RC35 and TC5), an area of 0.5 ha was subdivided into 50 sample units of 10 x 10 m, marked out and identified in loco by means of metal plates. Twelve monthly campaigns to sample the litter were carried out in the two areas between
April 2013 and March 2014, according to the methodology described by Souto (2006) and Lopes et al. (2009). For this, 15 (fifteen) 1 m2 collectors, 0.25 m in height, were
randomly distributed 20 cm from the soil surface for each type of plant cover.
In order to quantify the litter accumulated on the soil surface, 15 samples were collected monthly in both areas following the methodology adopted by Souto (2006) and Lopes et al. (2009). When sampling, a 0.5 x 0.5 m (0.25 m2) cast-iron mould was used, thrown
randomly onto the ground.
After each collection, the litter samples from the collectors and the soil surface were packed separately in previously-identified paper bags and placed in an oven at 65ºC to constant weight. They were then weighed to obtain an estimate of productivity for both RC35 and TC5.
Figura 1 – Localização das microbacias enfatizando o manejo com caatinga conservada (RC35) e caatinga raleada (TC5)
2.3. Litter decomposition constant and soil respirometry
The rate of decomposition was estimated with the use of litterbags (Swift et al., 1979; Wardle, 1993). For this, the substrate was collected from the soil surface in both experimental watersheds. All the collected material was oven dried at 65°C to constant weight. This were then weighed on an analytical balance, and 120 samples containing 30 g of litter were separated per watershed, which were packed in 20 cm x 20 cm polyester litterbags with a 1.0 mm mesh. These were distributed over the soil surface in both watersheds close to the litter collectors.
To quantify decomposition of the material (Coûteaux et al., 1995), 10 litterbags per watershed were randomly collected each month. It is important to note that samples contaminated with soil were discarded. After collection, the litterbags were taken to the laboratory for oven drying at 65°C to constant weight. The material contained in the litterbags was quantified with the use of an analytical balance having an accuracy of 0.01 g, and the decomposition rate (g month-1) was estimated in
relation to the initial weight (30 g).
The annual decomposition rate constants were calculated from data on the percentage weight of the remaining litter, using the negative exponential decay model proposed by Olson (1963) and Wieder and Lang (1982), as per equation 1:
EQ1.
Where: Xo = initial weight of the litterbags (30 g); X = amount of litter remaining after time t; t = elapsed time in years; K = annual decomposition constant (yar -1).
With the value known for K in each watershed (RC35 and TC5), the average renewal time of the litter accumulated on the ground was estimated, 1/K. As per the proposal by Olson (1963), the time (t) required for the decomposition of 50% (t0.5) and 95% (t0.05) of the litter was calculated using the equations: t0.5 = ln2/ K and t0.05 = 3/K respectively. A rain gauge was installed in the area to give a better understanding of the effect of rainfall on seasonal variations in production, litter decomposition and soil respirometry,.
Soil moisture was quantified by the gravimetric method. For this purpose, soil samples with five replications, representing a depth of 10 cm, were randomly collected every two months from April 2013 to March 2014 at different points in each area for a total of six sampling campaigns. Meanwhile, information on soil temperature in both areas was continually recorded every 4 hours at a depth of 10 cm using temperature sensors.
CO2 emissions were evaluated by the method of
C-CO2 capture in sodium hydroxide solution adapted
by Araújo et al. (2009). The collection system consisted of the random distribution in each watershed of five cylindrical PVC buckets with a capacity of 12 L, arranged directly on the natural soil surface, to quantify combined CO2 emissions from the activity of microorganisms and
from the roots.
Every 30 days, a collection was made over 24 hours, considering two periods: daytime (06:00 to 18:00) and night-time (18:00 to 06:00). Quantification of the CO2 was carried out according to Grisi (1978). Glass containers with 20 mL of NaOH solution were used on the inside of the buckets used for CO2 capture; in addition, control containers with the same 20 mL of solution were kept hermetically sealed in the laboratory. A 1% phenolphthalein solution was used as indicator. The absorbed CO2 was determined with equation 2:
EQ2.
Where: CO2 = amount of captured CO2 (mg m-2
h-1); V
b = volume of hydrochloric acid used in blank
titration (mL); Va = volume of hydrochloric acid used in sample titration (mL); NHCL = normality of hydrochloric acid = 0.5; EqCO2 = gram equivalent of CO2 = 22; A
= area covered by the bucket = 0.053 m2; 12 =
transformation factor for hours.
In quantifying the litter accumulated in the collectors and on the soil surface, 15 monthly replications were adopted in each experimental watershed over 12 consecutive months; for measuring soil respirometry, 5 replications per plot were included during the same period.
compared by t-test (Pd”0.05). Box-plot graphs were employed in processing the analysis, with the aim of facilitating interpretation of the results.
3.RESULTS
Rainfall during the study period showed a concentration of events for April, May, and June 2013 (Figure 2). The rainfall depth recorded during the three months was 428 mm, approximately 66% of the total rainfall that year. The greatest contribution of litter from the two experimental plots was recorded in August 2013, with amounts of 1,310 kg ha-1 and 479 kg ha-1,
corresponding to 33 and 37% of the annual amount produced in RC35 and TC5 respectively.
Further, according to Figure 2, it is evident that RC35 displayed greater litter production for all the months being monitored, irrespective of climate season (dry or rainy).
Litter production in TC5 showed less fluctuation,
characterised by a smaller variation in relation to the median (Figure 3a), as the dynamics of this area are
less influenced by the rainfall regime when compared to the preserved area.
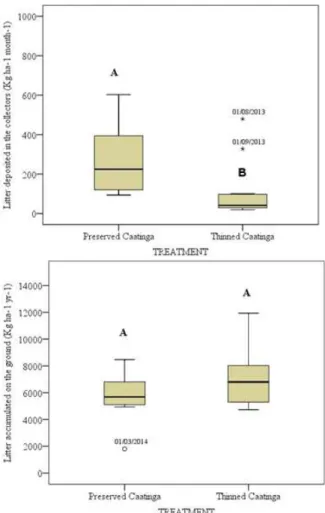
Although production of the litter deposited in RC35 was statistically greater than that of TC5 (pd”0.05)
(Figure 3a), the accumulated litter on the ground for the two types of land use during the study period (April 2013 to March 2014), did not differ statistically by t-test at 5% significance (Figure 3b).
For a better understanding of the factors that interfere in the dynamics, accumulation and decomposition of litter in the soil, values were determined for the decomposition constant (K), the mean renewal time
Figure 2 – Rainfall and monthly litter production
Figura 2 – Precipitação pluviométrica e produtividade mensal de serapilheira
Figure 3 – (a) Litter production in the collectors (kg ha -1 yr-1) and (b) litter accumulated on the ground
(kg ha-1 yr-1). RC
35 (n=180) and TC5 (n=180)
Figura 3 – (a) Produtividade de serapilheira nos coletores (kg ha-1 ano-1) e (b) serapilheira acumulada no
solo (kg ha-1 ano-1). RC
(1/K), and the times of decomposition of 50% (t0.5) and 95% (t0.05) of the litter for the two types of plant cover (Table 1). These results help inform explanation of the behaviour shown in Figures 3a and 3b.
have been seen in other parts of the Brazilian semi-arid region, an example being the results of Alves et al. (2006), Souto (2006) and Silva et al. (2015). To withstand the drought imposed by the rainfall regime, plants reduce leaf area by the immediate abscission of their leaves (Costa et al., 2010). Litter production therefore reaches its highest peak at the beginning of the dry season. Lower litter production in the second half of the dry period (October-December 2013) is explained by the total absence of leaves in the woody species during the period of water scarcity. However, the low production found during the rainy season (March-June 2013 and January-March 2014) is due to the appearance of tender young foliage favoured by the occurrence of rainfall; this allows a period of low senescence accompanied by the regrowth of new photosynthetically active leaves that produce and accumulate nutrient reserves during this period of greater water supply, as also demonstrated by Souto (2006). Completely different values for productivity due to total rainfall were also seen by Lima et al. (2015) and Salgado et al. (2015) in studies carried out in dry tropical forests.
The smaller depositions registered in TC5 can be explained by the fact that this plant management consists of the selective control of woody species, by means
PLANT COVER k
—— years ———
RC35 (Preserved Caatinga) 0.67 1.49 0.46 4.48
TC5 (Thinned Caatinga) 0.35 2.86 1.98 8.57 K 1 t0,5 t00,5
Table 1 – Decomposition constant (K), mean renewal time (1/K) and decomposition times for 50% (t0.5) and 95% (t0.05) of the litter
Tabela 1 – Constante de decomposição (K), tempo médio de renovação (1/K) e tempos de decomposição de 50% (t0,5) e 95% (t0,05) da serapilheira
The value for K found in RC35 (0.67) is 91.4% higher than that seen in TC5 (0.35). It follows that the time necessary for renewal of the litter (1/K) was 1.49 years for RC35 and 2.86 years for TC5 (Table 1); therefore, the time required for the decomposition of 95% (t0.05) of the litter deposited on the ground of RC35 and TC5 was respectively 4.48 years (1,635 days) and 8.57 years (3.128 days), once again expressing the low decomposition rate of litter deposited in the thinned area.
Plant cover in RC35 and TC5 differed statistically (pd”0.05) in relation to soil temperature and moisture at a depth of 10 cm for the months bring monitored (Table 2).
Mean CO2 production resulting from microbial activity and root respiration during the periods of day and night displayed no significant differences between plant cover and day or night period at a level of 5% (Table 2). It can also be seen that the greatest flow of CO2 to the atmosphere occurred in RC35, characterised by lower temperatures and lower soil gravimetric moisture at a depth of 10 cm.
4.DISCUSSION
The intense loss of leaves due to water stress characterises one of the main physiological adaptations of the plant species that make up the tropical dry forest, caatinga, predominant in the Brazilian semi-arid region. The greater rates of deposition registered at the end of the rainy season and the beginning of the dry season,
Soil respirometry (mg m-2 h-1 CO 2-C)
PERIOD PLANT COVER
RC35 TC5
DAY 108.3 Aa 91.4 Ba
NIGHT 105.2 Aa 84.6 Ba
Temperature (oC) 31.2 B 33.3 A
Humidity (%) 16.3 B 18.7 A
Table 2 – Mean total production of C-CO2 (mg m-2 h-1) from
microbial activity and root respiration, for the daytime and night-time periods, together with the mean annual temperature (oC) and humidity (%)
for both types of land-use
Tabela 2 – Médias de produção total de C-CO2 (mg m-2 h -1) proveniente da atividade microbiana e respiração
radicular, nos turnos diurno e noturno, além das médias anuais de temperatura (oC) e umidade (%)
nos dois usos da terra
Médias seguidas de letras maiúsculas iguais nas linhas e minúsculas nas colunas não diferem entre si a 5% de significância pelo teste T.
of which some individuals (diameter <10 cm) were eliminated from the area. Such management reduces plant density and the leaf area of the woody layer to 40%, with a consequent reduction in leaf production (Pimentel, 2010) and consequent increase in the herbaceous layer. The total litter obtained with the two types of plant cover is within the range of variability for litter production in dry tropical forests. Studies indicate a range of between 1,100 to 9,150 kg ha-1
yr-1 respectively.
The greater conservation of ground litter in TC5
is probably associated with the higher contribution of lignified woody biomass during management application, and the consequent lower rates of decomposition. This result corroborates that of Lima et al. (2015), who found that the high levels of lignin and tannin in litter in the caatinga reduce the rate of decomposition. An inverse relationship between the lignin content of plant cover residue and decomposition were seen by Carvalho (2005); the higher the levels of lignin in the plant material, the lower the rates of decomposition, favouring the straw remaining on the ground. The greatest accumulation of lignified material in TC5 was due to the pruning (branches and thin twigs)
of woody individuals when applying the thinning management in December 2008, 2010 and 2012.
Greater deposition of ground litter in the TC5 fragment produces an efficient protective layer against the impact of raindrops on the soil surface, thereby reducing the risk of erosive processes (Silva et al., 2015), especially in the semi-arid region, which is characterised by intense rainfall of great erosive potential. The value for K found in RC35 (0.67) is very close to that obtained by Lopes et al. (2009) in the same area six years earlier (0.71), expressing the lack of change in decomposition rate in the preserved area during these five years. On the other hand, a lower value for the decomposition constant (K) under the TC5 management (0.35) shows that litter decomposition, use and cycling occur much more slowly in the area submitted to thinning, expressing changes in the decomposition process, which are due to adoption of this management. However, values for K seen in TC5 were close to those obtained by Lima et al. (2015)
in a dry tropical forest to the south of the caatinga biome. Those authors relate the low rate of decomposition seen to the high lignin and tannin content contained
in the litter under study, a behaviour also demonstrated by Heim and Schmidt (2007). Several factors are related to the decomposition of plant residue added to the soil, such as the characteristics of soil and climate, chemical composition of the residue, and management strategies (Heim and Schmidt, 2007).
The lower CO2 emissions in the area submitted
to thinning, irrespective of the period under study, day (91.4 mg m-2 h-1 CO
2-C) or night (84.6 mg m-2 h -1 CO
2-C), even when characterised by higher temperatures
and greater soil moisture, leads to the assumption that other factors than meteorological are more important to the dynamics of soil respiration. The lower rates of respirometry in TC5 when compared to RC35 can
be explained by the chemical composition of the organic matter deposited in TC5, as discussed above. In TC5,
there is a greater presence of lignified organic residue with smaller specific surfaces (trunks, branches), due to pruning of the woody layer, which is therefore more resistant to the decomposing action of microorganisms. The lignin makes the litter more resistant to chemical decomposition caused by fungi and bacteria, and the tannin makes the litter less palatable to certain groups of soil meso-macrofauna (Lima et al., 2015). Materials with low levels of lignin and polyphenols (leaf residue) display rapid mineralisation, a behaviour found in RC35,
providing large amounts of nutrients for the plant species. The presence of materials with a high lignin content helps form a stable mulch that can protect the soil against erosion, there being less nutrient cycling and CO2
production.
Confirming the above argument, values for CO2 production were lower than those found by Alves et al. (2006) and Araújo et al. (2009), who obtained mean values of approximately 239.5 and 120 mg m-2 h-1 CO
2
-C respectively when studying microbial activity by measuring soil respiration in fragments of dry tropical forest in the State of Paraíba. However, the similarity between day and night seen in this study differs from that obtained by the above authors, who found that the microbial activity estimated from the CO2 production was higher during the night.
very hard when dry and very sticky when moist (Bravo-Garza et al., 2009). A high clay content, mainly of active clays (2:1), presents deep cracks throughout the profile during the dry period and low rates of infiltration during the rainy periods, generating processes of soil expansion and contraction. According to Bronick and Lal (2005), disturbances in soil structure may result in a reduction in the seasonal flow of CO2, thereby reducing flow and the difference in concentration between day and night. It is known that the pore system is important in studying soil, as it is through the pores that the flow of water and gas exchange take place. Any change in this physical attribute of the soil helps to modify the flow of water and air, affecting the physical and biochemical processes that occur in the soil (Bronick and Lal, 2005).
5.CONCLUSIONS
The preserved area displayed the greatest deposition of litter, with the largest value recorded at the beginning of the dry season, in August, irrespective of management; Rates of litter decomposition are lower in the soil of the thinned area, which contributed to the greater conservation of organic residue on the soil surface in that area, a behaviour associated with the greater contribution of lignified woody biomass;
There is no difference in CO2 production between
the daytime and night-time periods, regardless of the management under study (preserved or thinned). The main cause of the lower CO2 emissions from the soil
to the atmosphere in the area under thinning was not the abiotic factors of the environment (temperature and humidity), but rather the chemical composition of the lignified residue deposited by the thinning, a material that is fairly resistant to the decomposing action of microorganisms.
This study points out that implementation of thinning in the caatinga biome can be seen as an alternative management to be considered in projects of sustainability in the semi-arid region. Instead of deforestation, and the potentially generation of desertification in these areas, the farmer can use this technique as a means of sustainable forest management.
6.REFERENCES
Aide TM, Clark ML, Grau HR, López-Carr D, Levy
MA, Redo D et al. Deforestation and reforestation of Latin America and the Caribbean (2001–2010). Biotropica. 2012;45(2):262-71.
Alves AR, Souto JS, Souto PC, Holanda AC. Aporte e decomposição de serapilheira em área de Caatinga, na Paraíba. Revista de Biologia e Ciências da Terra. 2006;6(2):194-203.
Araújo Filho JÁ, Carvalho FC, Garcia R, Sousa RA. Efeitos da manipulação da vegetação lenhosa sobre a produção e compartimentalização da fitomassa pastável de uma caatinga sucessional. Revista Brasileira de Zootecnia. 2002;31:11-9.
Araújo KD, Parente HN, Correia KG, Dantas RT, Andrade AP, Pazera Júnior E. Liberação de dióxido de carbono (CO2) em área de caatinga no
semiárido da Paraíba. Geoambiente (on line).2009;12:42-53.
Bleicher L, Sasaki JM. Introdução à difração de raio-x em cristais. Fortaleza: Universidade Federal do Ceará; 2000. 20p.
Brasil. Ministério do Meio Ambiente. Bioma Caatinga: contexto, características e estratégias de conservação. [acesso em: 24 de fev. 2014].
Disponível em: http://www.mma.gov.br/biomas/ Caatinga/item/191
Bravo-Garza MR, Bryana RB, Voroney P. Inûuence of wetting and drying cycles and maize residue addition on the formation of water stable
aggregates in Vertisols. Geoderma. 2009;151:150-6.
Bronick CJ, Lal R. Soil structure and management: a review. Geoderma. 2005;124:3-22.
Carvalho AM. Uso de plantas condicionadoras com incorporação e sem incorporação no solo: composição química e decomposição dos resíduos vegetais; disponibilidade de fósforo e emissão de gases [tese]. Brasília, DF: Universidade de Brasília; 2005.
Costa CCA, Camacho RGV, Macedo ID, Silva PCM. Análise comparativa da produção de serapilheira em fragmentos arbóreos e arbustivos em área de caatinga na FLONA de Açu-RN. Revista Árvore. 2010;34(2):259-65.
SM. Aporte de nutrientes pela serapilheira em uma área degradada revegetada com leguminosas arbóreas. Revista Brasileira de Ciência do Solo. 2004;28:919-27.
Coûteaux MM, Bottner P, Berg B. Litter
decomposition climate and litter quality. Trends in Ecology and Evolution. 1995;10:63-6.
Empresa Brasileira de Pesquisa Agropecuária – Embrapa. Sistema Brasileiro de Classificação de Solos. 3ª.ed. Rio de Janeiro: Embrapa Solos; 2013. 353p.
Gillespie T, Lipkin B, Sullivan L, Benowitz D, Pau S, Keppel G. The rarest and least protected forests in biodiversity hotspots. Biodiversity and Conservation. 2012;21(14):3597-611.
Grisi BM. Método químico de medição de respiração edáfica: alguns aspectos técnicos. Ciência e Cultura. 1978;30(1):82-8.
Guerreiro MJS, Andrade EM, Abreu I, Lajinha T. Variação de longo prazo dos índices de
precipitação no Estado do Ceará, Nordeste do Brasil. International Journal of Climatology. 2013;33(14):2929-39.
Heim A, Schmidt MWI. Lignin turnover in arable soil and grassland analysed with two different labelling approaches. European Journal of Soil Science. 2007;58:599-608.
Lima DA. The Caatingas dominium. Revista Brasileira de Botânica. 1981;4(2):149-63.
Lima RP, Fernandes MM, Fernandes MRM, Matricardi EAT. Aporte e decomposição da serapilheira na Caatinga no Sul do Piauí. Floresta e Ambiente. 2015;22(1):42-9.
Lopes JFB, Andrade EM, Lobato FAO, Palácio HAQ, Arraes FDD. Deposição e decomposição de serapilheira em área da Caatinga. Revista
Agro@mbiente On-line. 2009;3(2):72-9.
Olson JS. Energy storage and balance of production and decomposers in ecological systems. Ecology. 1963;44:322-57.
Palácio HAQ. Avaliação emergética de microbacias hidrográficas do semiárido submetidas a
diferentes manejos [tese]. Fortaleza: Universidade Federal do Ceará; 2011.
Palacios-Vargas JG, Castaño MG, Gómez AA, Martínez YA, Mejía RBE, Martínez SJ. Litter and soil arthropods diversity and density in a tropical dry forest ecosystem in Western Mexico.
Biodiversity and Conservation. 2007;16:3703-17.
Pimentel JVF. Caatinga e manejo agrossilvipastoril. In: Andrade EM, Pereira OJ, Dantas FER
organizadores. Semiárido e o manejo dos recursos naturais: uma proposta de uso adequado do capital natural. Fortaleza: Imprensa Universitária UFC; 2010. p.106-32.
Portillo QC, Sánchez AG. Extent and conservation of tropical dry forests in the Americas. Biological Conservation, 2010;143(1):144-55.
Rodrigues JO, Andrade EM, Mendonça LAR, Araújo JC, Palácio HAQ, Araújo EM. Respostas hidrológicas em pequenas bacias na região semiárida em função do uso do solo. Revista Brasileira de Engenharia Agrícola e Ambiental. 2013;17(3):312-8.
Salgado EV, Andrade EM, Hevia JN, Nunes EP, Rodrigues MMA. Rainfall patterns and the contribution of litter in the caatinga dry tropical forest. Revista Ciência Agronômica.
2015;46(2):299-309.
Silva VN, Souto LS, Dutra Filho JÁ, Souza TMA, Borges CHA. Deposição de serapilheira em uma área de caatinga preservada no semiárido da Paraíba, Brasil. Revista Verde. 2015;10(2):21-5.
Souto PC. Acumulação e decomposição de serapilheira e distribuição de organismos edáficos em área de Caatinga na Paraíba, Brasil [tese]. Areia: Universidade Federal da Paraíba; 2006.
Swift MJ, Heal OW, Anderson JM. Decomposition in terrestrial ecosystems. London: Oxford,
Blckwell Scientific Publications; 1979. (Studies in Ecology, 5)
Wardle DA. Changes in the microbial biomass and MQ during leaf litter succession in some New Zealand forest and shrubland ecosystems. Functional Ecology. 1993;7:346-55.