www.scielo.br/rbg
ESTIMATION OF CRUSTAL VERTICAL MOVEMENTS DUE TO ATMOSPHERIC
LOADING EFFECTS BY GPS OBSERVATIONS
Erica Patias Rodrigues
1,2,3Recebido em 5 outubro, 2006 / Aceito em 19 marc¸o, 2007 Received on October 5, 2006 / Accepted on March 19, 2007
ABSTRACT.The objective of this paper is the estimation of vertical movements of the Earth’s crust using data of 45 GPS permanent stations network situated in Europe and North of Asia (Siberia). First, daily positions are calculated with the GAMIT processing GPS data software, developed in the Massachusetts Institute of Technology, for a period of approximately 500 days (November and December 2000, the entire year of 2001 and January and February of 2002). Each daily solution is stabilized in a reference frame with the implication of a similitude transformation in the GLOBK software, also developed in the MIT, with the Kalman filter. The crust deforms vertically due to different phenomena (earthquakes, landslides. . .). We focused in this project the effects caused by the atmospheric loading, it means the effects of the weight of the air’s column which surrounds the GPS stations. This loading is calculated for a 2.5◦× 2.5◦resolution grid, with meteorological data provided of ECMWF (European Centre for Medium-range Weather Forecasts). The amplitude of these loadings is in the order of few millimetres up to 3 centimetres (Schuh et al., 2003). Finally we compare the vertical GPS permanent stations positions with the vertical movements of the Earth’s crust due to atmospheric loading. We observed for some sites in Siberia a predominant effect during winter in the vertical component. For example, for IRKT station (Irkust, Russia) the correlation value for the year of 2001 is 0.61.
Keywords: atmospheric loading, Global Positioning System, vertical movements.
RESUMO.Este estudo tem por objetivo determinar o movimento vertical da crosta terrestre a partir de observac¸ ˜oes de uma rede de 45 estac¸˜oes GPS permanentes situadas na Europa e ao norte da ´Asia (Sib´eria). Em uma primeira etapa, as posic¸˜oes di´arias s˜ao calculadas com o software de tratamento de dados GPS GAMIT, desenvolvido no MIT (Massachusetts Institute of Technology), para um per´ıodo de aproximadamente 500 dias (de novembro de 2000 at´e fevereiro de 2002). Cada soluc¸˜ao di´aria ´e ent˜ao estabilizada num referencial atrav´es do emprego de uma transformac¸˜ao espacial, etapa realizada atrav´es de filtro de Kalman com software GLOBK, desenvolvido tamb´em no MIT. O desvio padr˜ao m´edio obtido para as posic¸˜oes verticais para o ano de 2001 ´e de sete mm. O solo se deforma verticalmente devido `a ac¸˜ao de diversos fenˆomenos (terremotos, deslizamentos, entre outros). Neste trabalho interessa-se particularmente aos efeitos causados pela atmosfera, ou seja, os efeitos do peso da coluna de ar que rodeia uma regi˜ao que engloba estac¸˜oes GPS. Essa carga atmosf´erica ´e calculada em uma malha de resoluc¸˜ao de 2.5◦a partir de dados meteorol´ogicos mundiais (ECMWF, European Centre for Medium-range Weather Forecasts). A amplitude dessas cargas ´e da ordem de alguns mil´ımetros a trˆes cent´ımetros (Schuh et al., 2003). Finalmente comparam-se as posic¸˜oes verticais das estac¸˜oes GPS (s´eries temporais) com o movimento vertical da crosta terrestre devido aos efeitos das cargas atmosf´ericas. Foi observado, para certas estac¸˜oes da Sib´eria, um efeito predominante no inverno nas componentes verticais. Por exemplo, para a estac¸˜ao IRKT (Irkust, R´ussia), o valor de correlac¸˜ao ´e 0.61 para o ano de 2001.
Palavras-chave: carga atmosf´erica, GPS, movimentos verticais.
1Universidade Federal do Paran´a, Departamento de Geom´atica, Centro Polit´ecnico, Jardim das Am´ericas, Caixa Postal 19001, 81531-990 Curitiba, PR, Brasil. Tel./Fax: (041) 3361-3161 – E-mail: eri [email protected]
2Universit´e Louis Pasteur, Ecole et Observatoire des Sciences de la Terre, Institut de Physique du Globe de Strasbourg, 5 Rue Ren´e Descartes, 67084, Strasbourg, France. Telefone: +33 (03) 9024-0559; Fax: +33 (03) 9024-0125.
3Institut National de Sciences Appliqu´ees, D´epartement Topographie, 24 Boulevard de la Victoire, 67084, Strasbourg, France. Telefone: +33 (03) 8814-4700; Fax: +33 (03) 8814-4799.
be modelled by mathematical functions based on global surface pressure data. These vertical displacements can amount up to centimetre order, principally at continental mid-latitude stations.
The space geodetic techniques, such as GPS (Global Positio-ning System), evolved into the monitoring of permanent stations, making it possible to determine a position with millimetre preci-sion. These observations, carried out in a continuous way, allow detecting low deformations of the Earth’s crust. Knowing the verti-cal component of the global deformation of the crust, for example the one induced by atmospheric loading, is fundamental for the precise determination of the vertical movements as general.
Several studies trying to detect pressure loading signals in height estimates have been performed during the last ten years: Van Dam & Herring (1994), Mac Millan & Gipson (1994), Haas et al. (1997), Scherneck (2000), Van Dam et al. (2001) and Petrov & Boy (2004).
In this project, we choose to work with a distributed network processing strategy that includes 45 stations (Figure 1) in Europe and Northern Asia, particularly in Siberia. The network includes stations from IGS (International Global Navigation Satellite Sys-tem Service) and REGAL (REseau Gps permanent dans les ALpes) networks.
ATMOSPHERIC LOADING
The vertical displacement of a site is produced by the pressure deformation of the surface surrounding the site. The atmosphere constitutes one of the mainly perturbations sources that causes surface’s displacement. These deformations can be computed and modelled by mathematical functions.
Pressure loading effects are larger at higher latitudes due to intensive weather systems presented. At mid-latitudes, as at loca-tions near to the sea or ocean, the effects are smaller, due to the
in-Medium-range Weather Forecasts) pressure data. The surface pressure is convolved using Green’s functions to generate the deformation at each node of a 2.5◦× 2.5◦grid. The Green’s func-tion represents surface displacements corresponding to the po-tential induced by the atmospheric loading which acts in a point whose coordinates (latitude and longitude) are known.
The details of the technique used to model the pressure loa-ding effects by convolving the atmosphere data with the Green’s function are well described in Petrov & Boy (2004).
Estimating crustal vertical movements with GPS Atmospheric pressure and other kinds of loading (hydrological, snow coverage, soil humidity, etc.) are known to generate noise in GPS vertical time series. This means that GPS technique is powerful for determining vertical displacements of the solid Earth. For all these different kinds of loading signals, the vertical dis-placements are 3 to 10 times larger than the horizontal ones. Therefore when interpreting geodetic data, it is necessary to eva-luate the effects of these loadings.
The observations collected by GPS technique allow the study the Earth’s dynamics in a global scale. In many regions of the world, GPS permanent networks were established to monitoring the crust’s deformations in a local scale.
The GPS data, including REGAL and IGS networks, were pro-cessed using GAMIT/GLOBK that is an analysis software package developed at MIT (Massachusetts Institute of Technology), for the estimation of three-dimensional relative positions of ground stations and satellite orbits.
First, GPS station coordinates for each day of data are proces-sed into loosely constrained solutions with GAMIT. That means that neither the coordinates of the tracking sites nor the GPS sa-tellites orbits are tightly constrained. Although baseline lengths
Figure 1 – 45 GPS stations network (Europe and Asia).
Figure 2 – Annual amplitude map (mm) of vertical crustal deformation due to atmospheric pressure for 2001 (data
from National Centre for Environmental Prediction – USA, Mangiarotti et al., 2001).
are determined very precisely in the loosely constrained soluti-ons, the entire GPS network and GPS constellation can be rotated and translated as a rigid body.
The strategy, already studied as the best choice for the cal-culus (Bertrand, 2003), includes an elevation cut-off angle of 15 degrees, sessions of 24 and 6 hours and one tropospheric zenith delay parameter every 2 hours.
After all the loosely constrained solution are transformed into a consistent reference frame (ITRF2000, which became the
offi-cial IGS reference frame from beginning on GPS week 1253 – 01/11/2004) so that we can derive rates of deformation from the time series of the station’s coordinates. The reference frame defi-nes the origin, scale and orientation of our geodetic coordinates. To validate our solutions, they were compared to another two existing solutions for the common stations. Comparing our so-lutions to REGAL’s soso-lutions, for example, we found differen-ces in the order of few millimetres. For the common stations, the mean difference for the north component was –0.06 mm
correlation with the coordinate repeatability.
For coastal and island sites, because of a strong contribution of the oceanic loading and the weak variation of the atmosphe-ric pressure, the visual correlation is very poor. In these sites, the variance of the atmospheric loading effect is too small com-pared to the variance of the ocean loading effect, to have a sig-nificant impact on the time series of the GPS vertical position observations.
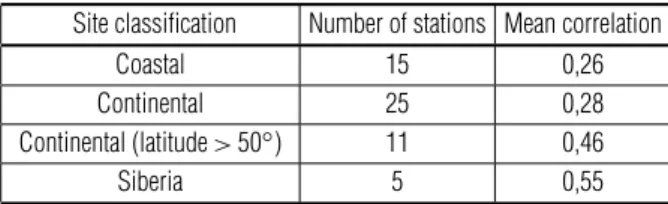
We can make an analysis more detailed of the results of cor-relation, classifying the station by latitude and region (Table 1). We conclude that time series for stations in Siberia have high cor-relation with the atmospheric model, as the stations in high lati-tudes (above 50◦). The correlation values for coastal stations are weak; it can be explained by other loading effects that are present is this regions, as oceanic loading. In continental stations there are various factors that can be disturbing, as snow covering and soil moisture.
Table 1 – Station classification and mean correlation for each group.
Site classification Number of stations Mean correlation
Coastal 15 0,26
Continental 25 0,28
Continental (latitude> 50◦) 11 0,46
Siberia 5 0,55
For the year of 2001, we observe that 25% of the stations have a correlation coefficient with the atmospheric loading model over 0.35. The highest values of correlation appear in the northern latitudes, especially in Siberia.
CONCLUSIONS
The redistribution of ocean, atmospheric and hydrological masses may cause vertical displacements up to 20 mm in mid-latitudes,
The atmospheric loading effects were modelled by a point approach in which a 2.5◦× 2.5◦grid resolution surface, convol-ved with Green’s functions. The meteorological data is provided by the ECMWF (European Centre of Medium-range Weather Fo-recasts), available for a 6-hour temporal sampling and includes pressure, temperature and humidity data. For the year of 2001 we observe, for whole Earth, a maximum displacement of approxi-mately 4 mm due to atmospheric loading, in continental Northern European sites.
GPS signals propagation is induced by atmosphere and its dynamic processes. We can see that analysing the correlation between GPS coordinate time series and atmospheric loading modelling. The vertical component is the most affected by the changing conditions of the atmosphere. The changing tempera-ture between seasons during the year influencing the humidity of the atmosphere may induce strong annual and seasonal variati-ons in the troposphere’s delay and thus a strong anomaly in GPS solutions.
The GPS data was processed with GAMIT/GLOBK software, with a defined strategy of processing. The loose constrained solutions obtained with GAMIT were used as input pseudo-observations to GLOBK and stabilized in a reference frame defined by some IGS stations in the ITRF2000. The final mean RMS ob-tained for the GLOBK calculated positions for the year 2001 for all the 45 stations was approximately 7 mm.
The GPS permanent networks allow reaching a sufficient tem-poral resolution to detect transitory geophysics signals. The re-sults demonstrate that global continuous GPS observations are able, in some regions better than in another, to detect seasonal signals, for example for the atmospheric loading. The larger cor-relation coefficients appear mainly in the high latitude northern hemisphere above 45◦.
Figure 3 – ARTU GPS vertical position and vertical loading for atmosphere, snow and soil humidity.
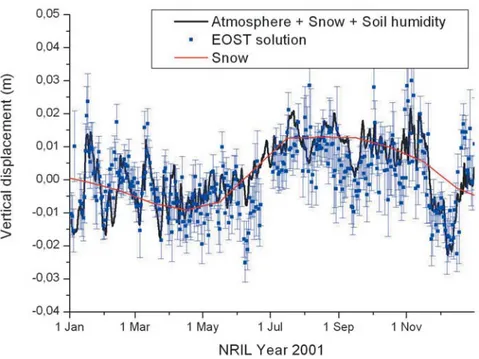
Figure 4 – NRIL GPS vertical position and addition of vertical loading (atmosphere, snow and soil humidity) and snow.
vertical positions and the atmospheric loading modelling was calculated by the correlation coefficient for the entire network. The minimum value for correlation encountered for the year of 2001 was for an European continental station CHRN (Chˆateau Renard, France), 0.06, and the maximum coefficient was for a Siberian station, ARTU (Arti, Russia), 0.65.
It was observed for some continental sites a high correlation between vertical GPS position and atmosphere loading model. The higher correlation values result for stations at high northern latitudes which are exposed to large pressure variations and to a dry atmosphere for some period of the year. The analysis of the processed stations in Siberia (IRKT, NVSK, ARTU and KSTU)
Some sites a very high correlation value between the GPS ver-tical position time series and the atmospheric loading model, like the site Irkust in Russia. For this site, for the year of 2001, the correlation value for the vertical position was 0.61. For another example, for a site called MARS (Marseille, France), which is a coastal site, the correlation value for the same period, was 0.16. For continental sites, as for example STJ9 (Strasbourg, France), also for the same period, this value reaches 0.23.
Therefore, according to the results of this study, it is important to introduce corrections related to vertical displacements due to atmospheric loading for high precision GPS network processing. Also, a suggestion for further studies is to model ocean loading and have a better insight for coastal stations.
ACKNOWLEDGEMENTS
I would like to thank the financial support of CAPES which allowed me to develop this project during my program of inter-change (BRAFITEC, 2004-2005) in Strasbourg, France. I also thank my advisors Gilbert Ferhat, Jean Paul Boy and Pascal G´egout for their patient and continuous discussion. And finally thank also Jacques Hinderer for all support during my stay in the “Institut de Physique du Globe de Strasbourg”.
Parameters from very long baseline interferometry observations. Journal of Geophysical Research, 99(B9): 18081–18087.
MANABE S, SATO T, SAKAI S & YOKOYAMA K. 1991. Atmospheric Loading Effect on VLBI Observations. Conference on Geodetic VLBI: Monitoring Global Change. Published on CD-ROM by NASA. MANGIAROTTI S, CAZENAVE A, SOUDARIN L & CRETAUX JF. 2001. Annual vertical crustal motions predicted from surface mass redistribu-tion and observed by space geodesy. Journal of Geophysical Research, 106(B3): 4277–4292.
PETROV L & BOY JP. 2004. Study of the atmospheric pressure loading signal in very long baseline interferometry observations. Journal of Geo-physical Research, 109: B03405, doi:10.1029/2003JB002500. SCHERNECK HG, HAAS H & LAUDATI A. 2000. Ocean Loading Tides for and from VLBI. First IVS General Meeting. K¨otzting. p. 257–262. SCHUH H, ESTERMANN G, CRETAUX J-F, BERGE-NGUYEN M & VAN DAM T. 2003. Investigation of Hydrological and Atmospheric Loading by Space Geodetic Techniques. International Workshop on Satellite Alti-metry. Berlin. p. 123–132.
VAN DAM TM & HERRING TA. 1994. Detection of Atmospheric Pressure Loading using Very Long Baseline Interferometry Measurements. Jour-nal of Geophysical Research, 99(B3): 4505–4518.
VAN DAM T, WAHR J, MILLY PCD, SHMAKIN AB, BLEWITT G, LAVAL-LEE D & LARSON KM. 2001. Crustal Displacements due to Continental Water Loading. Geophysical Research Letters. 28(4): 651-654.
NOTE ABOUT THE AUTHOR
Erica Patias Rodrigues. She obtained her diploma in Cartographic Engineering (UFPR/Brazil/2005) and spent one year studying Cartography in theInstitut National des Sciences Appliqu´ees(INSA Strasbourg) and developed this research in Geophysics in theInstitut de Physique du Globe (Ecole et Observatoire des
Sciences de la Terre) in Strasbourg, France. Actually she develops her master in Geology and Geophysics in UNICAMP (2006) and works with Geodesy and Geographic Information Systems in Petrobras.