Spectral regionalization of tropical soils in the estimation of soil attributes
1Regionalização espectral de solos tropicais na estimativa dos atributos do solo
José A. M. Demattê2*, Henrique Bellinaso3, Suzana Romeiro Araújo2, Rodnei Rizzo2 and Arnaldo Barros Souza2
ABSTRACT -Conventional soil analysis produces large amount of residues and demand resources and time consuming. The construction of soil spectral database for estimating soil attributes is the newest alternative on soil mapping. The objective in this study was to build spectral libraries and study the quality of the generated prediction models for soil attributes. It was obtained 7185 soil spectral (400-2500 nm) in laboratory with respective soil analysis. The spectral libraries “general”, “regional”, and “local” were generated from these spectral readings. The general spectral library contained the full range of data and several states, the regional libraries contained data from geographically close municipalities, and the local libraries contained soil data from a single municipality. In general we observed the sequence of R² for General (0.85), Regional (0.67 to 0.77) and Local (0.55 to 0.77). In conclusion, the best database was the general one. On the other hand, independent of the size of the database, predictive models based on physical attributes such as sand, clay, and organic matter generate good predictions until an R2 of 0.7. The determination of spectral libraries including highly variable soils formed from different parent materials
create worse results for the estimation of chemical attributes and better results for the estimation of the physical ones. The low range of variation in a given attribute was a limiting factor in the generation of effective predictive models. A great spectral library can certainly improve soil quantitative evaluation.
Key words:Spectroradiometry. Soil analysis. Spectral library. Soil mapping. Databank.
RESUMO - As análises convencionais de solo produzem grandes quantidades de resíduos e demandam muito tempo e
recursos. A construção de bancos de dados espectrais para estimar atributos do solo é uma alternativa em mapeamento de solos. Objetivou-se neste estudo construir bibliotecas espectrais e estudar a qualidade dos modelos de predição de atributos do solo gerados. Obtiveram-se 7185 espectros de solo (400-2500 nm) em laboratório, cada um com as respectivas análises de solo. As bibliotecas espectrais “Geral”, “Regionais” e “Locais” foram geradas a partir dessas leituras espectrais. A biblioteca espectral “Geral” contém toda a gama de dados e vários estados, as Regionais contêm dados de municípios geograficamente próximos, e as Locais contêm dados do solo de um único município. Em geral, observou-se a seqüência de R² para Geral (0,85), Regional (0,67-0,77) e Local (0,55-0,77). Em conclusão, o melhor banco de dados foi o Geral. Por outro lado, independente do tamanho do banco de dados, com base em modelos de previsão de atributos físicos, tais como a areia, argila e matéria orgânica, obteve-se bons prognósticos, até R2 de 0,7. A determinação de bibliotecas espectrais incluindo solos altamente variáveis formados a partir
de diferentes materiais de origem produziu resultados piores para a estimativa de atributos químicos e melhores resultados para a estimativa de atributos físicos. A baixa amplitude de variação em um determinado atributo foi um fator limitante na geração de modelos preditivos eficazes. Uma grande biblioteca espectral pode certamente melhorar a avaliação quantitativa do solo.
Palavras-chave:Espectrorradiometria. Análise do solo. Biblioteca espectral. Mapeamento de solo. Banco de dados.
*Autor para correspondência DOI: 10.5935/1806-6690.20160071
1Recebido para publicação em 19/02/2015; aprovado em 20/12/2015
Parte da Dissertação de Mestrado do segundo autor apresentada ao Programa de Pós-Graduação em Solos e Nutrição de Plantas, Departamento de Ciência do Solo, Escola Superior de Agricultura “Luiz de Queiroz”/ESALQ/USP
2Departamento de Ciência do Solo, Universidade de São Paulo, Av. Pádua Dias, 11, Postal Box 9, Piracicaba-SP, Brasil, 13.418-900, jamdemat@
usp.br, suzanaromeiro@yahoo.com.br, rodnei.rizzo@gmail.com, souza.arnaldobarros@usp.br
INTRODUCTION
Agricultural planning requires detailed information about soil attributes. However, this diagnosis by routine analysis is often expensive, time consuming and generate large amounts of potentially toxic residues. Due to this and the growing demand for rational use of natural resources, Changet al. (2001) highlight the need to develop techniques that meet the needs of land use planning on a large scale.
Thus, reflectance spectroscopy has emerged as an promising alternative method for estimating various
soil properties (SORIANO-DISLA et al., 2014). This
technique is based on the spectral behavior of a single attribute interacting with a specific wavelength of the electromagnetic radiation (EMR). The incident energy on the target can promote the transition of electrons in inter or intra-atomic and/or stretching and/or bending levels of structural groups, characterizing the spectral
response of the target (GENOT et al., 2011). The
characteristics of repeatability and reproducibility of the spectroscopic technique, associated with the accuracy of the method make it a reliable reference method (GENOT et al., 2011).
However, the organization and exhaustive study of spectroscopy applied to soils need to be developed properly in order to achieve the level of reliability required for the implementation of the technique (VISCARRA-ROSSEL; CHEN, 2011). This requires complex statistical methods for modeling and validation of the results, being more robust the greater the scope of the database reference (GOMEZ; VISCARRA-ROSSEL; MCBRATNEY, 2008). According to Longleyet al. (2013), the quality of geographic analysis is limited by the quality of the database used and by modeling data from which it derives. Thus, the application of spectroscopic techniques in soil science is subject to extensive and efficient characterization and registration of the spectral response of soil samples in
spectral libraries (VISCARRA-ROSSEL et al., 2008).
In this aspect, spectral libraries are the ultimate goal on preparing the field for future soil analysis. The point is that, despite quantification papers are largely studied, there are few relating with spectral regionalization. In fact, there are still doubts about how to use the spectral libraries on which are the best, local or regional.
The objective of this study was to evaluate the quality of predictive models for soil attributes generated from spectral libraries (obtained in the laboratory in the VIS-NIR region) containing different ranges and quantities of data. Thehypothesize is that regional spectral libraries (within the same geological and climatic zone) will bring better predictive models than a single, general library.
MATERIALS AND METHODS
Soil samples were collected from areas in the states of São Paulo, Minas Gerais, Goiás, Amapá and Mato Grosso do Sul (Figure 1). In total, 7185 soil samples were collected from horizons of morphologically described soil profiles and from boreholes at depths of 0-20, 40-60,
and 80-100 cm (SANTOSet al., 2013).
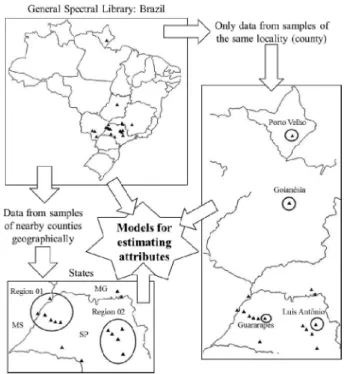
Figure 1 - Construction of Spectral Libraries
The following values were determined or calculated: organic carbon (O.C.), organic matter (O.M.), P, K, Ca, Mg, Al, and H+Al content; hydrogenionical potential in CaCl2 solution (pHCaCl2); sum of bases (SB); cation exchange capacity (CEC); base saturation (V%); and aluminium saturation (m%) (RAIJ, 2001). In addition, the total sand, silt, and clay fractions were determined
(CAMARGOet al., 1986).
Spectral data were obtained in the laboratory with a FieldSpec Pro spectroradiometer (Analytical Spectral Devices, Boulder, Colo.). This instrument has a sensor with a spectral resolution of 1 nm for wavelengths from 350 to 1100 nm and 2 nm for wavelengths from 1100 to 2500 nm. For the collection of reflectance data, samples corresponding to a volume of approximately 15 cm3 of soil
were dried in an oven at 45 oC for 24 h (HENDERSON
Table 1 - Characterization of Spectral Libraries
sample was placed in a petri dish for sensor reading. The reflectance of each sample was given by the average of 100 sensor readings. The point of light capture of the equipment (the opening of the fiber optic cable) was placed in a vertical position 8 cm from the sample to measure the light reflected by an area of approximately 2 cm2 in
the center of the sample. The light source used was a 50 W halogen lamp with a non-collimated beam at the target surface. The light source was positioned 35 cm from the sample with a zenith angle of 35º. A white spectralon plate was used as the reference standard for 100 % reflectance.
Construction of spectral libraries
From the total spectral data collected, the following distinct databases, or spectral libraries (SLs), were derived: the General SL, which contained all of the collected spectral data; Regional SL 01 and Regional SL 02; and local SLs for Guararapes-SP, Porto Velho-AP, Goianesia-GO, and Luis Antonio-SP. Table 1 summarizes the different SLs and Figure 1 illustrates their construction.
Treatment of spectral data and statistical analysis
All reflectance data were pre-processed to improve the stability of the regressions. Absorbance values (1/R) were log transformed and transformed data were centralized around the average. Statistical analysis of the laboratory data was performed using SPSS 11.0. The mean, standard deviation, maximum value, and minimum value were calculated for each attribute.
A principal component analysis (PCA) of the spectral data was performed using the program Unscrambler 9.7. The PCA results indicate the soil variability within each spectral library.Due to the large quantity of spectral data included in the General SL (7185), it was necessary to perform a representative
Spectral Libraries (SL) Number of Spectral data Region (counties) Number of samples for calibration
Number of samples for validation
General 7185 All regions (counties) 4790 2395
Regional 01 3093
Guararapes-SP, Valparaíso-SP, Mirandópolis-SP, Andradina-SP, Três Lagoas-MS e Aparecida do
Taboado-MS
2063 1030
Regional 02 903 São Carlos-SP, Piracicaba-SP, Matão-SP,
Araraquara-SP e Luis Antonio-SP 603 300
Local of Guararapes-SP 843 Guararapes-SP 562 281
Local of Luis Antonio-SP 563 Luis Antonio-SP 375 188
Local of Porto Velho-AP 621 Porto Velho-AP 414 207
Local of Goianésia-GO 541 Goianésia-GO 361 180
sampling of the data to develop predictive models. The computational program Conditioned Latin Hypercube Sampling (cLHs) was used for sampling (MINASNY; MCBRATNEY, 2006).
Calibration and validation of spectral models and quantification of attributes
For each SL, a subset of the data was used for development and calibration of the predictive models and the remainder of the data was used for subsequent validation (test samples) (Table 1). The chemometric program Unscrambler 9.7 was used to generate predictive models (calibration phase). The partial least squares regression (PLS) and projection on latent structures regression (PLSR) modules included in this program were used to develop the models. PLS regressions have been widely used and perform well in the estimation of soil attributes based on spectral behavior (VASQUES;
GRUNWALD, 2008; VISCARRA-ROSSELet al., 2008;
ZORNOZAet al., 2008).
To calibrate the model for each of the attributes, the number of PLS factors was chosen using the results of the model validation as criteria (validation phase). During the validation phase, each model was evaluated based on the coefficient of determination (R2) , the root mean
square error (RMSE) (Equation 1), the mean error (ME or bias) (Equation 2), the standard error of the mean (SEM or SDE) (Equation 3), and the ratio of prediction deviation (RPD) (WILLIANS, 1987):
(1)
Figure 2 - Principal Components Analysis of General, Regional and Local Spectral Libraries
(3)
Where i indicates the values estimated by the model,
yi indicates the observed values, and N is the number of observations of the variable to be modeled. The difference between the observed value (reference value) and the predicted value is called the residual.
The RPD is the ratio of the standard deviation of the reference data to the RMSE for the model validation. The ME is the mean of the residuals and indicates whether a model overestimates or underestimates the values of the attribute. The SDE is the standard deviation of the residuals, where high values of SDE indicate that the model predicts some of the test samples well and predicts others poorly. The results of these figures of merit were analyzed as described in literature (CHANGet al., 2001; DUNNet al., 2002; SAYES; MOUAZEN; RAMON, 2005).
RESULTS AND DISCUSSION
Principal Component Analysis (PCA)
The SLs showed great variability of soils (Figure 2) because data came from different regions and different parent materials. The Principal Component one (PC1)
was correlated with the albedo of the samples (GALVÃO; PIZARRO; EPIPHANIO, 2001) while the PC2 represents the curve shape. Samples with greater reflectance had lower PC1 scores. Reflectance is a function of the levels of Fe2O3, sand, clay, and organic matter and the presence of opaque minerals (BELLINASO; DEMATTÊ; ARAUJO, 2010). These attributes are related to the soil class and parent material of each sample. Therefore, SLs with high variation in PC1 scores showed high variability of soils formed by different parent materials. SLs with low variability of soils formed from the same parent material showed tighter clustering of points in the graph of PC1 vs. PC2 (Figure 2).
Regional SL 01 encompassed less variability of soils than Regional SL 02, as indicated by the lesser variation in PC1 scores. The data that made up Regional SL 01 represented regions in close geographic proximity where most soils were derived from sandstones. Regional SL 02 also encompassed data from geographically proximate regions, but the soils were derived from a greater variety of parent materials, including volcanic rocks, siltstones, argillites, and even sandstones.
greater variation in the levels of clay and sand (Table 2). This region also showed high variation in PC1 scores.
Statistical analysis of reference data
The Goianesia-GO and Guararapes-SP SLs and Regional SL 01 showed a smaller range of variation in
Table 2 - Statistical analysis of the attributes for General, Regional and Local Spectral Libraries
Statistical parameter
Soil Attribute
Sand Silt Clay O.M.* O.C. P K Ca Mg Al H+Al SB CEC V m
pH CaCl2 ---g kg-1--- --- mg kg-1 --- --- mmol
c kg-1 --- %
---General Spectral Library
Mean 523 83 392 13.7 7.9 4.4 1.3 13.1 4.9 3.5 26.1 20.9 46.9 41.0 21.7 4.7
SD 274 54 252 7.9 4.5 6.1 1.5 12.0 4.2 4.7 15.6 19.6 25.1 22.5 25.6 0.6
min 0.0 2.0 68 2.0 1.2 1.0 0.1 1.0 0.1 0.0 1.0 2.1 8.1 4.0 0.0 3.3
max 910 360 960 39.0 22.1 54.0 9.8 65.0 28.0 32.0 105 134 162 95.0 96.0 6.3 Regional Spectral Library 01
Mean 746 70 182 10.4 6.0 3.5 1.5 1.5 4.1 3.4 17.7 16.3 34.5 46.0 23.4 4.6
SD 70 31 55 4.8 2.8 3.4 1.2 1.2 2.7 3.8 7.4 10.6 11.9 21.6 27.4 0.6
min 540 0.0 40 1.0 0.5 1.0 0.1 0.1 1.0 0.0 1.0 2.1 7.5 5.0 0.0 3.3
max 920 185 350 26.0 15.1 23.0 23 6.7 14 16 42.0 53.3 75.9 98.0 87.0 6.4 Regional Spectral Library 02
Mean 488 78 433 15.4 8.9 5.7 0.9 11.5 3.8 2.7 29.1 16.3 46.0 33.3 20.3 x
SD 251 49 215 7.3 4.3 8.6 1.2 9.9 2.8 3.0 12.0 12.9 19.7 18.2 23.7 x
min 0.0 2.0 78 2.0 1.2 1.0 0.1 1.0 1.0 0.0 5.0 2.1 14.4 4.0 0.0 x
max 904 230 860 37.0 21.5 51.0 8.2 56.0 56.0 23.0 66.0 66.9 109 95.0 92.0 x Spectral Library of Porto Velho - AP
Mean 491.4 40 468 13.5 7.8 1.8 0.5 2.0 1.2 4.4 25.9 3.9 30.0 14.4 47.0 4.56
SD 151.9 16 152 7.0 4.1 0.9 0.6 1.3 0.5 3.6 11.9 2.0 12.3 7.6 21.4 0.39
min 130.0 20 80 2.0 0.0 1.0 0.1 1.0 1.0 1.0 7.0 2.1 9.1 3.0 1.0 3.6
max 880.0 80 810 33.0 19.2 5.0 2.3 7.0 4.0 15.0 63.0 11.2 65.1 39.0 88.0 5.6 Spectral Library of Guararapes - SP
Mean 744 66 187 8.0 4.6 4.2 1.3 12.9 4.7 1.2 17.9 19.2 37.4 50.6 7.5 5.1
SD 68 33 51 3.9 2.2 4.3 1.5 5.6 2.3 1.4 5.0 7.7 9.3 12.6 9.8 0.61
min 540 3 69 3.0 1.7 1.0 0.1 2.0 1.0 0.0 10.0 3.0 20.0 14.0 0.0 3.8
max 890 188 306 20.0 11.6 30.0 7.8 33.0 14.0 6.0 34.0 47.0 72.0 80.0 44.0 6.6 Spectral Library of Goianésia - GO
Mean 229 109 660 18.2 10.8 16.4 1.9 22.2 7.8 0.7 30.7 31.6 63.8 47.5 4.6 x
SD 80 51 100 9.8 5.8 9.5 3.4 16.4 6.3 1.2 13.7 22.0 28.6 22.0 9.1 x
min 50 20 390 4.0 2.3 1.0 0.1 1.0 1.0 0.0 3.0 2.1 17.3 6.0 0.0 x
max 470 300 890 46.0 26.7 88.0 22 93.0 32.0 6.0 72.0 109 28.6 99.0 46.0 x Spectral Library of Luis Antonio - SP
Mean 403 92 509 17.6 10.2 5.7 0.8 12.1 3.5 2.2 30.2 16.9 47.8 32.7 16.9 4.95
SD 263 56 221 8.4 4.9 6.8 0.9 10.6 2.6 2.3 11.3 14.2 21.9 16.7 21.6 0.50
min 10 20 100 4.0 2.3 1.0 0.1 1.0 1.0 0.0 5.0 2.1 17.4 6.0 0.0 4.0
max 860 230 860 39.0 22. 35.0 5.3 51.0 13.0 10.0 61.6 112 112 78.0 80.0 6.1 *O.M.: organic matter; SB: sum of bases; CEC: cation exchange capacity; V: base saturation; m: aluminum saturation; x: there is no data
Table 3 -Internal validation of the calibration models generated by General, Regional and Local Spectral Libraries
¹R²: coefficient of determination; RMSE: root mean square error; NF: number of factors *O.M.: organic matter; SB: sum of bases; CEC: cation exchange capacity; V: base saturation; m: aluminum saturation; x: there is no data
Statisical parameter¹ Sand Silt Clay O.M.* O.C. P K Ca Mg Al H+Al SB CEC V pH CaCl2
m --- g kg-1--- --- mg kg-1--- mmol
c kg-1 % %
General Spectral Library
R2 0.89 0.56 0.88 0.66 0.65 0.26 0.30 0.49 0.40 0.39 0.60 0.52 0.73 0.49 0.42 0.50
RMSE 93.93 37.03 90.3 4.69 2.69 5.08 0.87 8.77 3.57 4.05 10.92 11.84 14.16 16.4 0.43 13.4
NF 21 22 20 22 22 22 20 23 18 24 24 25 25 25 24 25
Regional Spectral Library 01
R2 0.68 0.43 0.71 0.62 0.62 0.40 0.50 0.69 0.56 0.66 0.57 0.71 0.71 0.66 x 0.71
RMSE 39.4 24.79 28.44 2.87 1.67 2.42 0.87 4.16 1.76 2.31 5.04 5.58 6.49 12.75 x 15.1
NF 22 25 22 20 20 24 25 25 22 25 25 25 23 25 x 24
Regional Spectral Library 02
R2 0.84 0.63 0.84 0.66 0.66 0.31 0.18 0.37 0.36 0.41 0.46 0.38 0.46 0.24 x 0.40
RMSE 102.1 34.35 85.1 4.17 2.43 6.91 1.40 9.29 2.61 2.62 8.25 12.17 14.60 18.77 x 18.93
NF 19 18 20 17 17 16 10 10 10 18 19 11 11 9 x 16
Spectral Library of Porto Velho - AP
R2 0.85 0.32 0.89 0.62 0.62 0.25 0.64 0.45 0.14 0.61 0.61 0.49 0.61 0.45 x 0.52
RMSE 62.6 12.65 53.5 4.48 2.60 0.81 0.36 1.02 0.62 2.18 7.38 1.45 7.75 5.65 x 15.21
NF 19 16 19 16 16 14 17 15 9 16 15 15 16 14 x 14
Spectral Library of Guararapes - SP
R2 0.76 0.28 0.76 0.76 0.76 0.49 0.62 0.77 0.64 0.52 0.62 0.77 0.77 0.70 0.69 0.50
RMSE 33.07 30.45 24.7 1.87 1.09 3.00 0.80 3.05 1.47 1.04 3.02 4.24 4.95 7.87 0.35 7.24
NF 14 11 17 16 16 20 25 21 24 25 20 19 14 24 21 21
Spectral Library of Goianésia - GO
R2 0.51 0.40 0.65 0.90 0.90 0.19 0.19 0.60 0.43 0.36 0.61 0.58 0.78 0.53 x 0.43
RMSE 64.84 31.89 65.98 3.35 1.95 13.15 3.65 10.71 4.42 1.19 9.18 16.14 13.45 14.51 x 8.33
NF 12 8 16 20 20 10 8 16 14 15 13 16 15 16 x 17
Spectral Library of Luis Antonio - SP
R2 0.82 0.68 0.81 0.67 0.69 0.36 0.31 0.36 0.33 0.27 0.29 0.52 0.57 0.23 0.31 0.38
RMSE 111.1 30.98 94.09 4.39 2.55 6.15 0.91 7.56 2.25 2.06 8.67 8.92 12.42 14.36 0.47 18.23
NF 14 12 14 14 14 11 12 9 7 7 7 16 14 7 6 10
Calibration and validation of predictive models generated from the spectral libraries
Determining which R2 and RMSE parameter
values indicate an appropriate model is subjective, and it is difficult to compare the results of different
calibrations (DUNN et al., 2002). However, Sayes,
Mouazen and Ramon (2005) has established that R2
values between 0.50 and 0.65 indicate that the model can discriminate high and low concentrations, while R2
values of approximately 0.66 to 0.81, 0.82 to 0.90, and 0.90 or greater indicate acceptable, good and excellent quantitative predictive models, respectively, for chemical attributes. Chang et al. (2001) and Dunn et al. (2002) have suggested that models with RPD values lower than
1.5 should be considered insufficient for the majority applications, whereas models with values greater than 2.0 should be considered excellent. Models with RDP values between 1.5 and 2.0 are considered useful in relation to the accuracy of their predictions. Gogéet al. (2013) found R2 > 0.75 in predict models for local library,
with R2= 0.58 for clay, CEC, CaCO
3 and Fe contents, but
Table 4 - Results of model validation for estimating attributes generated from General, Regionals and Locals Spectral Libraries Statistical parameter¹ Sand Silt Clay O.M. O.C. P K Ca Mg Al H+Al SB CEC V pH CaCl2 m
--- g kg-1 --- --- mg kg-1--- --- mmol
c kg-1 --- % %
General Spectral Library
R2 0.86 0.51 0.85 0.63 0.63 0.17 0.18 0.4 0.31 0.16 0.46 0.37 0.66 0.3 0.22 0.23
RMSE 102.4 37.5 97.73 4.79 2.73 5.56 1.31 9.26 3.5 4.35 11.48 13.12 14.66 18.84 0.51 22.44 SDE 96.07 37.5 90.27 4.66 2.66 5.56 1.31 9.2 3.5 4.29 11.18 13.03 14.62 18.2 0.49 21.78 ME -35.54 -2.14 37.58 1.11 0.61 -0.08 -0.04 -1.07 -0.2 0.74 2.65 -1.64 1.13 -4.7 -0.11 5.46 RPD 2.67 1.43 2.58 1.66 1.65 1.10 1.11 1.29 1.21 1.09 1.36 1.50 1.71 1.20 1.14 1.14
Regional Spectral Library 01
R2 0.64 0.3 0.67 0.61 0.61 0.3 0.38 0.63 0.51 0.61 0.48 0.66 0.64 0.61 x 0.68
RMSE 42.41 25.93 31.5 2.98 1.73 2.8 0.97 4.54 1.89 2.4 5.83 6.16 7.15 13.49 x 15.44 SDE 42.06 25.9 31.14 2.97 1.73 2.8 0.97 4.54 1.89 2.4 5.8 6.15 7.1 13.5 x 15.4 ME 5.65 -0.66 -4.7 -0.22 -0.13 -0.22 0.01 -0.22 -0.1 0.02 -0.71 -0.43 -0.96 0.63 x 0.13 RPD 1.66 1.20 1.75 1.61 1.62 1.21 1.28 0.27 1.43 1.60 1.28 1.72 1.67 1.60 x 1.77
Regional Spectral Library 02
R2 0.78 0.55 0.77 0.65 0.65 0.27 0.06 0.4 0.32 0.33 0.39 0.4 0.52 0.19 x 0.39
RMSE 117.54 33.19 103.46 4.36 2.54 7.33 1.14 7.61 2.33 2.43 9.41 9.96 13.61 16.34 x 18.43 SDE 117.6 32.4 102.3 4.33 2.52 7.34 1.13 7.5 2.32 2.4 9.02 9.82 13.6 15.9 x 18.4 ME 5.69 7.46 -16.8 -0.6 -0.35 -0.31 0.14 1.3 0.23 0.14 -2.74 1.73 -0.56 4 x -0.64 RPD 2.13 1.49 2.08 1.69 1.69 1.17 1.04 1.30 1.22 1.23 1.28 1.29 1.45 1.11 x 1.29
The models internal validation is displayed in Table 3. Among the predictive models generated from the general SL, sand and clay showed excellent results, with R2 values greater than 0.85 and RPD greater than 2.0
(Table 4).
Organic matter, organic carbon, and CEC showed good predictive ability, with R2 values greater than 0.6 and
RPD greater than 1.6 but lower than 2.0. The remaining attributes showed unsatisfactory results, with RPD values lower than 1.6. The attributes that createdthe worst predictions were P, K, Al3+, CaCl
2 and pH (Table 4).
In fact, this is in agreement with Soriano-Disla et al. (2014) review, which observed low values for these elements. The accuracy of the predictive models differed between regional SLs (Table 4). Regional SL 01 lead to good predictions for clay, sand, organic
carbon, OM, Al3+, SB, CEC, V% and m%. Regional SL
02 generate excellent predictions for clay and sand and good predictions for organic carbon and OM.
Regional SL 01 result in better predictions than Regional SL2 for P, K, Mg, Al, SB, CEC, V%, and m% and poorer predictions for sand, clay, organic carbon, OM, and Ca. To summarize, Regional SL 02 result in better predictions for physical attributes, while Regional SL 01 was for chemical attributes. Regional SL 02 had greater soil variability than regional SL 01, as shown in
¹ R²: coefficient of determination; RMSE: root mean square error; SDE: standard deviation of the residuals; ME: mean error; RPD: ratio of prediction deviation. *O.M.: organic matter; SB: sum of bases; CEC: cation exchange capacity; V: base saturation; m: aluminum saturation; x: there is no data
Figure 2. Whereas Region 02 is located at the transition between the Peripheral Depression and the Western Plateau of São Paulo, where distinct parent materials such as sandstones, siltstones, and volcanic rocks are present and Region 01 is located on the Western Plateau of São Paulo, where the parent material is mostly sandstone.
The presence of distinct parent materials causes a high diversity in the soils of Region 02, where sandy soils and clay soils with high Fe2O3 content can be found. Therefore, the spectral libraries with greater soil variability generated better predictive models for physical attributes such as clay, sand, and organic carbon, consistent with the results found for models generated from the general SL.
Sankeyet al. (2008) observed that the combination of local spectral data with global data leads to better predictions for sand and organic carbon than the use of global data or local data alone. In this context, the importance of local data and the need for data variability become evident for the generation of better predictive models.
Statistical parameter¹ Sand Silt Clay O.M. O.C. P K Ca Mg Al H + Al SB CEC V pH CaCl2 m --- g kg-1 --- --- mg kg-1 --- --- mmol
c kg-1 --- % %
Spectral Library of Porto Velho - AP
R2 0.77 0.21 0.77 0.62 0.62 0.13 0.55 0.31 0.1 0.58 0.57 0.29 0.56 0.36 x 0.37
RMSE 72.8 14.33 73.06 4.29 2.49 0.87 0.41 1.06 0.5 2.34 7.79 1.65 8.13 6.04 x 16.98 SDE 69.53 x 75.98 4.27 2.48 0.87 0.41 1.07 0.49 2.33 7.78 1.66 8.12 6.05 x 16.92 ME 22.15 x -20.07 -0.48 -0.28 0.01 -0.02 0.03 0.05 -0.23 -0.73 -0.08 -0.65 0.25 x -1.89 RPD 2.09 1.13 2.08 1.63 1.64 1.08 1.49 1.21 1.04 1.54 1.52 1.19 1.51 1.25 x 1.26
Spectral Library of Guararapes - SP
R2 0.68 0.21 0.71 0.66 0.66 0.37 0.49 0.56 0.43 0.31 0.54 0.57 0.65 0.55 0.62 0.26
RMSE 38.39 29.64 27.65 2.25 1.31 3.42 1.05 3.7 1.77 1.19 3.38 5.05 5.38 8.44 0.37 8.36 SDE 38.1 29.2 27.7 2.26 1.31 3.44 1.1 3.64 1.76 1.2 3.38 4.95 5.3 8.32 0.37 8.38 ME -5.26 5.5 1.4 -0.07 -0.04 0.18 -0.08 0.68 0.21 -0.02 -0.32 1.05 0.95 1.53 -0.06 -0.22 RPD 1.77 1.11 1.84 1.72 1.72 1.26 1.41 1.51 1.32 1.21 1.48 1.53 1.73 1.49 1.65 1.17
Spectral Library of Goianésia - GO
R2 0.45 0.5 0.55 0.61 0.61 0.19 0.29 0.53 0.32 0.27 0.27 0.51 0.69 0.42 x 0.34
RMSE 66.5 38.16 75.63 6.06 3.52 8.54 3.2 11.25 5.17 1.16 11.66 16.83 15.85 16.74 x 8.74 SDE 66.5 38.3 75.7 5.96 3.5 8.43 3.19 11.15 5.19 1.16 11.55 15.18 16.76 x 8.76 ME -5.1 0 5.4 1.16 0.7 1.53 0.36 1.76 0.05 0.04 1.84 4.7 0.92 x -0.12 RPD 1.12 1.35 1.32 1.62 1.64 1.12 1.06 1.46 1.21 1.00 1.18 1.31 1.80 1.31 x 1.04
Spectral Library of Luis Antonio - SP
R2 0.77 0.71 0.74 0.54 0.54 0.28 0.23 0.45 0.34 0.22 0.36 0.42 0.49 0.26 0.44 0.26
RMSE 127.08 30.53 113.22 5.68 3.3 5.79 0.81 7.82 2.14 2.02 8.98 10.76 15.56 14.3 0.37 18.6 SDE 115.6 29.39 103 5.23 3.04 5.81 0.81 7.75 2.15 2.01 8.97 10.71 15.45 14.28 0.37 18.5 ME 53.6 -8.56 -47.6 -2.23 -1.3 0.01 0.13 -1.23 -0.07 0.26 -0.77 -1.28 -2.15 -1.33 0.01 2.29 RPD 2.07 1.85 1.96 1.49 1.48 1.18 1.15 1.36 1.23 1.13 1.26 1.32 1.41 1.17 1.35 1.16
Table 5 -Results of model validation for estimating attributes generated from Local Spectral Libraries
¹R²: coefficient of determination; RMSE: root mean square error; SDE: standard deviation of the residuals; ME: mean error; RPD: ratio of prediction deviation. *O.M.: organic matter; SB: sum of bases; CEC: cation exchange capacity; V: base saturation; m: aluminum saturation; x: there is no data
for sand, clay, OM, organic carbon, CEC, CaCl2 and pH in the model for the local SL of Guararapes-SP; for OM, organic carbon, and CEC in the model for the local SL of Goianesia-GO; and for silt and clay in the model for the local SL of Luis Antonio-SP.
Stevens et al. (2013) working with a continental scale (Europe), showed relatively large error (more than 4 g kg-¹), sugesting that organic carbon prediction on large scale spectral library are not accurate. The comparison among the results of the local SLs (Table 5) demonstrated that, overall, SLs with greater soil variability lead to a better predictions for physical attributes and poorer predictions for chemical attributes. According to Zornoza et al. (2008), soil properties such as CEC and exchangeable bases are primarily controlled by the types of clay minerals and the types and content of organic matter, which possess functional groups of varying adsorption capacities for different cations and water.
Therefore, when working with data from various soil classes with different parent materials, there is likely to
be variation of the types of clay minerals that contribute to CEC. Each type of clay mineral (oxides, clay minerals 1:1, and clay minerals 2:1) is associated with specific spectral bands; thus, the CEC may be correlated with different spectral bands in different soils. Therefore, if an attribute is correlated with a particular band in a particular soil, with another band in another soil, and so forth, this will lead to confusion in the development of predictive models. This fact partially explains why, in some areas of lower soil variability, the predictive models for chemical attributes are better: for the majority of samples in these areas, the predicted attributes are related to the same bands.
Table 6 - The influence of the range of data variation in quality of predictive models Statistical parameter Sand g kg
-1 C g kg-1 Ca Al SB CEC V
--- mmolc kg-1 --- %
Regional Spectral Library 01
R² 0.64 0.61 0.63 0.61 0.66 0.64 0.61
RMSE 42.41 1.73 4.54 2.40 6.16 7.15 13.49
RPD 1.66 1.62 0.27 1.60 1.72 1.67 1.60
Spectral Library of Guararapes-SP
R² 0.68 0.66 0.56 0.31 0.57 0.65 0.55
RMSE 38.39 1.31 3.7 1.19 5.05 5.38 8.44
RPD 1.77 1.72 1.51 1.21 1.53 1.73 1.49
Regional Spectral Library 01
Mean 746.5 6.0 1.5 3.37 16.35 34.46 46.0
SD 70.5 2.8 1.24 3.83 10.60 11.94 21.6
min 540.0 0.5 0.1 0.0 2.1 7.50 5.0
max 920.0 15.1 6.7 16.0 53.3 75.90 98.0
Spectral Library of Guararapes-SP
Mean 744.0 4.65 12.9 1.21 19.2 37.4 50.6
SD 68.0 2.25 5.58 1.44 7.75 9.3 12.6
min 540.0 1.74 2.0 0.0 3.0 20.0 14.0
max 890.0 11.63 33.0 6.0 47.0 72.0 80.0
Similar results No similar results Smaller range of variation Higher range of variation
with the conclusions of Dunn et al. (2002), who found
that a low range of variation in a particular attribute may lead to poor predictive models. For example, Viscarra-Rosselet al. (2008) obtained excellent predictive models for Ca2+from a database whose values ranged from 1.9 to
313.5 mmolc kg-1.
Sankey et al. (2008) have presented revised
results in which for the prediction of clay and O.C. tends to improve from global SLs to regional SLs and from regional SLs to local SLs. However, the size of the SL is perhaps not the best form of comparison among soil spectral libraries. Rather, the variation in the data in a spectral library may be better for comparison. For example, there are relatively small areas in Brazil with high soil variability and large areas with low soil variability.
No general rule was found by Gogéet al. (2013) for use local or global models, for CaCO3, for example, the best strategy was use global library, without local samples and for clay content, the prediction model was better using 50 local samples (representing 35 % of total local samples).
The discussion of what is the best to predict soil attributes, if local or general libraries raised with
Henderson et al. (1992). They already stated this type of difficulty. Afterwards Demattê and Garcia (1999) observed that local models where significantly better than general ones, working in Paraná State, Brazil.
CONCLUSIONS
1. Greater or lesser variability in soil classes formed from different parent materials influences the efficiency of the predictive models generated from a spectral library;
2. Variability of soil and parent materials within a spectral library impairs the accuracy of predictive models for chemical attributes and improves predictive models for physical attributes;
3. A spectral library aimed at predicting chemical attributes should have low soil variability, and the data used to calibrate the models should have a large range of variation of the modeled attribute;
5. There is still necessary research on the subject to reach the best database.
REFERENCES
ARAÚJO, S. R.et al. Improving the prediction performance of a large tropical vis-NIR spectroscopic soil library from Brazil by clustering into smaller subsets or use of data mining calibration techniques.European Journal of Soil Science,
v. 65, n. 5, p. 718-729, 2014.
BELLINASO H.; DEMATTÊ, J. A. M.; ARAUJO, S. R. Spectral library and its use in soil classification.Revista Brasileira de Ciência do Solo, v. 34, n. 3, p. 861-870, 2010.
CAMARGO, A. O. et al. Métodos de análise química, mineralógica e física de solos do IAC. Campinas: Instituto
Agonômico de Campinas, 1986. 96 p. (IAC. Boletim Técnico, 106).
CHANG, C. W. et al. Near-infrared reflectance spectroscopy - principal components regression analyses of soil properties.
Soil Science Society of America Journal, v. 65, n. 2, p.
480-490, 2001.
DEMATTÊ, J. A. M.; GARCIA, G. J. Alteration of soil properties through a weathering sequence as evaluated by spectral reflectance. Soil Science Society of America Journal, v. 63, n. 2, p. 327-342, 1999.
DUNN, B. W.et al. The potencial of near-infrared reflectance spectroscopy for soil analysis - a case study from the Riverine Plain of south-eastern Australia. Australian Journal of Experimental Agriculture, v. 42, n. 5, p. 607-614, 2002. GALVÃO, L. S.; PIZARRO, M. A.; EPIPHANIO, J. C. N. Variations in reflectance of tropical soils: spectral-chemical compositions relationships from AVIRIS data.Remote Sensing of Environment, v. 75, n. 2, p. 245-255, 2001.
GENOT, V.et al. Near infrared reflectance spectroscopy for estimating soil characteristics valuable in the diagnosis of soil fertility.Journal of Near Infrared Spectroscopy, v. 19, n. 2, p. 117-138, 2011.
GOGÉ, F.et al. Which strategy is best to predict soil properties of a local site from a national Vis-NIR database?Geoderma, v. 213, p. 1-9, 2013.
GOMEZ, C.; VISCARRA-RUSSEL, R. A.; MCBRATNEY, A. B. Soil organic carbon prediction by hyperspectral remote sensing andfield vis-NIR spectroscopy: an Australian case study.
Geoderma, v. 146, n. 3/4, p. 403-411, 2008.
HENDERSON, T. L.et al. High dimensional reflectance analysis of soil organic matter.Soil Science Society of America Journal,
v. 56, n. 3, p. 865-872, 1992.
LONGLEY, P. A. et al. Sistemas e ciência da informação geográfica. 3. ed. Porto Alegre: Bookman, 2013. 540 p.
MINASNY, B.; MCBRATNEY, A. B. A conditioned Latin hypercube method for sampling in the presence of ancillary information.Computer Geoscience, v. 32, n. 9, p. 1378-1388, 2006.
NANNI, M. R.; DEMATTÊ, J. A. M. Spectral reflectance methodology in comparison to traditional soil analysis. Soil Science Society of America Journal, v. 70, n. 2, p. 393-407,
2006.
RAIJ, B. van.Análise química para avaliação da fertilidade de solos tropicais. Campinas: Intituto Agronômico de Campinas, 2001. 285 p.
SANKEY, J. B. et al. Comparing local vs. global visible Near-Infrared (VisNIR) diffuse reflectance spectroscopy (DRS) calibrations for the prediction of soil clay, organic C and inorganic C.Geoderma, v. 148, n. 2, p. 149-158, 2008. SANTOS, R. D.et al.Manual de descrição e coleta de solo no campo. 5. ed. Viçosa, MG: Sociedade Brasileira de Ciências do
Solo, 2013. 100 p.
SAYES, W.; MOUAZEN, A. M.; RAMON, H. Potential for onsite and online analysis of pig manure using visible and near infrared reflectance spectroscopy. Biosystems Engineering, v. 91, n. 4, p. 393-402, 2005.
SORIANO-DISLA, J. M. et al. The performance of visible, near-, and mid-infrared reflectance spectroscopy for prediction of soil physical, chemical and biological properties. Applied Spectroscopy Reviews, v. 49, n. 2, p. 139-186, 2014.
STEVENS, A. et al. Prediction of soil organic carbon at the European scale by visible and near infrared reflectance spectroscopy.PLoS ONE, v. 8, n. 6, e66409, 2013.
VASQUES, G. M.; GRUNWALD, J. O. S. Comparison of multi-variate methods to predict soil carbon using visible/near-infrared diffuse reflectance spectroscopy. Geoderma, v. 146, n. 1/2, p. 14-25, 2008.
VISCARRA-ROSSEL, R. A.et al. Using a legacy soil sample to develop a mid-IR spectral library.Australian Journal of Soil Research, v. 46, n. 1, p. 1-16, 2008.
VISCARRA-ROSSEL, R. A.; CHEN, C. Digitally mapping the information content of visible–near infrared spectra of surficial Australian soils.Remote Sensing of Environment,
v. 115, n. 6, p. 1443-1455, 2011.
WILLIANS, P. C. Variables affecting near-infrared reflectance spectroscopy analysis. In: WILLIANS, P.; NORRIS, K. (Ed).
Near-infrared technology in the agricultural and food industrie. Minnesota: American Association of Cereal Chemists, 1987. p. 143-166.