Article
Printed in Brazil - ©2017 Sociedade Brasileira de Química0103 - 5053 $6.00+0.00*e-mail: [email protected]
A Multi-Pumping Flow System with Pulsed Fluidization to Evaluate Soil Capacity
for Phosphate Adsorption
Jeane M. C. Machado,a,b Wanessa R. Melchert,a Elias A. G. Zagattob and
Marcos Y. Kamogawa*,a
aEscola Superior de Agricultura Luiz de Queiroz, Universidade de São Paulo,
CP 9, 13418-900 Piracicaba-SP, Brazil
bCentro de Energia Nuclear na Agricultura, Universidade de São Paulo,
CP 96, 13400-970 Piracicaba-SP, Brazil
Soils with high levels of iron and aluminum, thus negatively the phosphorous availability, affecting crop yields. A prior determination of the soil capacity to adsorb phosphate is relevant to attaining good agricultural performance. To this end, a multi-pumping flow system with pulsed fluidization is proposed. The procedure takes into account the amount of remaining phosphorus (P-rem) in the solution after the adsorption step to indirectly estimate the soil retention capacity. A 1.0 mg L-1 P solution is passed through a fluidized bed column with 50 mg of soil (particles < 0.15 mm), where the analyte is adsorbed. P-rem was spectrophotometrically quantified by the molybdenum blue method. The coefficient of variation (n = 20), limits of detection and quantification (99.7% confidence level), and sampling rate were estimated as 1.54%, 17 and 51 µg L-1 P, and 87 h-1, respectively. Only 0.27 mg (NH4)6Mo7O24 and 0.10 mg SnCl2 were consumed per determination, generating 2.4 mL of waste. The results followed a linear relationship [y = 0.9702x + 1.483 (r = 0.9635; n = 20)] with the reference procedure. In comparison to the reference procedure, 100, 40 and 180-fold reductions in the required soil amount, waste generation and analytical time were attained.
Keywords: solenoid micro-pumps, adsorption, kinetic, solid-liquid interaction
Introduction
Productivity in tropical soils is closely related to soluble
or available phosphorus, usually o-phosphate species.
These species are adsorbed on oxides and aluminosilicates
through bonds exchange with surface OH- groups, or
precipitated as insoluble compounds with e.g. Ca, Fe and
Al (Metal-PO4 ⇋ PO43-). Soils with high clay, iron and
aluminum contents are generally characterized by a high phosphate adsorbing capacity, resulting in low availability of this species to plants, causing nutritional deficiency and
thereby affecting plant growth and production.1
Knowledge of the soil capacity to adsorb phosphate is thus required to estimate the concentration of soluble phosphorus in the soil solution (P-sol) in order to support the recommendation for a suitable fertilization. In this context, the determination of remaining phosphorus (P-rem), i.e., the amount of P in the solution after adsorption in soil, has been often used to estimate the adsorption capacity. The P-rem
determination proposed in 19712 and adapted to Brazilian
soils in 2000,3 presents drawbacks such as the large required
volumes of reagent and the cumbersome steps of dilutions, transfers and filtrations, which are time-consuming and susceptible to errors. Consequently, mechanization of the entire procedure and increased sampling rates are aimed at, especially in routine laboratories complying with the
principles of Green Chemistry.4,5
Flow analysis fulfills these requirements, as flow systems allow for different sample preparation procedures and detection techniques, thus minimizing the possibility of
contamination and human errors.6 The main advantages of
flow analyzers in relation to monitoring dynamic extraction processes are reduced analysis time and reagent consumption, the possibility to implement a continuous or segmented extraction process, as well as the instrumental versatility and robustness. These advantages have been emphasized in relation to phosphorus fractionation in mini-columns for
o-phosphate monitoring in a multi-syringe flow injection
analyzer,7 and to the fractionation of organic and inorganic
Multi-pumping flow systems utilize solenoid micro-pumps to promote turbulent mixing, which improves radial mixing, and thus sample/reagent interactions. This aspect becomes more relevant in relation to analytical procedures involving relatively slow reactions where sensitivity is critical, as the mixing conditions may influence the analytical
sensitivity.9 Moreover, this aspect is a positive factor
regarding the efficient implementation of fluidized beds for in-line analyte separation-concentration by solid phase
extraction.10 Sample movement and particle refluxing lead
to an improvement in solid-liquid interactions, a condition efficiently attained with fluidized beds. The solution drag force through the particles is enough to support them, providing a pressure drop in the bed. Consequently, a chaotic yet reproducible geometry of the refluxing solid particles is established, characterizing fluidization.11
With fluidized beds, the limitations inherent to packed columns, such as overpressure, swelling effects, low availability of sites for interaction, and the establishment of preferential pathways are eliminated.10 In this context,
fluidization of solid waste samples has improved the efficiency of Cd, Cr, Cu and Zn extraction, resulting in better accuracy and repeatability in comparison to the
batch-wise analogous procedure.12
The aim of this work was therefore to exploit the turbulent mixing inherent to pulsed flows and the establishment of a fluidized bed to evaluate the soil capacity to adsorb phosphorus. To this end, an advanced multi-pumping flow system was designed for the spectrophotometric determination of P-rem in soils.
Experimental
Reagents and solutions
All solutions were prepared with distilled-deionized
water (resistivity > 18.2 MΩ cm) provided by a Milli-Q
system. Chemicals were of analytical grade quality, except for calcium chloride, a technical-grade reagent.
The solution (R1, Figure 1), a 10.0 mmol L-1 CaCl2
plus 60.0 mg L-1 phosphorous (as KH
2PO4) solution,
was similar to that used in the batch-wise procedure,3
but prepared with a lower (1.0 mg L-1) phosphorus
concentration.
For phosphate determination by the batch-wise
procedure, a 3.9 mmol L-1 bismuth as (BiO)
2CO3 plus
85 mmol L-1 ammonium heptamolybdate as (NH
4)6Mo7O24
plus 2.7 mol L-1 sulfuric acid solution, and a 3.0% (m/v)
ascorbic acid (C6H8O6) solution were used. In the flow
system, 2.0 mmol L-1 (NH
4)6Mo7O24 in 1.0 mol L-1 HNO3
and 4.0 mmol L-1 stannous chloride as SnCl
2 in 0.3 mol L-1
HCl solutions were used.13
Soil samples
Soil samples, classified as Typic Hapludox (TH), Aquent (A), Mollic Epiaquent (ME), Typic Argiudolls
(TA) and Rhodic Hapludox (RH),14 were collected
from the topsoil (0-20 cm). Their main attributes were evaluated, and results are presented in Table 1. Sand was used as a reference in the procedure, in view of its
low P adsorption (P-rem determined as 60 mg L-1). To
validate the proposed procedure, 16 samples with different adsorption capacities were analyzed by the batch-wise and proposed procedures.
Batch-wise procedure for P-rem estimation
The adsorption procedure was performed by adding
5.0 g of soil sample and 50 mL of a 10.0 mmol L-1 CaCl
2
plus 60.0 mg L-1 P solution into an Erlenmeyer flask and
shaking it for 1.0 h at 250 rpm in a horizontal circular shaker. The extracts were filtered through quantitative filter
paper. Thereafter, 5.0 mL of 3.9 mmol L-1 (BiO)
2CO3 and
1.0 mL of 3.0% (m/v) ascorbic acid solutions were added to 5.0 mL of the extract. After 30 min, the P-rem was spectrophotometrically determined by the molybdenum blue method.18
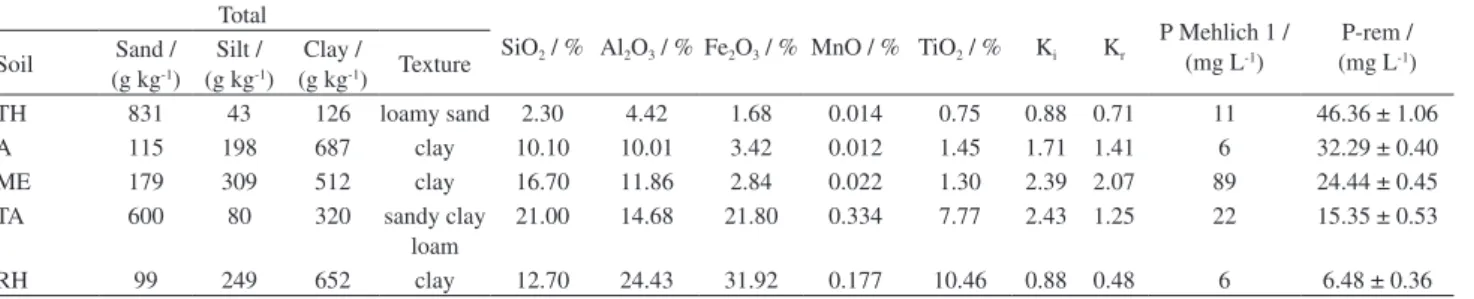
Table 1. Soil attributes. Physical properties, oxide composition, soluble P and P-rem concentration by conventional procedure. Clay by hydrometer method;15
oxides levels by sulfuric and alkaline attack;16 phosphorus by colorimetry extracted with Mehlich 117
Total
SiO2 / % Al2O3 / % Fe2O3 / % MnO / % TiO2 / % Ki Kr P Mehlich 1 / (mg L-1)
P-rem / (mg L-1)
Soil Sand / (g kg-1)
Silt / (g kg-1)
Clay /
(g kg-1) Texture
TH 831 43 126 loamy sand 2.30 4.42 1.68 0.014 0.75 0.88 0.71 11 46.36 ± 1.06
A 115 198 687 clay 10.10 10.01 3.42 0.012 1.45 1.71 1.41 6 32.29 ± 0.40
ME 179 309 512 clay 16.70 11.86 2.84 0.022 1.30 2.39 2.07 89 24.44 ± 0.45
TA 600 80 320 sandy clay
loam
21.00 14.68 21.80 0.334 7.77 2.43 1.25 22 15.35 ± 0.53
RH 99 249 652 clay 12.70 24.43 31.92 0.177 10.46 0.88 0.48 6 6.48 ± 0.36
System dimensioning
The proposed multi-pumping flow system (Figure 1) was comprised of two modules, related to in-line phosphorus adsorption (Figure 1a) and to flow-based phosphate determination (Figure 1b), which were dimensioned as follows.
Phosphorus adsorption module
For optimization of the adsorption module (Figure 1a), different mini-columns (10, 20, 30, 40 or 50 mm long, 3 mm i.d.) with ca. 25, 50, 75, 100 or 125 mg of soil (particles smaller than 0.149 mm) were evaluated. In these experiments, the Mollic Epiaquent soil (ME) was selected because of its intermediate P-rem value (Table 1). Cotton wool was placed at the bottom end of the mini-column to hold the soil particles, and a filter support (Millipore Swinnex, Darmstadt, Germany) with a 0.45 µm cellulose acetate membrane was placed at the top end to retain particulate material. In this way, particle losses during system operation were avoided. Each sample was added in its own column being discarded after use.
A 1.0 mg L-1 phosphorus in 10.0 mmol L-1 CaCl
2 solution
was directed to flow through the mini-column, and the extracts were collected after the model 120SP solenoid micro-pump (Biochem Valve Inc., Boonton, NJ, USA) had sent 100 pulses. As the stroke volume was 20 µL, a total volume
of ca 2.0 mL was used per extraction. The phosphorous
concentration in the extract was spectrophotometrically determined, as in the conventional procedure.
Phosphorus determination module
The multi-pumping flow system proposed for P-rem determination (Figure 1b) comprised four model 120SP and 140SP solenoid micro-pumps (Biochem Valve Inc., Boonton, NJ, USA) that dispensed 22.7 ± 0.1, 22.8 ± 0.1, 22.7 ± 0.1 and 43.7 ± 0.5 µL, as experimentally determined and a three-way solenoid valve used to clean the system or exchange the solutions (NResearch, West Caldwell, NJ, USA).
T h e m o d e l U S B 2 0 0 0 m u l t i - c h a n n e l C C D spectrophotometer (Ocean Optics, Dunedin, FL, USA) was used with a model LS-1 tungsten-halogen radiation source from the same manufacturer. Optical fibers (400 µm) were used to transmit the radiation towards a 1.0 cm optical path quartz flow cell (80 µL internal volume). This spectrophotometer allows the simultaneous acquisition of two wavelengths and was used to subtract the signals relating to Schlieren effect.
The manifold was built up with (0.8 mm i.d.) PTFE tubing. The flow set-up was controlled by using an Arduino board and a potency interface based on the ULN2803 integrated circuit, a 12 V DC power supply, and a push button to select the functions and to start or stop the
program.19 The program for operating the devices was
developed in Arduino 1.5.5 software.
Figure 1. Flow diagram of the system for P-rem determination in soils. (a) Phosphorus adsorption module, filter and column highlight; (b) phosphorus determination module. R1: 1.0 mg L-1 P in 10.0 mmol L-1 CaCl2; R2: 2.0 mmol L-1 (NH4)6Mo7O24 in 1.0 mol L-1 HNO3; R3: 4.0 mmol L-1 SnCl2 in 0.3 mol L-1
HCl; C: 10.0 mmol L-1 CaCl
2; P1-P4: solenoid micro-pumps operated at 2.5 Hz; V: three-way solenoid valve; F: fluidized bed column containing soil sample,
The effects of parameters affecting the reaction
development were evaluated: volumes of R2 (1 to 6 pulses),
R3 (1 to 6 pulses) and R1, 1.0 mg L-1 phosphorus (1 to
10 pulses); sampling cycles (1 to 7); reactor coil length (50, 75, 100, 150, 200 cm) and stop period (0, 15, 30, 45, 60 s).
The limit of detection (LOD) was estimated from 20 measurements of the analytical blank and the linear regression of analytical curve using the equation:
LOD = 3.3σ / s; where σ = estimated standard deviation;
s = slope of the analytical curve. The limit of quantification
(LOQ) is estimated as LOQ = 5.0 × LOD.20
Flow diagram and procedure
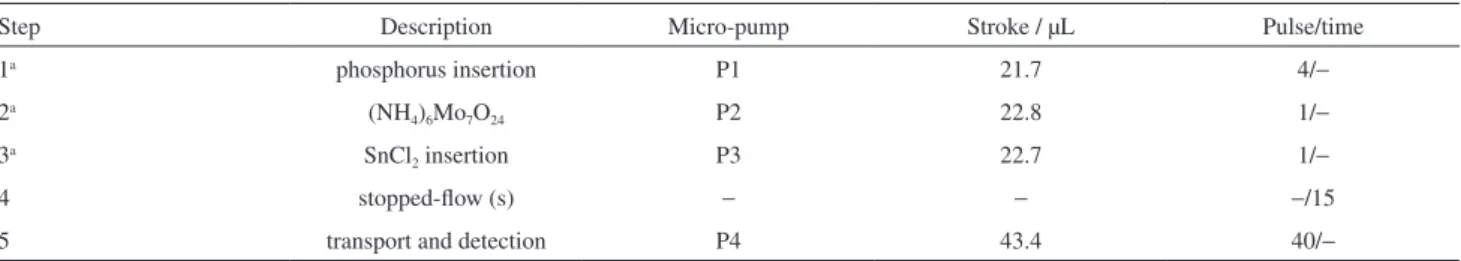
The flow manifold, showed in Figure 1, was operated according to the micro-pump and valve switching course specified in Table 2.
The R1-R3 reagents were introduced in the analytical
path by micro-pumps P1-P3 with nominal volumes of
20 µL. The column packed with soil was filled with R1
to the confluence point x and then four pulses of reagent containing phosphorous for adsorption were applied through the fluidized bed column, then one pulse of the other reagents to form the molybdenum blue complex, then five sampling cycles (steps 1, 2 and 3) and 15 s of stopped-flow (step 4). The sample carrier stream was delivered by
the P4 micro-pump, with a nominal volume of 40 µL. For
each soil sample, 20 replicated determinations of P-rem were accomplished to obtain the adsorption profile. The measurements were performed in quadruplicate.
Results and Discussion
Adsorption kinetics
The P-rem index is normally determined under equilibrium conditions. In order to check the P adsorption kinetics in the soils, P-rem was determined by the conventional procedure with different shaking times (1, 5, 10 min) and results were compared with those obtained by
the conventional procedure involving chemical equilibrium (shaking time = 60 min).
It was found that phosphorus adsorption was fast in all samples, with P-rem values related to the first minute similar to values obtained after 60 min of shaking. This was confirmed by the angular coefficients of the linear regression equations that compare the results of P-rem after 60 min, which approached unity: y = 0.9553x + 6.352 (r = 0.9724, n = 3, 1 min shaking time), y = 1.0050x + 3.554 (r = 0.9869, n = 3, 5 min shaking time) and y = 0.9824x + 5.554 (r = 0.9787, n = 3, 10 min shaking time).
It was observed that phosphorous adsorption occurred in two stages. The first stage is probably due to surface adsorption or precipitation with Fe, Al and Ca, and takes place rapidly (on the order of seconds), whereas the second one is slower, probably due to adsorption at anionic exchange sites or sites located in interstices of restricted access.1 The second step represents less than 5% of the total
P adsorption during the first minute of shaking. A similar tendency was noted for all tested samples, demonstrating the feasibility of determining the phosphorous adsorption capacity for soils in flow systems.
Optimization of phosphorus adsorption module
The fluidized bed resembles a fluid due to the agitation acquired in systems with the irregular trajectory of the
particle,12 allowing for rapid phosphorous transfer to the
adsorption sites. The solenoid micro-pumps provide a pulsed flow within the column, and thus is more appropriate to be classified as pulsed fluidization.
The volume dispensed by the solenoid micro-pump was collected after passing through the soil column to investigate the flow system impedance using different soil mass. With a mass greater than 75 mg, the dispensed volume decreased by 18.0% on average, indicating the increased hydrodynamic impedance in the system. This occurred because the soil in the column does not establish the fluidization conditions and takes on characteristics similar to a packed column, such as clogging of the channel and the establishment of preferential paths, which affect
Table 2. Switching courses of the solenoid micro-pumps to evaluate phosphate adsorption in soils
Step Description Micro-pump Stroke / µL Pulse/time
1a phosphorus insertion P1 21.7 4/−
2a (NH
4)6Mo7O24 P2 22.8 1/−
3a SnCl
2 insertion P3 22.7 1/−
4 stopped-flow (s) − − −/15
5 transport and detection P4 43.4 40/−
the adsorption process. Soil samples with a mass of 50 mg were selected due to the lower coefficient of variation 0.54%, considering the volume dispensed by the solenoid micro-pump.
The use of columns with a length of 10 mm provided 20.0% higher P-rem values, indicating the lower capacity of the soil to adsorb phosphorous. In this condition, the sample fills the whole column, limiting the liquid-solid interaction due to the establishment of preferential paths. The results obtained with lengths of 20 to 50 mm columns showed no changes in P-rem concentrations. In terms of convenience, operability and better precision, and considering the volume dispensed by the solenoid micro-pump (relative standard deviation (RSD) 0.54%), the 30 mm column was selected.
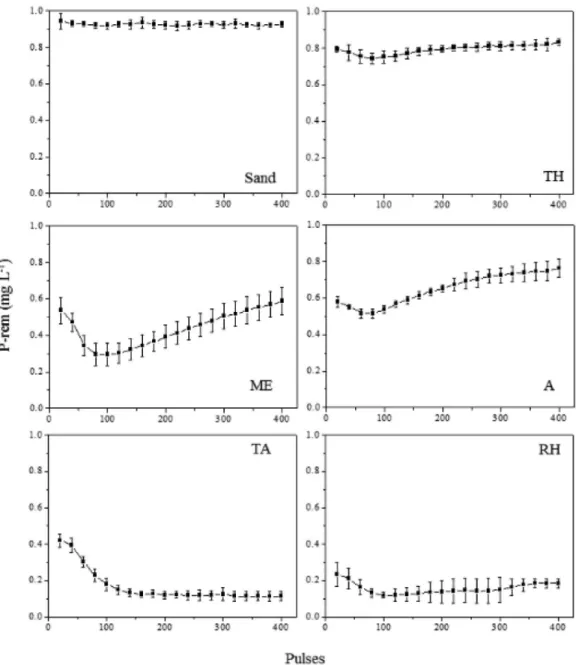
The results of P-rem using the adsorption module, Figure 2, were proportional with the conventional procedure. The comparison between the systems was performed using the first fraction, equivalent to the first 100 pulses of the solenoid micro-pump. The soils with higher clay contents and Fe and Al oxides (RH) had higher adsorption capacity, with lower P-rem values around
of 0.24 mg L-1. Conversely, sandy soils (TH) had lower
adsorption capacity and higher P-rem, around 0.77 mg L-1.
The P-rem concentrations of the flow system (values
between 0.0 and 1.0 mg L-1) were converted into the P-rem
concentration of the conventional procedure scale (0.0 to 60.0 mg L-1) in order to use the established tables of doses
and applications. The comparative scale was performed using the soil with the highest P adsorption capacity
(RH) as a lower limit and sand as the upper limit. For the conventional procedure, the scale comprises of 6.48 to 60 mg L-1 and for the flow system, from 0.24 to 0.95 mg L-1.
Thus, it was possible to correlate the values of the flow system with the P-rem values used to define phosphorous levels to be applied to the soil, according to the conversion in equation 1.
P-rem(conventional) = 75.38 × P-rem(flow) − 11.59 (1)
Comparing the flow system results with the conventional
procedure,3 the P-rem values follow a linear relationship
(y = 1.037x + 0.7678; r = 0.9422) and do not show a difference (t-test, p > 0.05).
Optimization of the phosphorus determination module
The determination of remaining phosphorous was based on the classic reaction by the molybdenum blue method. The formation of a molybdenum blue complex is dependent on parameters such as pH, type and concentration of the
reducing agent, and the molybdenum concentration,21 which
affects the reaction velocity for the formation of species.22
To obtain the maximum sensitivity, these parameters were evaluated using univariate analysis, alternating the number of pulses of the stannous chloride, ammonium molybdate and sample solutions, the reactor length and the time of stopped flow. Disrupted absorbance signals were
observed due to the formation of Schlieren effects.23 The
binary sampling approach was used to obtain improved
mixing24 and the measurement at two wavelengths
simultaneously (500 nm (Schlieren effect) and 700 nm (Schilieren effect + analytical signal)) was used to mathematically correct the signal.
For the (NH4)6Mo7O24 optimization volume, the best
result was achieved with three pulses, but the increase in absorbance comparatively with the use of two pulses was only 4%. Considering the aim of reducing waste production and reagent use, two pulses (46 µL) were selected.
An increase in SnCl2 pulses (from one to six) did not
improve the sensitivity of the reaction; rather, it reduced the absorbance signal. The reduced sensitivity can be explained
by an increase in the SnCl2 volume in the sample zone and
the decreased concentration of (NH4)6Mo7O24 and sample
due to dispersion. Therefore, one pulse of SnCl2 (23 µL)
was selected as the best option.
The volume of the phosphorous solution was evaluated by inserting from one to ten pulses (22 to 220 µL) in each sampling cycle. Although higher sensitivity was achieved with ten pulses, eight pulses (176 µL) were selected because the difference between them was only 6%.
Given the optimization of the number of pulses of the reagents and sample, a 4:1:1 ratio (sample:stannous chloride:ammonium molybdate) was adopted for the optimization experiment regarding the number of cycles. Under these operating conditions, (NH4)6Mo7O24
was in excess of around 18,000-fold compared to the stoichiometric condition (the ratio is 1.7 Mo7O246-:1.0 PO43-).
Stannous chloride also showed the best performance with an excess of the reagent, around 30-fold compared to the stoichiometric condition (1:1).
The reactor coil length was evaluated from 50 up to 200 cm. A 100-cm long reactor coil was selected because, with a shorter length, the sample zone exceeded the reactor volume. Beyond 100 cm, less sensitivity was obtained due to the greater sample zone dispersion in the analytical path. The number of sampling cycles varied from one to seven, increasing linearly with the increase of the sample zone; however, with six and seven cycles, the reactor volume (500 µL) has been exceeded not influencing the sensitivity gain. Therefore, five cycles were selected.
The stopped-flow approach was exploited to favor complex formation. The highest sensitivity was observed for 30 to 60 s; however, as the difference between 15 and 30 s was only 8% in terms of increased sensitivity, 15 s was selected to improve the sampling rate.
Analytical features
A linear response was obtained between 0.0 and
1.0 mg L-1 phosphorous for the P-rem determination
module, described by equation A = 0.2422C + 0.0075 (r = 0.9999), in which A is absorbance and C is P-rem
concentration (mg L-1). The coefficient of variation
(n = 20; 0.4 mg L-1) was estimated at 1.54%. The limit of
detection (99.7% confidence level) was 17 µg L-1 and limit
of quantification was 51 µg L-1. The sampling rate was
87 determinations per hour. Each determination consumed
0.27 mg of (NH4)6Mo7O24 and 0.10 mg of SnCl2, and
generated 2.4 mL of waste.
Interference studies
The main interferences in the phosphorus determination by the molybdenum blue method in soil extracts are orthosilicate ions via the formation of silicic molybdic acid,25 dissolved organic matter26 and metallic ions that can
precipitate as phosphates.
Signals of 0.4 mg L-1 of P were obtained in the absence
and presence of concomitants in concentrations of at least five times greater than the maximum expected in the soil solution, after extraction with CaCl2 10.0 mmol L-1.
There was no signal variation (p > 0.05) in the presence of 10 mg L-1 of Al, Ba, Fe, K, Mg and Mn, or with 4.0 mg L-1
of humic acid. Negative interference of 11% was observed in the presence of Si 10.0 mg L-1. However, the addition of
10 mmol L-1 tartaric acid27 in the CaCl
2 solution suppressed
the interference.
Multi-pumping flow system for the determination of remaining phosphorus in soils
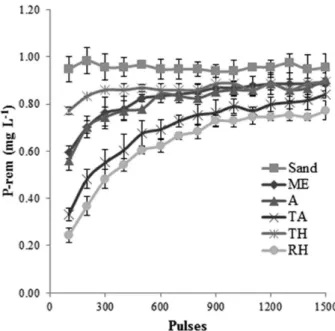
To determine P-rem in-line in soil samples, the adsorption and determination modules were coupled. Figure 3 shows the P-rem concentration in every 434 µL
(20 pulses) of 1.0 mg L-1 P in 10.0 mmol L-1 CaCl
2, with
four pulses of solution and five sampling cycles to establish an adsorption profile.
In Figure 2, the comparison of dynamic adsorption and the conventional procedure was performed with the first 100 pulses of the solenoid micro-pump. Likewise, in Figure 3 the average of the corresponding values to 100 pulses of the P solution was considered, represented by five fractions, with similar results to those previously obtained. However, the P-rem values of the first fraction, equivalent to 20 pulses of the micro-pump, may also be used for soil classification, and did not present differences from the results obtained with the average of five fractions.
The clayey soils, TA and RH, showed higher phosphorous adsorption capacity than the other samples. This was an expected result, based on studies of the adsorption module and as identified in the literature.28 In
most tropical soils, P adsorption is related to Fe and Al
oxides and kaolinite groups.29
The P-rem values determined in soil samples and sand were compared with their respective textures and Fe and Al oxides percentages, as shown in Table 1. The influence of these parameters was observed in the phosphorous adsorption capacity in soil, in which the sandy soil (TH) with a lower content of Al2O3 (4.42%) and Fe2O3 (1.68%)
had the highest P-rem (46.36 mg L-1), and clayey soil
(RH) with a higher content of Al2O3 (24.43%) and Fe2O3
(31.92%) had lower P-rem (6.48 mg L-1). This feature is
consistent with the results obtained by McDowell and
Condron30 that demonstrated a reduction in phosphorous
sorption in soil with the removal of Fe and Al oxides, since these have the greatest impact on phosphorous sorption and desorption.
procedure at the 95% confidence level and had a linear relationship with a linear coefficient close to 100% (y = 0.9702x + 1.483; r = 0.9635). This determination also included previously used soil samples, with the exception of RH and sand, used as the upper and lower limit of the correlation.
The proposed flow system presents advantages such as a reduced sample mass, time of analysis, reagent consumption and, consequently, lower waste generation when compared to the conventional procedure. The mass of soil was reduced from 5 g to 50 mg, and the analysis time, including adsorption and determination, was reduced from 2 h to only 40 s. The generation of waste was reduced from 95 to 2.4 mL.
Conclusions
Phosphorus adsorption in soil using a multi-pumping flow system presented similar and consistent results with the conventional procedure for soil samples with contrasting attributes.
The highlights are the 100-fold decrease in the soil mass required, the 180-fold decrease in analysis time, and the 40-fold reduction in reagent consumption and waste production, demonstrating the potential of this system to be an environmentally friendly alternative.
The effects of pressure increase were not apparent for soil samples in the fluidized bed columns, even for those with clayey textures.
Figure 4. Correlation of P-rem values from the flow system and the conventional procedure using 20 soil samples.
Phosphorus is efficiently adsorbed by soil in a fluidized bed column with pulsed flow, which reduces the effects of pressure and does not change the volume dispensed by the solenoid micro-pump.
Acknowledgments
The authors acknowledge the fellowships and financial support from FAPESP (Fundação de Amparo à Pesquisa do Estado de São Paulo, proc. 2013/00524-0, 2011/19944-3, 2012/08205-8 and 2011/23498-9).
References
1. Van Raij, B.; Fertilidade do Solo e Manejo de Nutrientes; International Plant Nutrition Institute: Piracicaba, Brasil, 2011. 2. Bache, B. W.; Williams, E. G.; J. Soil Sci. 1971, 22, 289. 3. Venegas, V. H. A.; Novais, R. F.; Dias, L. E.; Oliveira, J. A.;
Boletim Informativo da Sociedade Brasileira de Ciência do
Solo 2000, 25, 24.
4. Melchert, W. R.; Reis, B. F.; Rocha, F. R. P.; Anal. Chim. Acta
2012, 714, 8.
5. Anastas, P.; Eghbali, N.; Chem. Soc. Rev. 2010, 39, 301. 6. Kolev, S. D.; McKelvie, I. D.; Comprehensive Analytical
Chemistry, vol. 54; Barceló, D.; Elsevier: Amsterdam, Netherlands, 2008, p. 808.
7. Buanuam, J.; Miró, M.; Hansen, E. H.; Shiowatana, J.; Estela, J. M.; Cerdà, V.; Talanta 2007, 71, 1710.
8. Rocha, D. L.; Rocha, F. R. P.; Microchem. J. 2013, 109, 139. 9. Fortes, P. R.; Feres, M. A.; Sasaki, M. K.; Alves, E. R.; Zagatto,
E. A. G.; Prior, J. A. V.; Santos, J. L. M.; Lima, J. L. F. C.; Talanta 2009, 79, 978.
10. Ribeiro, M. F. T.; Dias, A. C. B.; Santos, J. L. M.; Lima, J. L. F. C.; Zagatto, E. A. G.; Anal. Bioanal. Chem. 2006, 384, 1019.
11. Dixit, R.; Puthli, S.; J. Pharm. Sci. 2009, 98, 3933.
12. Rosende, M.; Miró, M.; Cerdà, V.; Anal. Chim. Acta 2010, 658, 41.
13. Rocha, D. L.; Rocha, F. R. P.; Int. J. Environ. Anal. Chem. 2013, 93, 1389.
14. Embrapa - Empresa Brasileira de Pesquisa Agropecuária; Sistema Brasileiro de Classificação de Solos, 1a ed.; Embrapa:
Brasília, Brasil, 2006.
15. Gee, G. W.; Or, D.; Soil Sci. Soc. Am. J. 2002, 5, 255. 16. Vettori, L.; Métodos de Análise do Solo; Ministério da
Agricultura, Divisão de Pedologia e Fertilidade do Solo: Rio de Janeiro, Brasil, 1969.
17. Embrapa - Empresa Brasileira de Pesquisa Agropecuária; Manual de Métodos de Análise do Solo, 2a ed.; Embrapa, Centro
Nacional de Pesquisa de Solos: Brasília, Brasil, 1997. 18. Braga, J. M.; Defelipo, B. V.; Rev. Ceres 1974, 21, 73. 19. Miranda, J. C.; Kamogawa, M. Y.; Reis, B. F.; Sens. Actuators B
2015, 207, 811.
20. McNaught, A. D.; Wilkinson, A.; IUPAC Compendium of Chemical Terminology (“Gold Book”), 2nd ed.; Blackwell
Scientific Publications: NC, USA, 1997.
21. Worsfold, P. J.; Gimbert, L. J.; Mankasingh, U.; Omaka, O. N.; Hanrahan, G.; Gardolinski, P. C. F. C.; Haygarth, P. M.; Turmer, B. L.; Keith-Roach, M. J.; McKelvie, I. D.; Talanta 2005, 66, 273.
22. Crouch, S. R.; Malmstadt, H. V.; Anal. Chem. 1967, 39, 1084. 23. Rocha, F. R. P.; Nóbrega, J. A.; Quim. Nova 1996, 19, 636. 24. Reis, B. F.; Giné, M. F.; Zagatto, E. A. G.; Lima, J. L. F. C.;
Lapa, R. A.; Anal. Chim. Acta 1994, 293, 129.
25. Groudpan, K.; Ampan, P.; Udnan, Y.; Jayasvati, S.; Lapanantnoppakhun, S.; Jakmunee, J.; Christian, G. D.; Ruzicka, J.; Talanta 2002, 58, 1319.
27. Neves, M. S. A. C.; Souto, M. R. S.; Tóth, I. V.; Victal, S. M. A.; Drumond, M. C.; Rangel, A. O. S. S.; Talanta 2008, 77, 527. 28. Valladares, G. S.; Pereira, M. G.; Anjos, L. H. C.; Bragantia
2003, 62, 111.
29. Fontes, M. P. F.; Weed, S. B.; Geoderma 1996, 72, 37.
30. McDowell, R.; Condron, L.; Commun. Soil Sci. Plant Anal.
2001, 32, 2531.
Submitted: August 23, 2016
Published online: October 6, 2016