Revista Brasileira de
Engenharia Agrícola e Ambiental
Campina Grande, PB, UAEA/UFCG – http://www.agriambi.com.br
v.22, n.1, p.38-44, 2018
Spatial variability of soil attributes in an experimental basin
in the semi-arid region of Pernambuco, Brazil
DOI: http://dx.doi.org/10.1590/1807-1929/agriambi.v22n1p38-44
Diego C. dos S. Araújo
1, Suzana M. G. L. Montenegro
2, Abelardo A. de A. Montenegro
1,
Valdemir de P. e Silva Junior
1& Sylvana M. dos Santos
2A B S T R A C T
This study aimed to evaluate the spatial patterns of physical and chemical properties of a soil in an experimental basin with an area of 149 km2, located in the municipality of
Pesqueira, in the semi-arid region of Pernambuco state (Brazil). Samples were taken in the layers of 0-0.10 and 0.10-0.20 m, at 35 monitoring points distributed in an irregular grid, encompassing the three soil classes present in the basin and commonly found in the semi-arid region. For the attributes of soil texture, organic carbon and bulk density in the layer of 0.10-0.20 m, spatial dependence from medium to strong was detected, ranging from 0.03 to 49.98%. Bulk density in the layer 0-0.10 m, as well as the electrical conductivity, in both layers, showed pure nugget effect, possibly due to insufficient sampling distance to capture spatial dependence. However, geostatistics represented well the spatial dynamics of soil attributes at points where the mapping is possible.
Variabilidade espacial de atributos de solo em uma bacia
experimental do Semiárido pernambucano, Brasil
R E S U M O
Objetivou-se neste estudo avaliar os padrões espaciais de variação de atributos físicos e químicos do solo em uma bacia experimental com área de 149 km2, localizada no
município de Pesqueira, semiárido Pernambucano (Brasil). As amostragens foram feitas nas profundidades de 0-0,10 e 0,10-0,20 m, em 35 pontos distribuídos em malha irregular, englobando as três classes de solo presentes na bacia e comumente encontradas no semiárido. Os dados foram analisados com base na estatística descritiva e técnicas geoestatísticas. Para os atributos textura do solo, carbono orgânico e densidade do solo na camada de 0,10-0,20 m, foi detectado grau de dependência espacial de médio a forte, variando de 0,03 a 49,98%. A densidade do solo na camada de 0-0,10 m, assim como a condutividade elétrica, nas duas camadas apresentaram efeito pepita puro, possivelmente devido a uma distância de amostragem insuficiente para captar dependência espacial. No entanto, a geoestatística representou bem a dinâmica espacial de atributos de solo nos pontos em que o mapeamento foi possível.
Key words: kriging geostatistics Caatinga
Palavras-chave: krigagem geoestatística Caatinga
1 Universidade Federal Rural de Pernambuco/Departamento de Engenharia Agrícola. Recife, PE. E-mail: [email protected] (Corresponding author);
[email protected]; [email protected]
2 Universidade Federal de Pernambuco/Departamento de Engenharia Civil. Recife, PE. E-mail: [email protected]; [email protected]
Introduction
Recent studies have demonstrated that soil is naturally subject to variation of its physical and chemical properties in space and time, resulting from the complex interaction between pedology, topography and climate.
Understanding the spatial variability of physical and chemical attributes, with either more static (e.g. texture and granulometry) or dynamic (e.g. organic carbon and electrical conductivity) behavior, is necessary to guiding strategies of agricultural management (Cruz et al., 2011; Oliveira et al., 2013), especially in semi-arid regions, where the natural Caatinga vegetation has been replaced by unstable agricultural systems, which cause alterations in soil properties (Barros & Chaves, 2014).
One technique widely used to study spatial variability is geostatistics, which has been applied in the investigation of soil physical and chemical properties in the last years. Montenegro & Montenegro (2006) conducted a study on the spatial variability of soil textural classes, salinity and electrical conductivity on an alluvial plain of the Pernambuco semi-arid region, and found that geostatistics represented well the spatial correlation between the studied attributes.
Likewise, in study carried out in an area cultivated with sugarcane, Tavares et al. (2012) managed to model the spatial variability of physical and mechanical attributes of an Argisol. At watershed scale, many studies have been carried out, validating geostatistics as an efficient tool to conduct research on spatial variability, regardless of the dimension of the studied area (Addis et al., 2015; Ferreira et al., 2015).
However, little information is available in the literature on the spatial distribution of soil attributes in microbasins of the Brazilian semi-arid region. This knowledge is essential because it can be applied in the planning and adoption of agricultural management practices, especially in small rural basins, where
the presence of housing clusters causes substantial changes in their use and occupation. Hence, this study aimed to evaluate the spatial variability of some soil physical and chemical attributes in an experimental basin of the semi-arid region of Pernambuco, Brazil.
Material and Methods
The study was conducted in the Jatobá River Experimental Basin, located in the municipality of Pesqueira – PE, Brazil, semi-arid region of Pernambuco (8° 34’ 17” and 8° 18’ 11” S; 37° 1’ 35” and 36° 47’ 20” W). The basin has total area of 149 km², with mean rainfall and temperature of 600 mm and 23 ºC, respectively. Potential annual evapotranspiration is approximately 2000 mm (Silva Junior et al., 2016).
The Jatobá River basin is typically rural, with hyperxerophilic Caatinga as the predominant vegetation, which has been replaced in the last years by different types of land use, interfering with soil properties and altering the landscape. The main soil classes found in the basin are Yellow Argisol, with presence of rocky impediment; Litholic Neosol and Regolithic Neosol (Figure 1).
Soil collection and laboratorial analyses occurred from September to December 2015, with samplings in the layers of 0-0.10 and 0.10-0.20 m, in an irregular sampling grid of 35 points.
Analyses of physical properties (bulk density and texture) and electrical conductivity (EC) of the saturated paste extract were conducted adopting the methodologies proposed by EMBRAPA (1997). Total soil organic carbon was determined through the method adapted by Yeomans & Bremner (1988), using dichromate in acid medium as oxidizing agent. To maximize carbon oxidation by dichromate, an external source of heat was used. After that, dichromate was titrated using a ferroin indicator solution.
Source: EMBRAPA (2000)
Descriptive statistical analyses consisted of measures of central tendency, dispersion and distribution. Central tendency measures allow to check for data fit to a possible normal distribution, whereas dispersion measures give an idea about the magnitude of data variability.
Data normality was verified by the Kolmogorov-Smirnov test and, to characterize the degree of variability, the coefficients of variation (CV) were analyzed as suggested by Warrick & Nielsen (1980), who consider: low variability for CV < 12%, intermediate variability for CV from 12 to 60%, and high variability for CV > 60%. Outliers were detected and removed using the methodology proposed by Libardi & Melo Filho (2006).
Spatial dependence was evaluated through the fit of a semivariogram, based on the assumption of stationarity of the intrinsic hypothesis, as shown in Eq. 1:
where:
Z - estimated value in the site Si;
z - observed value for the same site Si; and, n - number of observations.
Ordinary kriging (statistical interpolator) was used to estimate values of physical and chemical attributes in non-sampled sites and generate isoline maps. This technique considers the number of samples used, positions of the samples in the area to be evaluated, distances between samples and the zone to be estimated, as well as the spatial continuity of the studied variable (Andriotti, 2013).
Results and Discussion
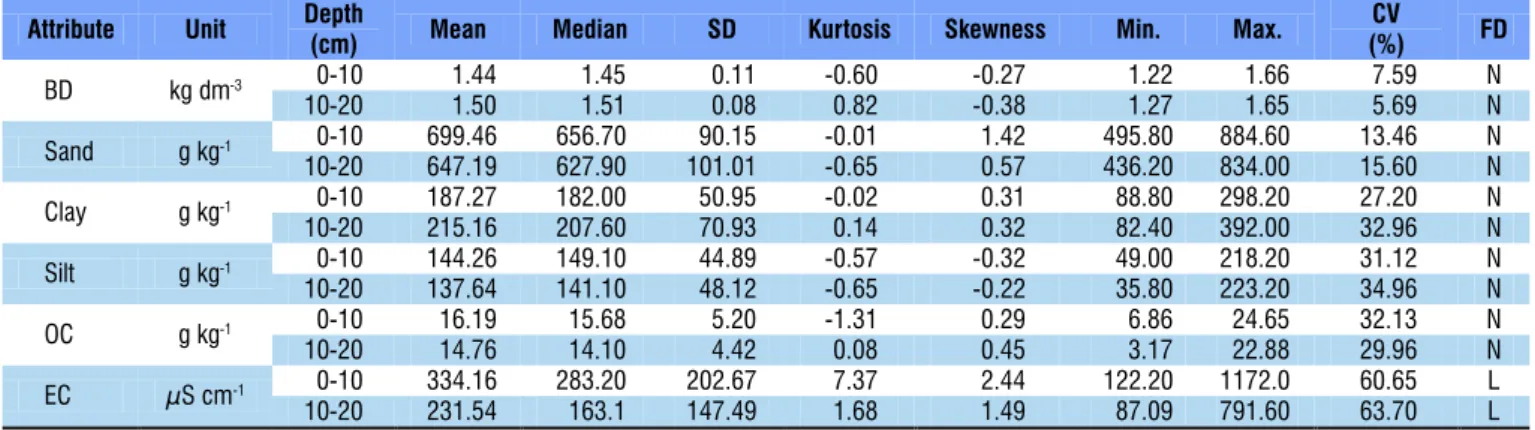
All physical and chemical properties evaluated showed normal distribution, according to the Kolmogorov-Smirnov normality test, except electrical conductivity, in both layers, which showed log-normal distribution of frequencies (Table 1). The same result was found by Montenegro & Montenegro (2006) studying the spatial patterns of soil EC on an alluvial plain of the Pernambuco semi-arid region. Gomes & Fizziola (2006) pointed out that, in arid and semi-arid regions, EC values above 4.00 dS m-1 can cause severe limitations to crop development. Thus, under the studied conditions, the soil in the Jatobá River basin does not pose serious risks to agricultural cultivation, provided that good practices of irrigation and crop management are adopted.
Bulk density data showed low coefficients of variation (< 12%), according to the classification of Warrick & Nielsen (1980). Except for EC, which exhibited high spatial variability in the area, the other attributes fit in the category of intermediate variability (< 60%). Hence, it was possible to fit semivariograms to a model that represented the spatial distribution of these attributes in the area, and they were mapped.
Table 2 shows the fit and validation parameters of the theoretical semivariograms. For the attributes bulk density in the 0-0.10 m layer and EC in both layers, the fit was not possible. This type of problem, according to Andriotti (2013),
BD - Bulk density; OC - Organic carbon; EC - Electrical conductivity; SD – Standard deviation; FD - Frequency distribution; N - Normal distribution; L - Log-normal distribution
Attribute Unit Depth
(cm) Mean Median SD Kurtosis Skewness Min. Max.
CV
(%) FD
BD kg dm-3 00-10 1.44 1.45 0.11 -0.60 -0.27 1.22 1.66 7.59 N 10-20 1.50 1.51 0.08 0.82 -0.38 1.27 1.65 5.69 N
Sand g kg-1 00-10 699.46 656.70 90.15 -0.01 1.42 495.80 884.60 13.46 N 10-20 647.19 627.90 101.01 -0.65 0.57 436.20 834.00 15.60 N
Clay g kg-1 00-10 187.27 182.00 50.95 -0.02 0.31 88.80 298.20 27.20 N 10-20 215.16 207.60 70.93 0.14 0.32 82.40 392.00 32.96 N
Silt g kg-1 00-10 144.26 149.10 44.89 -0.57 -0.32 49.00 218.20 31.12 N 10-20 137.64 141.10 48.12 -0.65 -0.22 35.80 223.20 34.96 N
OC g kg-1 00-10 16.19 15.68 5.20 -1.31 0.29 6.86 24.65 32.13 N
10-20 14.76 14.10 4.42 0.08 0.45 3.17 22.88 29.96 N
EC µS cm-1 00-10 334.16 283.20 202.67 7.37 2.44 122.20 1172.0 60.65 L 10-20 231.54 163.1 147.49 1.68 1.49 87.09 791.60 63.70 L
Table 1. Descriptive statistics of the soil physical and chemical properties in the Jatobá River basin
γ* h
N h
Z xt Z xt h
i N h
( )
=( )
= ( )
−(
+)
( )∑
1 2 2 1 where:γ*(h) - estimated semivariogram; and,
N(h) - number of pairs of measured values Z(xt) and Z(xt + h), separated by the vector h.
After obtaining the experimental semivariograms, the following models were tested: Gaussian, spherical, exponential and pure nugget effect. The best theoretical model of semivariogram was selected based on cross-validation (Mello et al., 2005). Spatial dependence degree (SDD) was analyzed using the classification proposed by Cambardella et al. (1994): (a) strong spatial dependence, SDD < 25%; (b) moderate spatial dependence, SDD between 25 and 75%; and (c) weak spatial dependence, SDD > 75%. SDD expresses the proportion, in percentage, of the nugget effect (C0) in relation to the sill (C0+C1).
Cross-validation was used to select the best model considering the errors generated by ArcGis 10.3.1 in the execution of the method, as recommended by Yang et al. (2014), namely: Mean Squared Error (Eq. 2) and Root-Mean-Square Error (Eq. 3).
may result from both inadequate sampling and factors inherent to the studied attribute itself, which does not show spatial dependence due to various factors. In the case of the Jatobá River basin, the limitation in the number of points and little comprehensive spatialization in the sampling grid distribution probably caused this result. Souza et al. (2007), studying EC spatial variability also in the semi-arid region, in area irrigated with moderately saline water, detected the presence
of pure nugget effect until the 0-0.20 m layer in two out of four monitoring times, as well as accentuated nugget effect in the others in which spatial modeling could be performed.
The spatial dependence degree (SDD) was classified as moderate for silt in the 0-0.10 m layer and for OC in both layers. The other attributes showed strong SDD and none of them was classified as with weak spatial dependence. According to Ávila et al. (2010), this indicates that the kriging interpolator
Table 2. Fit and validation parameters of the theoretical semivariograms of soil properties
Attribute Unit Depth
(cm) C0 C0+C1 a Model
SDD
(%) MSE RMSE
BD kg dm-1 0-10 - - - PNE - -
-10-20 0.003 0.03 1200.0 GAU 12.24 0.0078 1.0723
Sand g kg-1 0-10 10.000 4682.00 480.0 SPH 0.21 0.0083 1.0010 10-20 10.000 6368.00 792.0 EXP 0.16 0.0036 1.0601
Clay g kg-1 0-10 1.000 1445.00 393.0 EXP 0.07 -0.0225 1.2642 10-20 1.000 3087.00 381.0 EXP 0.03 0.0143 1.2503
Silt g kg-1 0-10 815.00 2043.00 900.7 GAU 39.89 -0.0058 0.9623 10-20 644.00 3216.00 1248.1 GAU 20.02 -0.0044 1.1269
OC g kg-1 0-10 16.640 33.29 486.0 EXP 49.98 0.0102 1.0783 10-20 10.510 30.88 848.0 EXP 34.03 0.0155 1.0732
EC µS cm-1 0-10 - - - PNE - -
-10-20 - - - PNE - -
-C0 - Nugget effect; C0+C1 - Sill; a - Range; SDD - Spatial dependence degree (%); MSE - Mean Squared Error; RMSE - Root-Mean-Square Error; GAU - Gaussian model; SPH - Spherical model; EXP - Exponential model; PNE - Pure nugget effect
C0 - Nugget effect; C0+C1 - Sill; A - Range
will lead to good results, considering the good structure of spatial dependence between the sampled points.
Regarding the models of theoretical semivariograms fitted and selected (Figure 2), it can be noted that bulk density (Figure 2A) and silt (Figure 2D), in the 0.10-0.20 m, exhibited the highest values of range, about 1200 and 1248.1 m, respectively, both fitted to the Gaussian model.
For all cases in which it was possible to spatially model the studied attribute, the generated maps were representative (Figure 3), since the interpolation only considers sampling points that are within the radius of influence of the range. Gomes et al. (2007), studying the same attributes in a 477 ha sub-basin in Minas Gerais, also found high values of range for some properties, such as sand (A = 3000 m) and clay (A = 1236.63 m). For the attributes bulk density and silt, these authors found ranges of 425.90 and 291.48 m, respectively, evidencing a smaller structure of spatial dependence.
In general, the maps of texture confirm the pedological classification of the basin, with predominance of the clay fraction upstream, where Yellow Argisol is present, and high
sand content downstream, where Regolithic Neosol and Litholic Neosol are distributed.
Bulk density (Figure 3G), in the modeled layer (0.10-0.20 m), was more representative in the upstream portion of the basin, where there is more predominance of the sand fraction. This result is expected, because sand particles do not form aggregates. Hence, the total quantity of pores is lower than in the clay fraction, which consequently gives it higher mass due to the smaller volume of voids (air), with more-representative values of bulk density (Marcolin & Klein, 2011).
Yang et al. (2014), studying the spatial distribution of the organic carbon in desert area in China, detected negative correlation between bulk density and OC content. In the Jatobá River basin, a similar behavior was observed, highlighting that the fractions with higher clay and silt fractions present in less dense regions retain greater quantity of OC. Adubuwaili et al. (2012) also comment that OC spatial distribution is dynamic in space and time, and strongly depends on anthropic action, which constantly alters land use and eventually influences this attribute.
Prediction standard error maps (Figure 4) also give an idea about the magnitude of the uncertainties associated with the kriging. In all attributes mapped in both layers, the standard error was lower in 0-0.10 m, indicating greater stability in these points. Furthermore, some soil properties exhibit higher spatial dependence, with lower errors of interpolation, such as silt and density, indicating the efficiency of the method in the present study.
Conclusions
1. The soils of the basin exhibit relatively low values of electrical conductivity, which gives them a good agricultural potential, especially in the central and upstream portions, due to the higher contents of clay and organic carbon associated with lower bulk density, thus requiring the adoptions of good practices of irrigation and crop management.
2. Despite the reduced number of points, it was possible to perform good analysis of spatial variability, with dependence ranging from moderate to strong for all properties mapped.
Acknowledgments
The authors thank the Financier for Studies and Projects (FINEP) for funding the REHIDRO 1830 project; the National Council for Scientific and Technological Development (CNPq) for the Research Productivity grants and for funding the Universal - MCTI/CNPq Nº 14/2014 and MCTI/CNPq/ANA N.23/2015 projects; the Pernambuco Science and Technology Support Foundation (FACEPE) for the Master’s scholarship.
Literature Cited
Addis, H. K.; Klik, A.; Strohmeier, S. Spatial variability of selected soil attributes under agricultural land use system in a mountainous watershed, Ethiopia. International Journal of Geosciences, v.6, p.605-613, 2015. https://doi.org/10.4236/ijg.2015.66047
Andriotti, J. L. S. Fundamentos de estatística e geoestatística. São Paulo: UNISINOS, 2013. 165p.
Ávila, L. F.; Mello, C. R. de; Silva, A. M. da. Continuidade e distribuição espacial da umidade do solo em bacia hidrográfica da Serra da Mantiqueira. Revista Brasileira de Engenharia Agrícola e Ambiental, v.14, p.1257-1266, 2010. https://doi.org/10.1590/ S1415-43662010001200002
Barros, J. D. S.; Chaves, L. H. G. Change in soil chemical properties under different farming systems exploration in semiarid region of Paraiba. African Journal of Agricultural Research, v.9, p.2436-2442, 2014. https://doi.org/10.5897/AJAR2014.8637
Cambardella, C. A.; Moorman, T. B.; Novak, J. M.; Parkin, T. B.; Karlen, D. L.; Turco, R. F.; Konopka, A. E. Field-scale variability of soil properties in central Iowa soils. Soil Science Society of America Journal, v.58, p.1501-1511, 1994. https://doi.org/10.2136/ sssaj1994.03615995005800050033x
Cruz, J. S.; Assis Júnior, R. N. de; Matias, S. S. R.; Camacho-Tamayo, J. H. Spatial variability of an Alfisol cultivated with sugarcane. Ciencia e Investigación Agraria, v.38, p.155-164, 2011. https:// doi.org/10.4067/S0718-16202011000100015
EMBRAPA - Empresa Brasileira de Pesquisa Agropecuária. Manual de métodos de análises de solo. 2.ed. Rio de Janeiro: Ministério da Agricultura e do Abastecimento, 1997. 212p.
EMBRAPA - Empresa Brasileira de Pesquisa Agropecuária. Levantamento de reconhecimento de baixa e média intensidade dos solos do Estado de Pernambuco. Rio de Janeiro: Embrapa Solos, 2000. 382p.
Ferreira, V.; Panagopoulos, T.; Andrade, R.; Guerrero, C.; Loures, L. Spatial variability of soil properties and soil erodibility in the Alqueva reservoir watershed. Solid Earth, v.6, p.383-392, 2015. https://doi.org/10.5194/se-6-383-2015
Gomes, M. A. F.; Filizola, H. F. Indicadores físicos e químicos de qualidade de solo de interesse agrícola. Jaguariúna: EMBRAPA, 2006. 8p.
Gomes, N. M.; Faria, M. A. de; Silva, A. M. da; Mello, C. R. de; Viola, M. R. Variabilidade espacial de atributos físicos do solo associados ao uso e ocupação da paisagem. Revista Brasileira de Engenharia Agrícola e Ambiental, v.11, p.427-435, 2007. https:// doi.org/10.1590/S1415-43662007000400013
Libardi, P. L.; Melo Filho, J. F. de. Análise exploratória e variabilidade dos parâmetros da equação da condutividade hidráulica, em um experimento de perfil instantâneo. Revista Brasileira de Ciências do Solo, v.30, p.197-206, 2006. https://doi.org/10.1590/S0100-06832006000200001
Marcolin, C. D.; Klein, V. A. Determinação da densidade relativa do solo por uma função de pedotransferência para a densidade do solo máxima. Acta Scientiarum. Agronomy, v.33, p.349-354, 2011. Mello, J. M. de; Batista, J. L. F.; Ribeiro Junior, P. J.; Oliveira, M. S.
de. Ajuste e seleção de modelos espaciais de semivariograma visando à estimativa volumétrica de Eucaliptus grandis. Scientia Florestalis, v.1, p.25-37, 2005.
Montenegro, A. A. de A.; Montenegro, S. M. G. L. Variabilidade espacial de classes de textura, salinidade e condutividade hidráulica de solos em planície aluvial. Revista Brasileira de Engenharia Agrícola e Ambiental, v.10, p.30-37, 2006. https:// doi.org/10.1590/S1415-43662006000100005
Oliveira, I. A. de; Campos, M. C. C.; Soares, M. D. R.; Aquino, R. E. de; Marques Júnior, J.; Nascimento, E. P. do. Variabilidade espacial de atributos físicos em um cambissolo háplico, sob diferentes usos na região sul do Amazonas. Revista Brasileira de Ciência do Solo, v.37, p.1103-1112, 2013. https://doi.org/10.1590/S0100-06832013000400027
Silva Junior, V. P.; Montenegro, A. A. de A.; Melo, R. O. de. Temporal stability of soil moisture in an experimental watershed in the Pernambuco semi-arid region. Revista Brasileira de Engenharia Agrícola e Ambiental, v.20, p.880-885, 2016. https://doi. org/10.1590/1807-1929/agriambi.v20n10p880-885
Souza, E. R. de; Montenegro, A. A. de A.; Santos, F. X. dos; Costa Neto, M. L. da. Dinâmica da condutividade elétrica em Neossolo Flúvico no semi-árido. Revista de Biologia e Ciências da Terra, v.7, p.132-139, 2007.
Tavares, U. E.; Rolim, M. M.; Pedrosa, E. M. R.; Montenegro, A. A. de A.; Magalhães, A. G.; Barreto, M. T. L. Variabilidade espacial de atributos físicos e mecânicos de um Argissolo sob cultivo de cana-de-açúcar. Revista Brasileira de Engenharia Agrícola e Ambiental, v.16, p.1206-1214, 2012. https://doi.org/10.1590/S1415-43662012001100009 Warrick, A. W.; Nielsen, D. R. Spatial variability of soil physical
properties in the field. In: Hillel, D. (ed.). Applications of soil physics. New York: Academic, 1980. Cap.2, p.319-344. https:// doi.org/10.1016/B978-0-12-348580-9.50018-3
Yang, R.; Su, Y.; Wang, M.; Wang, T.; Yang, X.; Fan, G.; Wu, T. Spatial pattern of soil organic carbon in desert grasslands of the diluvial-alluvial plains of northern Qilian Mountains. Journal of Arid Land, v.6, p.136–144, 2014. https://doi.org/10.1007/s40333-013-0200-0 Yeomans, J. C.; Bremner, J. M. A rapid and precise method for routine