Selection indices for agronomic traits in segregating populations of
soybean
1Índices de seleção para caracteres agronômicos em populações segregantes de
soja
Eduardo Henrique Bizari2*, Bruno Henrique Pedroso Val2, Elise de Matos Pereira2, Antonio Orlando Di
Mauro2and Sandra Helena Unêda-Trevisoli2
ABSTRACT - In genetic improvement of the soybean crop, the selection process is complex and greatly influenced by the environment. One of the alternatives for facilitating this process is the use of selection indices, making it possible to select desirable genotypes for the early generations of breeding programs. The aim of this study was to compare different selection indices in segregating populations of soybean, indicating methods which are superior in various situations, and proposing economic weightings in order to obtain higher gains. Direct and indirect selection criteria were used, together with the classic Smith-Hazel index, an index based on the sum ranks of Mulamba and Mock, a Williams base index, an index based on the desired gains of Pesek and Baker, and a genotype-ideotype distance index. The genetic material consisted of seven F5 generation soybean populations, giving a total of 386 progeny, conducted in a Federer augmented-block design, with the following characteristics being evaluated: number of days to maturity, plant height at maturity, insertion height of the first pod, lodging, agronomic value, number of pods per plant, oil content and grain yield. According to the results, the classic index and base index showed the smallest variations in gains in the different situations and economic weightings under study. The index based on the sum of ranks using agronomic value and grain productivity as the main characteristics with an economic weighting of one, gave the most favourable gains under the conditions of this study.
Key words:Glycine max. Selection criteria. Genetic improvement.
RESUMO -No melhoramento genético da cultura da soja, o processo de seleção é complexo e altamente influenciado pelo ambiente. Uma das alternativas para facilitar esse processo é a utilização de índices de seleção, possibilitando a seleção de genótipos desejáveis em gerações iniciais de programas de melhoramento. O objetivo do presente trabalho consistiu em comparar diferentes índices de seleção em populações segregantes de soja, indicando os métodos superiores em várias situações e pesos econômicos propostos, visando a obtenção de maiores ganhos. Foram utilizados os critérios da seleção direta e indireta, índice clássico de Smith e Hazel, índice baseado em soma de postos de Mulamba e Mock, índice base de Willians, índice baseado nos ganhos desejados de Pesek e Baker e índice da distância genótipo-ideótipo. O material genético consistiu de sete populações de soja em geração F5, totalizando 386 progênies, conduzidas no delineamento de blocos aumentados de Federer, sendo avaliados os caracteres: número de dias para maturidade, altura de planta na maturidade, altura de inserção da primeira vagem, acamamento, valor agronômico, número de vagens por planta, teor de óleo e produtividade de grãos. De acordo com os resultados obtidos, o índice clássico e índice base foram os que apresentaram menores variações quanto aos ganhos obtidos nas diferentes situações e pesos econômicos estudados. O índice baseado na soma de postos utilizando os caracteres valor agronômico e produtividade de grãos como caracteres principais, além do peso econômico 1 (um) proporcionou os ganhos mais favoráveis nas condições no presente estudo.
Palavras-chave:Glycine max. Critérios de seleção. Melhoramento genético.
DOI: 10.5935/1806-6690.20170012 *Autor para correspondência
1Recebido para publicação em 09/06/2014; aprovado em 22/03/2016
Parte da Dissertação de Mestrado do primeiro autor apresentada ao Programa de Pós-graduação em Agronomia/Genética e Melhoramento de Plantas/ Faculdade de Ciências Agrárias e Veterinárias, Universidade Estadual paulista/UNESP, Campus de Jaboticabal
2Departamento de Produção Vegetal, Faculdade de Ciências Agrárias e Veterinárias/UNESP, Via de Acesso Prof. Paulo Donato Castellane, s/n,
INTRODUCTION
The soybean [Glycine max (L.) Merrill] is the
most important oilseed crop in Brazil, and is the main agricultural product to be exported by the country. In the 2014/2015 agricultural year, domestic production reached 96.24 million tonnes (CONAB, 2015). This success, both in production and agribusiness, is in part due to genetic improvements from the launch of cultivars which are adapted to almost all regions of the country. In this continuing process, knowledge of the genetic diversity of the materials is extremely important, as this will result in better targeting of future crosses (BIZARIet al., 2014).
The selection of superior progeny for breeding programs is not an easy task, as the important characters, which are in the main quantitative, display complex behaviour, are highly influenced by the environment, and may be correlated in such a way that selecting one character produces change in another (CRUZ, 2006).
To reduce this problem, one strategy employed by breeders is the use of selection indices, which seeks to combine all the characters into just one index (number) for each selection unit, then making selections based on the values of these indices, evaluating the indirect answers expected from the original characters and reducing the time necessary to achieve the desired genotypes (CRUZ; REGAZZI; CARNEIRO, 2012).
When different selection criteria are considered, predictions of gain for each criteria is important for guiding the breeder in the use of available genetic material, with a view to maximizing gains for the characters of interest (PAULAet al., 2002).
Works with selection indices has been successfully carried out in the eucalyptus (MARTINS; MARTINS,
PINHO, 2006; PAULAet al., 2002), soybean (BÁRBARO
et al., 2007; COSTA et al., 2004), maize (FREITAS
JÚNIORet al., 2009), popcorn (RANGELet al., 2011),
açaí (TEIXEIRAet al., 2012), cowpea (MAGALHAES
et al., 2010) and passion fruit (ROSADOet al., 2012).
The aim of this study was to compare different selection indices in segregating populations of soybean, indicating methods which are superior in various situations, and suggested economic weights in order to obtain greater gains.
MATERIAL AND METHODS
The experiment was carried out during the 2012/2013 agricultural year, on the Experimental Teaching and Research Farm (FEPE) of the Júlio de Mesquita Filho State University in Jaboticabal, in the State of São
Paulo (SP). The experiment comprised seven F5 soybean
populations, derived from bi-parental crosses (Conquista x Matrinxã, Renascença x Sambaíba, Renascença x Matrinxã, Sambaíba x IAC 17, Confiança x Sambaíba, Conquista x Kinoshita, BRS 231 x Matrinxã). The design was of Federer augmented blocks (1955), consisting of 25 blocks with two checks per block (Conquista and Coodetec 216). The lots consisted of rows, 5 m in length and spaced 0.5 m apart, with a density of 20 plants per metre, giving a total of 386 progeny. Six plants per lot were evaluated in the analyses. Cultivation followed the recommendations for soybean crops (EMBRAPA, 2010).
The statistical model for the analysis of augmented blocks is given by Equation 1:
Yij = µ + i + Bj + ij (1)
where:Y
ij is the value of the character for the ith treatment
in the jth block; is the general mean; i is the effect of the
ith treatment, which can be broken down into: T
i: effect
of the ith control, with i = 1, 2...t and Gj
i: effect of the ith genotype, with i = 1, 2...gj;B
j is the effect of the jth block,
with j = 1, 2...b; and ijis the random error.
The characters evaluated were: number of days to maturity (NDM), in days; plant height at maturity (PHM), in cm; insertion height of the first pod (IHP), in cm; lodging (Lg), a graded scale ranging from 1.0 (upright) to 5.0 (flat); agronomic value (AV), a graded scale ranging from 1.0 (no agronomic value) to 5.0 (excellent); number of pods per plant (NP); oil content (OC) as a percentage; and grain yield (GY) in kg ha-1.
Analysis of the oil content was carried out by near infrared spectrometry (NIR), using the Tango spectrometer from Bruker. The equipment measures the wavelength and absorption intensity of near infrared light for the sample. This method is non-destructive, which is important in the early stages of soybean breeding programs, where a reduced number of seeds are used for generation advancement.
Statistical analysis was done using the Genes software (CRUZ, 2007). For the characters Lg and AV, the data were transformed by X for a better fit to the normal distribution curve. The heritability coefficients that were calculated were estimated for mean values of the progeny, using the ratio of genotipic to phenotypic variance, obtained with the analysis of variance in the trial employing augmented blocks.
For analysis of the selection indices, the economic weights and desired gains were established from experimental data obtained by the authors, as recommended by Cruz (1990).
the classic index (HAZEL, 1943; SMITH, 1936); an index based on the sum of ranks (MULAMBA; MOCK, 1978); a base index (WILLIAMS, 1962), an index based on desired gains (PESEK; BAKER, 1969) and an index of the genotype-ideotype distance (CRUZ, 2006). To date no studies have been found that use this last index in analysing segregating populations of soybean.
With the use of direct and indirect selection, it is to be expected that gains be obtained in the single character for which selection is made, and depending on the association of this character with the remainder, there may be favourable or unfavourable responses in characters of secondary importance which are not being considered in the selection process. For direct selection, the expected gain in the ith character (GSi) can be estimated with formula 2 based on the selection differential (CRUZ, 2006):
GSi = (Xsi + Xoi)h2 i = DSih
2
i (2)
where: Xsi = mean value of individuals selected for the
character i; Xoi= original population mean value;DSi =
selection differential practiced in the population; h2 i =
heritability of character i. The indirect gain in character j, by selecting for character i, is given by: GSj(i)=DSj(i)h2
j,
where DSj(i) is the selection differential for indirect
selection, obtained as a function of the mean value of the character for those individuals whose superiority was verified based on a further character for which the direct selection was made.
The classic index (HAZEL, 1943; SMITH, 1936) comprises a linear combination of various characters of economic importance, with the weighting coefficients being estimated so as to maximize the correlation between the index and the aggregate genotype. This is established by another linear combination involving genetic values which are weighted by their respective economic values. The selection index (I) and aggregate genotype (M) will then be described as below (Equation 3):
(3)
where:n is the number of characters evaluated;b is the
vector of dimension 1 x n, of the weighting coefficients for the selection index to be estimated;y is the matrix of
dimension n x p (plants), of phenotypic values for the characters;a is the vector of dimension 1 x n, of previously
established economic weights;g’ is the matrix of dimension
n x p, of unknown genetic values for the n characters being considered. Thus, vectorb = P-1 Ga, where P-1 is
the inverse matrix of dimension n x n, of the phenotypic variance and covariance between the characters;G is the
matrix of dimension n x n, of the genetic variance and covariance between the characters.
The expected gain for character j when selection is made from the index is expressed by equation 4:
gj(i) = DSj(i)h2
j (4)
where: gj(I) = gj(I) is the expected gain for character j, with selection based on index I; DS j(i) is the selection differential for character j, with selection based on index I; and h2
j is the heritability for character j.
The index based on the sum of ranks (MULAMBA; MOCK, 1978) consists in classifying the genotypes for each character in an order which is favourable for breeding. The different orders of each genotype are then summed, resulting in the selection index as follows: I = r1 + r2 + ...+ rn , where I is the value of the index for
a particular individual or family; rj is the classification
of an individual in relation to the jth character; n is the number of characters considered in the index. In addition, the breeder may want the sort order of the variables to have different, specified weights. It therefore follows that
I = p1r1+p2r2+... + pnrn, where pj is the economic weight
attributed by the user to the jth character.
The base index (WILLIAMS, 1962) proposes the establishment of indices by the linear combination of the mean phenotypic values of the characters weighted directly by their respective economic weights. The following index is used as the selection criterion (Equation 5):
(5)
where: y are the mean values and a are the economic
weights of the economic characters under study.
The index based on desired gains (PESEK; BAKER, 1969) proposes replacement of the economic weights by the desired gains for a character. Construction of the index involves knowledge of the expression for the expected gain of each character, as defined by Equation 6:
(6)
where: g is the gain estimated by the index, G is the matrix of dimension n x n, of the genetic variance and covariance
between the characters; b is the vector of dimension 1
x n, of the weighting coefficients of the selection index to be estimated;iis the selection differential in standard
deviation units for index I; I is the standard deviation
of index I. Substituting g by gd, which is the vector
of the desired gains, and eliminating that does not affect proportionality of the coefficientsb’s,b is estimated from
the expression . The coefficients will give the maximum gains for each character, based on the specification of the desired gains (CRUZ; REGAZZI; CARNEIRO, 2012).
well as the range of values considered favourable for breeding. For each variable, the mean, maximum and
minimum values are calculated.X
ij is considered the mean
phenotypic value of the ith genotype in relation to the jth character,Y
ij the transformed mean phenotypic value, and
C
j a constant relative to depreciation of the mean value for
the genotype where this does not fall within the standards required by the breeder. Therefore:LIj = the lower limit to
be presented by the genotype for character j, according to the standard desired by the breeder;LS
j = the upper limit
to be presented by the genotype andVO
j = the optimal
value to be presented by the genotype under selection.
If LIj Xij LSj, then Yij= Xij;
If Xij < LIj, Yij = Xij + VOj – LIj– Cj;
If Xij > LSj, Yij = Xij + VOj – LSj +Cj.
The procedure considers Cj= LSj – Lij. The value ofCj guarantees that any value forXij within the range of
variation around the optimum will result in a value forYij
with a magnitude close to the optimal value (VOj), unlike
the values forXij outside of this range. Transformation of Xij is therefore carried out to guarantee the depreciation of
those phenotypic values outside of the range. The values forYij obtained by transformation are then standardised
and weighted by the weights assigned to each character, giving values for yij, as specified below in equation 7:
(7)
where: S(Y
j) is the standard deviation of the mean
phenotypic values obtained with the transformation; and
a
jis the weight or economic value of the character. For the
calculation, the standardisation and weighting ofVO
j are
also required, as specified by .
The values for the index (GID) are then calculated, expressed by the distances between the genotypes and the ideotype, as shown :
Based on this index, the best genotypes can be identified and the selection gains calculated.
In the analysis of the gains resulting from the direct and indirect selections made individually for each character, only one character was considered to be the principal, with an economic weight of one; the remainder were considered to be secondary characters, with a weight of zero.
For the remaining indices, three situations were considered in determining the principal character: I - grain yield (GY) and agronomic value (AV) as the principal characters; II - grain yield (GY), agronomic value (AV), number of pods (NP) and oil content (OC) as the principal characters; III - all eight characters as principal.
The economic weights and desired gains were established from experimental data obtained by the authors, as recommended by Cruz (1990).
For the classic index, the index based on the sum of ranks, and the base index, the economic values established for the principal characters were: a value of 1 (one), the genetic coefficient of variation (CVg) for the character, and the ratio of the genetic coefficient of variation to the experimental coefficient of variation (CVg/CVe); a value of zero, assumed by the secondary characters. For the desired gains index (DGI), the economic weights employed were CVg and genetic standard deviation. For the index based on the genotype-ideotype distance (GID), only the economic weight of 1 was used, the optimal value being considered the maximum value, and the mean value considered the minimum. However, for the characters number of days to maturation and lodging, the optimal value was considered to be the minimum and the maximum value considered to be the mean.
In the calculations for predicting gains, a selection of 23.5% of the progeny was adopted for all indices, giving a total of 90 genotypes. For the characters NDM and Lg, a decrease in values was required, since in general, the aim of breeding is for early and erect genotypes, the latter so as to favour mechanical harvesting. For these characters therefore, with direct selection and the index based on the sum of ranks, the direction of selection adopted was towards the lower end, whereas for the remaining indices, the economic weights assumed negative values so as to rank genotypes with a lower NDM and Lg.
RESULTS AND DISCUSSION
The analysis of variance for the augmented blocks indicated significant differences between the genotypes for the characters NDM, IHP, Lg, AV, OC and GY, whereas for PHM and NP no significant differences were seen (Table 1).
The CVg to CVe ratios displayed values which were greater than one for all characters, showing this condition to be satisfactory for selection (CRUZ; REGAZZI; CARNEIRO, 2012).
The character which returned the greatest value for the estimates of heritability was NDM (91.7%) followed by OC (86.21%), AV (74.97%) and GY (71.31%). In turn, the lowest values were found for the characters NP (54.19%), PHM (65.73%) and Lg (66.65%).
Table 1 - Summary of the analysis of variance for the characters number of days to maturation (NDM), height of first pod insertion (IHP), plant height at maturation (PHM), lodging (Lg), agronomic value (AV), number of pods (NP), oil content (OC) and grain yield (GY), in 386 segregating populations of soybean during the 2012/2013 agricultural year, Jaboticabal, SP
Treat (Adj): adjusted treatments; CV: general coefficient of variation; CVg: genetic coefficient of variation; CVe: experimental coefficient of variation; h2: heritability,nsNot significant by F-test, * and **Significant at 5% e a 1% probability by F-test respectively
Source of variation DF QM
NDM IHP PHM Lg AV NP OC GY
Blocks 24 151.25 159.08 1532.45 0.23 0.03 5561.15 6.73 1829772.36
Treat (Adj) 387 40.7** 15.01** 99.31ns 0.01* 0.01** 749.27ns 0.55** 1151346.19*
Weighted mean 121.44 15.76 94.57 1.17 1.68 95.70 21.07 3524.39
CV(%) 0.9 16.15 8.63 7.69 2.63 24.14 1.83 21.24
CVg (%) 2.96 23.42 11.87 10.75 4.56 25.86 4.58 33.20
CVg/CVe 3.32 1.47 1.38 1.41 1.73 1.09 2.50 1.58
h² (%) 91.7 68.43 65.73 66.65 74.97 54.19 86.21 71.31
Variable(1) Xo h2 GS%
NDM IHP PHM Lg AV NP OC GY Total
NDM 121.44 91.70 3.29 -3.02 -5.72 3.43 -0.09 -8.02 -1.21 -6.31 -17.65
IHP 15.76 68.43 -0.27 27.55 -3.54 5.1 0.62 -11.55 0.88 5.74 24.53
PHM 94.57 65.72 -0.99 -8.38 12.68 -7.62 -1.1 5.6 -0.25 3.39 3.33
Lg 1.37 66.65 1.58 1.82 -6.65 10.04 1.45 -6.6 -2.29 -2.32 -2.97
AV 2.82 74.97 -0.34 -4.04 -0.49 1.79 3.94 9.63 -0.84 10.02 19.67
NP 95.7 54.19 -1.56 -5.7 2.37 -5.72 0.52 26.34 -1.28 -4.57 10.40
OC 21.07 86.20 0.42 2.86 -1.86 -0.27 -1.15 -4.85 4.61 -2.88 -3.12
GY 3524.39 71.31 -0.25 0.06 0.62 1.48 0.9 -2.31 0.62 34.58 35.70
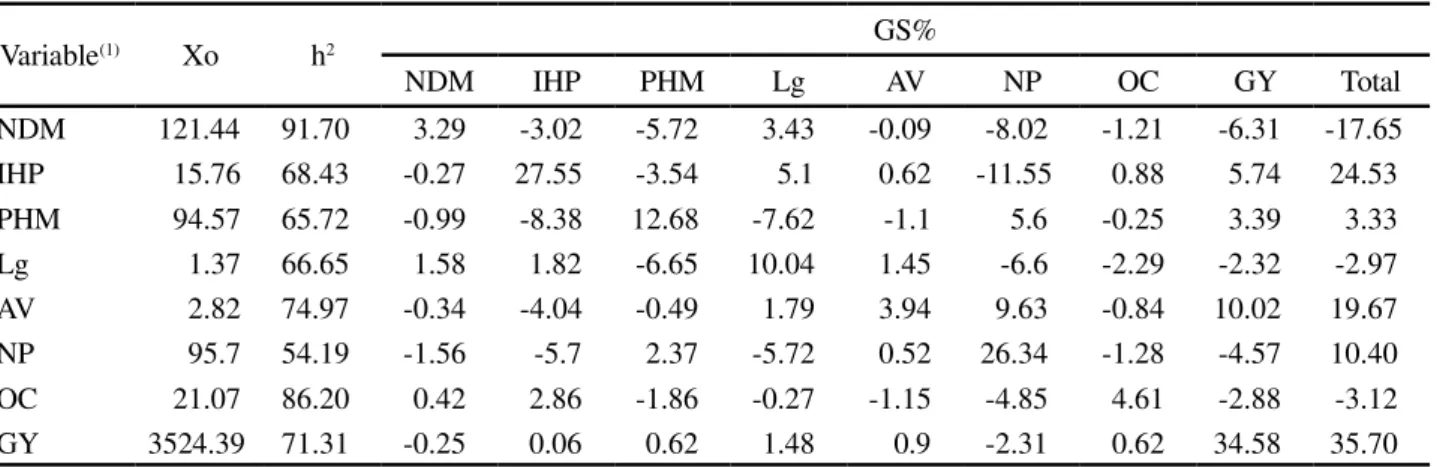
The greatest gains from direct selection were for the following characters: GY (34.58%), IHP (27.55%), NP (26.34%) and PHM (12.68%). Whereas direct selection for the character NDM returned the lowest individual gain (3.29%), which was expected, since this character had the lowest genetic coefficient of variation (Table 2).
Barbaroet al. (2007) and Costaet al. (2004) found
similar gains for direct selection in the soybean, with the largest gains seen for the characters, GY and IHP. These gains are due to the greater genetic variation of these characters.
For direct selection, the highest values for total gains were found with selection by GY (35.7%) followed by IHP (24.53%) and AV (19.67%). Whereas direct
Table 2 - Estimates of selection gains (GS%) found by direct selection for the eight characters under test, considering each character as the principal character, in 386 segregating populations of soybean during the 2012/2013 agricultural year, Jaboticabal, SP
(1)Number of days to maturity (NDM), insertion height of the first pod (IHP), plant height at maturity (PHM), lodging (Lg), agronomic value (AV),
number of pods (NP), Oil content (OC) and grain yield (GY); Xo: general mean; h2: heritability
selection for the characters NDM (-17.65%), Lg (-2.97%) and OC (-3.12%) gave negative values for total gains (Table 2).
The gains obtained from direct selection were lower than those found by Costaet al. (2004), but this
result was expected, since that author worked with
F2 populations of soybean, where there is a greater
variability and range of data, resulting in greater gains. However, the present study showed similar results to
those obtained by Barbaroet al. (2007), who also used
F5 soybean populations.
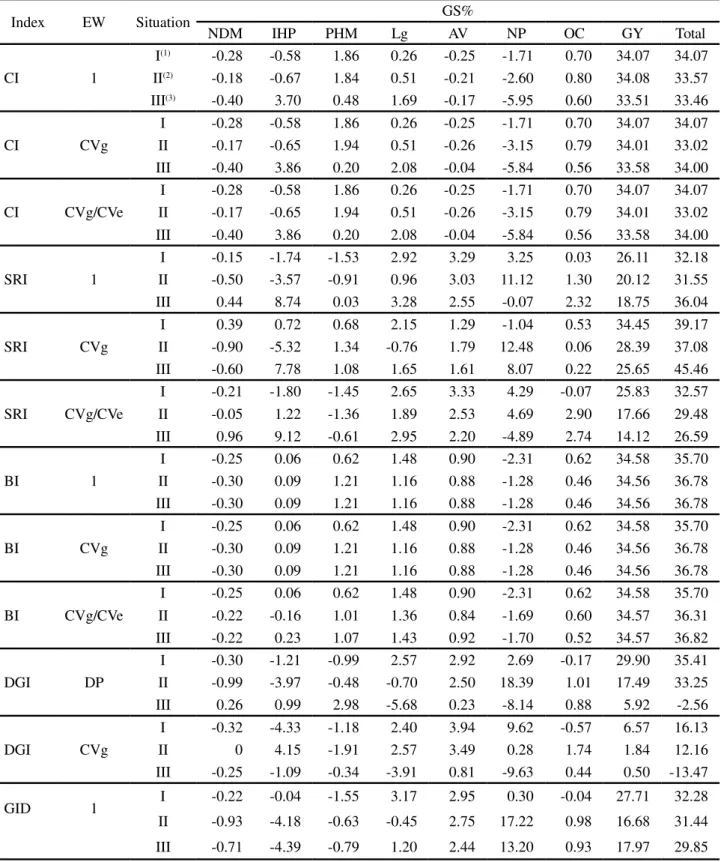
the characters NDM, IHP, AV and NP. In situation II, the economic weights CVg and CVg/CVe also did not differ, however economic weight 1 provided a small advantage to the characters GY, OC, NP and AV, increasing total gain. For situation III there was an increase in gain for the characters IHP and Lg, but values decreased for AV, NP, OC and especially GY, characters which are fundamental to the selection process in the soybean (Table 3).
According to Table 3, the classic index in general did not show great variation between the situations or economic weights under study. For the character PG, gain varied from 33.51% to 34.07%, while for total gain
the values were between 33.02% and 34.07%. Costa et
al. (2004) found similar values using PG and AV for the
principal characters, with all characters being used as principal in the third situation. Paulaet al. (2002), using
the classic index in the eucalyptus, also did not find a great range of values for gain with different economic weights.
The index based on the sum of ranks (SRI), with the exception of situation I and the economic weight CVg, gave lower values than the classic index for the character GY. Situation III, with the economic weight CVg, gave the highest total gain for all the indices at 45.46%, but the gain for PG (25.65%) was far lower than the best results for this character. Further, with the index based on the sum of ranks, the economic weight CVg gave the greatest values for total gains and the character PG in all the situations being analysed, demonstrating the efficiency of this parameter as an economic weight with this index. The index displayed a higher range of values, but overall the values for PG were lower than with the classical or base index (Table 3).
The SRI in situation II and for the economic weight CVg/CVe gave the largest gains for OC (2.90%). The character OC, despite having a negative correlation to protein content, is very important in soybean breeding, as it is the main oilseed crop used for biodiesel production in Brazil (MARQUES; ROCHA; HAMAWAKI, 2008).
Further in relation to the SRI, situation I using the economic weight CVg gave a favourable result in the selection process, with a total gain of 39.17% and a gain for PG with a value close to that for direct selection (34.45%), as well as returning positive results for NDM,
IHP, PHM, Lg, AV and OC (Table 3). Costaet al. (2004)
and Barbaroet al. (2007) concluded that, when compared
to the others indices, the ISP was the most appropriate. The base index (BI) in situation I for all the economic weights under study, gave the same values for gain. These values were the same as those found by direct selection for the character GY, indicating no advantage for direct selection from situation I with the IB. Situations II and III for the economic weights 1 and CVg also showed no difference. These conditions produced good values for
GY (34.56%), but showed decreases for NP (-1.28%) and NDM (-0.3%) (Table 3).
The index based on desired gains was generally inefficient in the situations under study. The use of the economic weight SD (standard deviation) produced greater gains than did CVg. With this index, the least satisfactory results were found in situation III, which gave reduced gains for GY (5.92% and 0.5%), as well as unfavourable values for NP (-8.14% and -9.63%) and Lg (-5.68% and -3.91%) (Table 3).
Also for the DGI, the most favourable values were found in situation I with the economic weight SD, where gains of 29.9% were seen for GY, with good values for Lg (2.57%), AV (2.92%) and NP (2.69%). Still using SD as the economic weight, situation II produced the second largest gain for NP (18.39%), bettered only by direct selection (26.34%). In general, this index did not give satisfactory gains in relation to the CI, SRI or BI. Costaet al. (2004) did not find good results using this
index; use of the DGI is therefore not recommended in segregating populations of soybean.
The index based on genotype-ideotype distance did not give good values for gain for the character GY (17.97% to 27.71%), being below the values found with CI and BI. Moreover, decreases were found for NDM, IHP and PHM in all situations, demonstrating the inefficiency of the index in this study (Table 3). Although the index did not produce good results in this study, Silva and Viana (2012) and Vasconceloset al. (2010) found greater
and well-distributed gains for the main characters of the passion fruit and alfalfa respectively.
In relation to the indices studied in the present work, situation III produced the lowest values for the character GY, but displayed a better distribution of gains for the other characters. Situation I gave the greatest gains for GY, the principal character seen in the soybean selection process. Characters related to production are of great importance in the selection of superior materials. Vianaet al. (2013)
found gains for GY using the SRI index, and Dallastraet al. (2014) used exploratory multivariate analysis in the
selection of superior progeny for grain yield.
Overall, the BI displayed the greatest gains for GY (34.56% to 34.58%), with values close or equal to those found with direct selection, but produced small gains for the other characters in addition to displaying negative results for NP and NDM.
Index EW Situation GS%
NDM IHP PHM Lg AV NP OC GY Total
CI 1
I(1) -0.28 -0.58 1.86 0.26 -0.25 -1.71 0.70 34.07 34.07
II(2) -0.18 -0.67 1.84 0.51 -0.21 -2.60 0.80 34.08 33.57
III(3) -0.40 3.70 0.48 1.69 -0.17 -5.95 0.60 33.51 33.46
CI CVg
I -0.28 -0.58 1.86 0.26 -0.25 -1.71 0.70 34.07 34.07
II -0.17 -0.65 1.94 0.51 -0.26 -3.15 0.79 34.01 33.02
III -0.40 3.86 0.20 2.08 -0.04 -5.84 0.56 33.58 34.00
CI CVg/CVe
I -0.28 -0.58 1.86 0.26 -0.25 -1.71 0.70 34.07 34.07
II -0.17 -0.65 1.94 0.51 -0.26 -3.15 0.79 34.01 33.02
III -0.40 3.86 0.20 2.08 -0.04 -5.84 0.56 33.58 34.00
SRI 1
I -0.15 -1.74 -1.53 2.92 3.29 3.25 0.03 26.11 32.18
II -0.50 -3.57 -0.91 0.96 3.03 11.12 1.30 20.12 31.55
III 0.44 8.74 0.03 3.28 2.55 -0.07 2.32 18.75 36.04
SRI CVg
I 0.39 0.72 0.68 2.15 1.29 -1.04 0.53 34.45 39.17
II -0.90 -5.32 1.34 -0.76 1.79 12.48 0.06 28.39 37.08
III -0.60 7.78 1.08 1.65 1.61 8.07 0.22 25.65 45.46
SRI CVg/CVe
I -0.21 -1.80 -1.45 2.65 3.33 4.29 -0.07 25.83 32.57
II -0.05 1.22 -1.36 1.89 2.53 4.69 2.90 17.66 29.48
III 0.96 9.12 -0.61 2.95 2.20 -4.89 2.74 14.12 26.59
BI 1
I -0.25 0.06 0.62 1.48 0.90 -2.31 0.62 34.58 35.70
II -0.30 0.09 1.21 1.16 0.88 -1.28 0.46 34.56 36.78
III -0.30 0.09 1.21 1.16 0.88 -1.28 0.46 34.56 36.78
BI CVg
I -0.25 0.06 0.62 1.48 0.90 -2.31 0.62 34.58 35.70
II -0.30 0.09 1.21 1.16 0.88 -1.28 0.46 34.56 36.78
III -0.30 0.09 1.21 1.16 0.88 -1.28 0.46 34.56 36.78
BI CVg/CVe
I -0.25 0.06 0.62 1.48 0.90 -2.31 0.62 34.58 35.70
II -0.22 -0.16 1.01 1.36 0.84 -1.69 0.60 34.57 36.31
III -0.22 0.23 1.07 1.43 0.92 -1.70 0.52 34.57 36.82
DGI DP
I -0.30 -1.21 -0.99 2.57 2.92 2.69 -0.17 29.90 35.41
II -0.99 -3.97 -0.48 -0.70 2.50 18.39 1.01 17.49 33.25
III 0.26 0.99 2.98 -5.68 0.23 -8.14 0.88 5.92 -2.56
DGI CVg
I -0.32 -4.33 -1.18 2.40 3.94 9.62 -0.57 6.57 16.13
II 0 4.15 -1.91 2.57 3.49 0.28 1.74 1.84 12.16
III -0.25 -1.09 -0.34 -3.91 0.81 -9.63 0.44 0.50 -13.47
GID 1 I -0.22 -0.04 -1.55 3.17 2.95 0.30 -0.04 27.71 32.28
II -0.93 -4.18 -0.63 -0.45 2.75 17.22 0.98 16.68 31.44
III -0.71 -4.39 -0.79 1.20 2.44 13.20 0.93 17.97 29.85
Table 3 - Estimates of selection gains (GS%) found for eight characters, with the classic index (CI) proposed by Smith (1936) and Hazel (1943), the sum of ranks index (SRI) of Mulamba & Mock (1978), the Williams base index (1962) (BI), the desired gains index (DGI) of Pesek & Baker (1969) and the genotype-ideotype distance index (GID), with economic weights (EW) and different situations, in 386 segregating populations of soybean during the 2012/2013 agricultural year, Jaboticabal, SP
CONCLUSIONS
1. It was possible to see variations between the indices under study for the different economic weights and situations being evaluated;
2. In most situations, the base index provided the greatest gains for the economic weights studied;
3. The index based on the sum of ranks, using the characters agronomic value and grain yield as the main estimators, returned an economic weight of 1 (one), as well as the most favourable gains found in this work.
REFERÊNCIAS
BÁRBARO, I. M. et al. Comparação de estratégias de seleção no melhoramento de populações F5 de soja.Revista Ceres, v. 54, n. 313, p. 250-261, 2007.
BIZARI, E. H. et al. Genetic diversity in early-maturing soybean genotypes based on biometric and molecular parameters. Journal of Food, Agriculture & Environment, v. 12, p. 259-265, 2014.
CONSELHO NACIONAL DE ABASTECIMENTO.
Acompanhamento da safra brasileira de grãos 2014/2015: décimo segundo levantamento. 2015. Disponível em: <http:// www.conab.gov.br/OlalaCMS/uploads/arquivos/15_09_11_10_ 42_03_boletim_graos_setembro_2015.pdf >. Acesso em: 13 out. 2015.
COSTA, M. M. et al. Ganho genético por diferentes critérios
de seleção em populações segregantes de soja. Pesquisa Agropecuária Brasileira, v. 39, n. 11, p. 1095-1102, 2004. CRUZ, C. D. Aplicação de algumas técnicas multivariadas no melhoramento de plantas. 1990. 188 f. Tese (Doutorado em Agronomia) - Escola Superior de Agricultura Luiz de Queiroz, Piracicaba, 1990.
CRUZ, C. D. Genes: aplicativo computacional em genética e estatística. Viçosa: UFV, 2007.
CRUZ, C. D. Programa GENES: biometria. 1. ed. Viçosa: UFV, 2006. 382 p.
CRUZ, C. D.; REGAZZI, A. J; CARNEIRO, P. C. S.Modelos biométricos aplicados ao melhoramento genético. 4. ed. Viçosa: UFV, 2012. 514 p.
DALLASTRA, A.et al. Multivariate approach in the selection
of superior soybean progeny which carry the RR gene.Revista Ciência Agronômica, v. 45, n. 3, p. 588-597, 2014.
EMPRESA BRASILEIRA DE PESQUISA AGROPECUÁRIA.
Tecnologias de produção de Soja Região Central do Brasil 2011. Londrina: Embrapa Soja, 2010. 253 p.
FEDERER, W. T.Experimental design: theory and application. New York: MacMillan, 1955. 544 p.
FREITAS JÚNIOR, S. P.et al. Predição de ganhos genéticos na população de milho pipoca UNB-2U sob seleção recorrente utilizando-se diferentes índices de seleção. Semina: Ciências Agrárias, v. 30, n. 4, p. 803-814, 2009.
HAZEL, L. N. The genetic basis for constructing selection indexes.Genetics, v. 28, p. 476-490, 1943.
MAGALHÃES, C. H. C. B.et al. Análise multivariada e índice
de seleção na identificação de genótipos superiores de feijão-caupi. Acta Scientiarum. Agronomy, v. 32, n. 4, p. 613-619, 2010.
MARQUES, M. C.; ROCHA, J. E. S.; HAMAWAKI, O. T. Avaliação do teor de óleo de cultivares de soja da UFU visando a produção de biodiesel.Horizonte Científico, v. 2, n. 1, p. 207-219, 2008. MARTINS, I. S.; MARTINS, R. C. C.; PINHO, D. S. Alternativas de índices de seleção em uma população deEucalyptus grandis
Hill ex Maiden.Cerne, v. 12, p. 287-291, 2006.
MULAMBA, N. N.; MOCK, J. J. Improvement of yield potential of the Eto Blanco maize (Zea maysL.) population
by breeding for plant traits.Egyptian Journal of Genetics and Citology, v. 7, p. 40-51, 1978.
PAULA, R. C. et al. Predição de ganhos genéticos em
melhoramento florestal.Pesquisa Agropecuária Brasileira, v. 37, n. 2, p. 159-165, 2002.
PESEK, J.; BAKER, R. J. Desired improvement in relation to selected indices.Canadian Journal of Plant Science, v. 49, p. 803-804, 1969.
RANGEL, R. M.et al. Análise biométrica de ganhos por seleção
em população de milho pipoca de quinto ciclo de seleção recorrente. Revista Ciência Agronômica, v. 42, n. 2, p. 473-481, 2011.
ROSADO, L. D. S.et al. Simultaneous selection in progenies of yellow passion fruit using selection indices. Revista Ceres, v. 59, p. 95-101, 2012.
SILVA, M. G. M.; VIANA, A. P. Alternativas de seleção em população de maracujazeiro-azedo sob seleção recorrente intrapopulacional.Revista Brasileira de Fruticultura, v. 34, n. 2, p. 525-531, 2012.
SMITH, H. F. A discriminant function for plant selection.Annual Eugenics, v. 7, p. 240-250, 1936.
TEIXEIRA, D. H. L. et al. Índices de seleção no aprimoramento
simultâneo dos componentes da produção de frutos em açaizeiro.
Pesquisa Agropecuária Brasileira, v. 47, n. 2, p. 237-243, 2012.
VASCONCELOS, E. S.et al. Estimativas de ganho genético por
diferentes critérios de seleção em genótipos de alfafa.Revista Ceres, v. 57, n. 2, p. 205-210, 2010.
VIANNA, V. F.et al. The multivariate approach and influence of characters in selecting superior soybean genotypes.African Journal of Agricultural Research, v. 8, p. 4162-4169, 2013. WILLIANS, J. S. The evaluation of a selection index.