Received 24 Mar., 2014 Accepted 19 May, 2014 (006327)
1 Escola Superior de Agricultura “Luiz de Queiroz” – ESALQ, Universidade de São Paulo – USP, Piracicaba, SP, Brasil, e-mail: alangosartori@gmail.com *Corresponding author
Main food sources of carotenoids, according to the purpose and degree of
processing, for beneficiaries of the ‘Bolsa Família’ in Brazil
Alan Giovanini de Oliveira SARTORI1*, Marina Vieira da SILVA1
1 Introduction
Carotenoids are pigments synthesized by plants and also found in seafood and some living organisms, such as salmon, birds, and mammals, which obtain them in their diets (Mlcek & Rop, 2011). High concentrations are found in fruits and vegetables widely produced and marketed in Brazil, as well as in their derived processed products (Rodriguez-Amaya, 2010).
The β-carotene, β-cryptoxanthin, and α-carotene have recognized pro-vitamin A activity (National Academy of Sciences, 2000). It is well known that the deficiency of vitamin A persists in Brazil, and it is probably the major cause of blindness in children in developing countries. However, carotenoids also have antioxidant properties. Carotenoids act primarily as scavengers of singlet oxygen. This process can occur physically, through the capture of excitation energy of this reactive oxygen species and subsequent dissipation of energy excess as heat; or chemically, through a reaction between carotenoid and singlet oxygen, which is inactivated in an irreversible way (Palozza & Krinsky, 1992; Niki, 2010).
The most widely studied carotenoids related to health effects are β-carotene, lycopene, lutein, zeaxanthin, β-cryptoxanthin, and α-carotene. β-carotene is associated with reduction of cardiovascular disease risk (Osganian et al., 2003; Gale et al., 2001), while α-carotene is recognized as an anticarcinogenic agent (Nishino et al., 2000, 2002). Lycopene is the carotenoid with greater biological efficiency to scavenge singlet oxygen (Di Mascio et al., 1989) and may have protective effect against some types of cancer (Stahl & Sies, 1996; Stacewicz-Sapuntzakis & Bowen, 2005; Giovannucci, 2011). Lutein and zeaxanthin are the yellow macular pigments and act as antioxidants (Brasil, 2008) and blue light filters of high energy
(Krinsky et al., 2003). β-cryptoxanthin has been associated with antimutagenic activities in in vitro studies (Lorenzo et al., 2009), with immunomodulary activities in in vitro and in vivo studies (Nishi et al., 2012), and with effects on osteosynthesis in in vitro and in vivo studies (Yamaguchi, 2012).
Health effects associated with the possible biological activities of carotenoids, however, are not fully recognized, since it is not possible to determine if the effects are caused by these phytochemicals or by other substances present in plants. Therefore, the North-American National Academy of Sciences (NAS) recommends obtaining carotenoids through a diet rich in various types of fruits, vegetables, and leafy vegetables (National Academy of Sciences, 2000).
The main causes of the destruction of β-carotene, β-cryptoxanthin and α-carotene during the processing and food storage, and, consequently loss of the pro-vitamin activity, are enzymatic and non-enzymatic oxidations. Carotenoid destruction is intensified with longer cooking periods and/or higher temperature (Rodriguez-Amaya, 1999). However, there is evidence that the use of heat treatments in foods can increase the bioavailability of carotenoids (Hwang et al., 2012), and that products of the oxidative cleavage have higher antioxidant capacity (Gurak et al., 2014).
The objective of this study was to estimate daily intake of carotenoids (expressed as average values) according to age group and to identify the main dietary sources according to the purpose and the degree of processing and the inclusion of food additives on formulations. The population beneficiary of the ‘Bolsa Família’ (BFP), which corresponds to 26% of the Brazilian Abstract
The intake of carotenoids is associated with antioxidant properties and some of these substances have activity of pro-vitamin A. This study aimed to estimate the intake of carotenoids (average values) by the Brazilian population focusing on beneficiaries of the ‘Bolsa Família’ Program and identify the dietary sources, according to the purpose and degree of processing and the inclusion of food additives. The database used is the personal food consumption module of the Household Budget Survey of 2008-2009, conducted by the Brazilian Institute of Geography and Statistics. The content of carotenoids in foods was obtained primarily from a National data source. Food products were classified into three categories: 1) fresh and minimally processed foods; 2) processed foods (containing food additives, except for flavoring and coloring agents); and 3) highly processed foods (containing flavoring and coloring agents). Insufficient intakes were identified for the conditional cash transfer program beneficiaries (3,547.1 µg). Fresh and minimally processed foods supplied between 48.6% (for girls) and 65.7% (for male adults) of pro-vitamin carotenoids. Processed foods were sources of between 55.5% and 57.0% of lutein + zeaxanthin for elderly and between 58.0% and 67.8% of lycopene for adults. Highly processed foods contributed to less than 5.0% of total carotenoids.
Keywords: carotenoids; food intake; age; food processing; conditional cash transfer program.
OI:
Table of Carotenoids Composition in Foods (Rodriguez-Amaya et al., 2008) and also from the North-American National Nutrient Database for Standard Reference - Release 25 (United States Department of Agriculture, 2012).
Additional criteria were adopted as follows:
• Composition of the cooked food, when available, was adopted for grilled, roasted, stewed, fried, sautéed, broiled, breaded foods, and those prepared with white sauce, garlic and oil, such as barbecue, cornmeal, or soup;
• Composition of the raw food was adopted for foods prepared such as vinaigrette. When only the composition for the cooked food is known, this composition was used; • Composition of carotenoids in food items identified
as prepared with red sauce: 80% of value regarding the composition of the raw or cooked food item and 20% of value regarding the carotenoid composition in tomato sauce. The same criterion was adopted for “macaroni”, “canned meatball in sauce”, and “light ready-to-eat lasagna”;
• Light, diet or organic foods: the same composition used in food items produced conventionally;
• Meals: estimated values based on the ingredients that contained carotenoids. For example: Greek-style rice (5% of tomato composition and 5% of green bell pepper composition) and pizza (10% of tomato composition, 5% of tomato sauce and 1% of oregano). The recipes were obtained from a table disclosed by IBGE (Instituto Brasileiro de Geografia e Estatística, 2011) and in the literature (Fisberg et al., 2002).
Since there are no nutritional recommendations for carotenoids intake, the prudent individual daily intakes suggested by the NAS for total carotenoids (between 9-18 mg), pro-vitamin carotenoids (between 5.2-6 mg) and β-carotene (between 3-6 mg) were adopted for the analysis (National Academy of Sciences, 2000).
2.3 Food classification
To evaluate the sources of carotenoids in the diet, a food classification system was developed according to the purpose and the degree of processing. This system is similar to the one proposed by Monteiro et al. (2010), but it uses the presence of food additives as an additional criterion. These substances may be considered indicators of the technology used in the food manufacturing process.
• Category 1: fresh foods or subjected to minimal processing in order to ease the conservation and consumption or prevent foodborne diseases. Food additives are unusual in these foods. The category comprises fruits, vegetables, cereals, rice, vegetables, bulbs, roots, rhizomes, tubers, stalks, beans, other legumes, mushrooms, nuts, herbs, honey, meat, fish, eggs, herbal teas, infusions, coffee, and milk.
• Category 2: processed foods derived from food raw material and/or fresh food obtained by technological population (Camargo et al., 2013), was prioritized in the analysis
because they are more exposed to food and nutritional insecurity and inadequate health services.
2 Method
2.1 Database
The data on individual dietary intake were obtained from the food consumption module of the Household Budget Survey (HBS) from 2008-2009, conducted by the Brazilian Institute of Geography and Statistics (IBGE).
A conglomerate sampling of two-stage cluster stratification (geographical and socioeconomic) of the census sectors from the Demographic Census of 2000 was used.
Census sectors were selected by probability proportional to the number of households that they contain. The households were defined randomly without replacement in each sector. In order to capture seasonal variations of food consumption, the strata were distributed along the 52 weeks of the year (Instituto Brasileiro de Geografia e Estatística, 2011). The data were collected in 13,569 households of all Brazilian states, and the number of subjects with 10 years of age or older was 34,003, which corresponded to a population of 160,511,094 people, given the expansion factors of the sample (Instituto Brasileiro de Geografia e Estatística, 2011).
Trained IBGE interviewers applied a pre-structured questionnaire with 1,500 foods and beverages, 106 measurement units, and 15 preparation methods (raw, grilled/broiled/ barbecued, fried, braised, in white or red sauce, with butter/ oil, stewed, in soup, baked, roasted, breaded/fried, with garlic and oil, vinaigrette and curd) (Instituto Brasileiro de Geografia e Estatística, 2011).
The individuals completed two non-consecutive food diaries on pre-determined days spanning one week, which considered food and beverage ingested inside or outside home. However, only data from the first day, which tend to be more reliable, were analyzed (Instituto Brasileiro de Geografia e Estatística, 2011). A detailed description of the HBS method including the validation of the food diary model used can be found in the following publications: Sichieri et al. (2008) and IBGE (Instituto Brasileiro de Geografia e Estatística, 2011).
The subjects were classified into three groups: 1) children and adolescents (10-18 years of age); 2) adults (with 19-59 years of age); and 3) elderly (60 years of age or older).
2.2 Carotenoids intake
A database, created with Microsoft Excel® (version 2007), was constructed to estimate the intake of carotenoids by Brazilian population.
amount of soybean oil added (Category 2 ingredient) was considered low (less than 1% of the product final composition);
• Category 1 food items subjected to methods of preparation to which IBGE have estimated the inclusion of Category 2 foods (soybean oil, butter and flour) that are higher than 1% in the product final composition were transferred to Category 2, namely stews and sautéed and fried food items served with red and white sauce, garlic and oil, butter, oil, battered, or breaded;
• Meals were classified according to their recipes, which were obtained from the food composition database published by IBGE (Instituto Brasileiro de Geografia e Estatística, 2011) or from a specific National Data source (Fisberg et al., 2002).
2.4 Statistical analysis
For the statistical analyses, the Statistical Analysis System - SAS®, version 9.3 was used. Weighted averages and standard deviations were calculated for the group of beneficiaries (22.4% of observations) and the groups of non-beneficiaries of the ‘Bolsa Família’ Program.
3 Results and discussion
The content (average values) of carotenoids (4,315.6; sd = 73.6 µg) in the diet of the Brazilian population is not within the recommended intake levels. It is important to reinforce that the reference values adopted are not classified as nutritional recommendations. If they were, it would be indicated to evaluate the prevalence of inadequate intake considering that the larger the proportion (%) identified, the higher the population deprivation. The results (Table 1) show that the beneficiaries of the ‘Bolsa Família’ Program consume systematically lower amounts of carotenoids than those of non-beneficiaries.
The consumption of total carotenoids is consistent with analyses that integrate National studies. Amancio & Silva (2012), also based on data from the HBS food consumption module (HBS, 2008-2009), estimated the daily intake per capita of 4,117.0 µg. However, it is not clear if these authors prioritized the Brazilian database for carotenoid composition in foods (Rodriguez-Amaya et al., 2008).
Gaino & Silva (2012) used household acquisition data from HBS of 2008-2009 and estimated that the diet provided an processes, which may contain the majority of food
additives, except for coloring and flavoring agents. This category comprises pasta, flour, cereal, vegetable oils, canned and processed foods of plant origin, fats of animal origin (butter, milk cream, and cream), sweets, sugars and sweeteners, processed meats (e.g., blanquet turkey breast), baked products, juices and vitamins, dairy products, meals, and processed fish.
• Category 3: highly processed foods obtained by extensive processes that, in general, mischaracterize the properties of their ingredients. In addition to having coloring and flavoring agents in their formulation, these foods may also even contain other food additives. These functional classes – colors and flavors – act exclusively on the sensory characteristics (World Health Organization, Food and Agriculture Organization of the United Nations, 2013) and may emphasize flavors, odors, and aromas naturally found or confer new ones, which may have not been related to the chemical composition or the ingredient listed. Due to these characteristics, the presence of flavoring and coloring agents in their formulation, these foods were characterized as highly processed. This category includes “fantasy or artificial foods”, that is, foods processed to imitate natural foods although they predominantly contain substances that are not found in the food they imitate (Brasil, 1969). This category comprises cookies, crackers, carbonated beverages, processed meats (for example: burgers and nuggets), sweets, chocolates, candies, chewing gum, industrialized non-carbonated beverages or powder beverages, instant noodles with sauce, dehydrated soups, dairy products, sandwiches, pizzas, and plant-origin products containing coloring and/or flavoring agents.
The identification of the occurrence and the functional classes of food additives found in the food products investigated was possible by getting information from the nutrition facts label provided in the food package by their manufacturers. This step was conducted between December 7, 2012 and February 25, 2013 in two grocery store chains in the cities of Piracicaba and São Paulo, both in São Paulo State, Brazil.
Additional criteria were included in the classification system:
• Category 1 Fresh food items served with vinaigrette or broiled food items were kept in this category because the
Table 1. Intake of carotenoids according to the participation in the ‘Bolsa Família’ Program. Brazil, 2008-2009.
Carotenoids (µg) Brazil Beneficiary of BFP Non-beneficiary of BFP Prudent individual daily intakes (PIDI)
Total carotenoids 4,315.6 (73.6) 3,547.1 (169.3) 4,426.6 (81.3) 9,000-18,000
Pro-vitamin A 1,727.9 (40.7) 1,482.8 (119.6) 1,760.4 (42.4) 5,200-6,000
β-carotene 1,466.6 (38.0) 1,286.8 (117.7) 1,487.7 (38.8) 5,200-6,000
Licopen 1,439.8 (42.0) 1,204.1 (86.8) 1,470.4 (47.1) NA
Lutein + zeaxanthin 1,147.8 (23.7) 860.2 (46.9) 1,195.8 (26.9) NA
β-cryptoxanthin 105.1 (4.6) 61.9 (5.3) 113.5 (5.4) NA
α-carotene 156.1 (4.9) 134.0 (9.6) 159.2 (5.6) NA
daily carotenoid intake of 4.178 µg (Khan et al., 2008). The intake of carotenoids was directly correlated with the family income.
Studies carried out with groups of adults of the United States and Europe, based on food consumption data and the use of national database of carotenoid composition in food, reported contents ranging between 9.500-16.100 µg, considering the same group of substances included in the present research (O’Neill et al., 2000; Murphy et al., 2012).
Analyzing the relative participation of each carotenoid in the diet in different countries, based on O’Neill et al. (2000) and Murphy et al. (2012) data, it is possible to observe that the Brazilians ingest, in general, similar amounts to those identified for the French, British, Irish, and Dutch populations. On the other hand, the U.S. lycopene intake is significant, 57.2% of the total, but only 27.3% of carotenoids are pro-vitamin A. In Brazil, lycopene corresponds to 33.4%, and the pro-vitamin A carotenoids account for 40% of the total intake.
average of 4,873.2 µg of carotenoids per day. The authors also analyzed the household changes in the availability of carotenoids from 2002-2003 to 2008-2009 and reported an increase of 51.8 % between these time periods. Data from 2002-2003 were obtained from Morato & Silva (2008).
It is important to mention that Morato & Silva (2008) used data on carotenoid composition in foods from the USA, and Amancio & Silva (2012) and Gaino & Silva (2012) adopted databases from the USA and Brazil, but they did not specify which one was prioritized. It is well known that factors such as soil, climate, and agriculture practices can affect the content of bioactive compounds in foods and, consequently, the use of international data may be a bias in food consumption analyses.
The reduced intake of carotenoids was also identified in a research conducted in Vietnam with 1,001 households located in the Red River delta (771 in rural areas). The use of a 24-hour recordatory method and national composition database of bioactive compounds in foods allowed obtaining an average
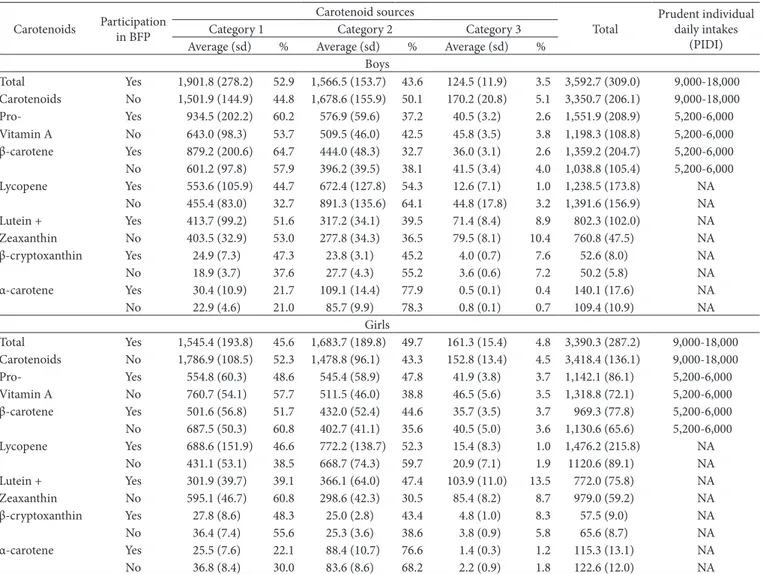
Table 2. Intake of carotenoids by children and adolescents according to sex and to the participation in the ‘Bolsa Família’ Program and sex. Brazil, 2008-2009.
Carotenoids Participation in BFP
Carotenoid sources
Total
Prudent individual daily intakes
(PIDI)
Category 1 Category 2 Category 3
Average (sd) % Average (sd) % Average (sd) % Boys
Total Yes 1,901.8 (278.2) 52.9 1,566.5 (153.7) 43.6 124.5 (11.9) 3.5 3,592.7 (309.0) 9,000-18,000 Carotenoids No 1,501.9 (144.9) 44.8 1,678.6 (155.9) 50.1 170.2 (20.8) 5.1 3,350.7 (206.1) 9,000-18,000 Pro- Yes 934.5 (202.2) 60.2 576.9 (59.6) 37.2 40.5 (3.2) 2.6 1,551.9 (208.9) 5,200-6,000 Vitamin A No 643.0 (98.3) 53.7 509.5 (46.0) 42.5 45.8 (3.5) 3.8 1,198.3 (108.8) 5,200-6,000 β-carotene Yes 879.2 (200.6) 64.7 444.0 (48.3) 32.7 36.0 (3.1) 2.6 1,359.2 (204.7) 5,200-6,000 No 601.2 (97.8) 57.9 396.2 (39.5) 38.1 41.5 (3.4) 4.0 1,038.8 (105.4) 5,200-6,000 Lycopene Yes 553.6 (105.9) 44.7 672.4 (127.8) 54.3 12.6 (7.1) 1.0 1,238.5 (173.8) NA
No 455.4 (83.0) 32.7 891.3 (135.6) 64.1 44.8 (17.8) 3.2 1,391.6 (156.9) NA Lutein + Yes 413.7 (99.2) 51.6 317.2 (34.1) 39.5 71.4 (8.4) 8.9 802.3 (102.0) NA Zeaxanthin No 403.5 (32.9) 53.0 277.8 (34.3) 36.5 79.5 (8.1) 10.4 760.8 (47.5) NA β-cryptoxanthin Yes 24.9 (7.3) 47.3 23.8 (3.1) 45.2 4.0 (0.7) 7.6 52.6 (8.0) NA
No 18.9 (3.7) 37.6 27.7 (4.3) 55.2 3.6 (0.6) 7.2 50.2 (5.8) NA
α-carotene Yes 30.4 (10.9) 21.7 109.1 (14.4) 77.9 0.5 (0.1) 0.4 140.1 (17.6) NA No 22.9 (4.6) 21.0 85.7 (9.9) 78.3 0.8 (0.1) 0.7 109.4 (10.9) NA
Girls
Total Yes 1,545.4 (193.8) 45.6 1,683.7 (189.8) 49.7 161.3 (15.4) 4.8 3,390.3 (287.2) 9,000-18,000 Carotenoids No 1,786.9 (108.5) 52.3 1,478.8 (96.1) 43.3 152.8 (13.4) 4.5 3,418.4 (136.1) 9,000-18,000 Pro- Yes 554.8 (60.3) 48.6 545.4 (58.9) 47.8 41.9 (3.8) 3.7 1,142.1 (86.1) 5,200-6,000 Vitamin A No 760.7 (54.1) 57.7 511.5 (46.0) 38.8 46.5 (5.6) 3.5 1,318.8 (72.1) 5,200-6,000 β-carotene Yes 501.6 (56.8) 51.7 432.0 (52.4) 44.6 35.7 (3.5) 3.7 969.3 (77.8) 5,200-6,000 No 687.5 (50.3) 60.8 402.7 (41.1) 35.6 40.5 (5.0) 3.6 1,130.6 (65.6) 5,200-6,000 Lycopene Yes 688.6 (151.9) 46.6 772.2 (138.7) 52.3 15.4 (8.3) 1.0 1,476.2 (215.8) NA
No 431.1 (53.1) 38.5 668.7 (74.3) 59.7 20.9 (7.1) 1.9 1120.6 (89.1) NA Lutein + Yes 301.9 (39.7) 39.1 366.1 (64.0) 47.4 103.9 (11.0) 13.5 772.0 (75.8) NA Zeaxanthin No 595.1 (46.7) 60.8 298.6 (42.3) 30.5 85.4 (8.2) 8.7 979.0 (59.2) NA β-cryptoxanthin Yes 27.8 (8.6) 48.3 25.0 (2.8) 43.4 4.8 (1.0) 8.3 57.5 (9.0) NA
No 36.4 (7.4) 55.6 25.3 (3.6) 38.6 3.8 (0.9) 5.8 65.6 (8.7) NA
α-carotene Yes 25.5 (7.6) 22.1 88.4 (10.7) 76.6 1.4 (0.3) 1.2 115.3 (13.1) NA No 36.8 (8.4) 30.0 83.6 (8.6) 68.2 2.2 (0.9) 1.8 122.6 (12.0) NA
α-carotene and lycopene from Category 2 foods. The girls participating in the Program, however, ingested similar amounts of carotenoids from foods classified in Categories 1 and 2, with the exception of α-carotene, which was mainly supplied (76.6%) by foods of Category 2.
Considering the broad data collection available, the authors of this article prioritized descriptive statistical analysis. Thus, comparisons between the values observed among beneficiaries and non-beneficiaries or those related to the contribution of the food categories in the total intake of carotenoids are only highlighted when the difference is noticeable. It is important to mention that the analysis of the effect of the Program on food consumption was not an aim.
The intake of carotenoids by adults in Brazil (Table 3) is lower than that observed for populations within this age group and residents in developed countries. O’Neill et al. (2000) investigated the consumption of these bioactive compounds by adults between 25-45 years of age from municipalities of five European countries. The average intake obtained was 9,540 µg As for children and adolescents, the data in Table 2 show
that beneficiary boys in the BFP ingested larger amounts (except for lycopene) of these bioactive compounds than those of the beneficiary girls, who, on the other hand, ingested larger amounts of lycopene and smaller amounts of the other carotenoids.
The consumption of carotenoids by BFP beneficiary children and adolescents (3,592.7; sd = 309 µg and 3,390.3; sd = 287.2 µg, for boys and girls, respectively) was lower than the amounts estimated by Slater et al. (2010) in a sample of 80 students (72% girls) with 13 years of age (sd = 1) from a municipal school of Piracicaba city (São Paulo state, Brazil). The authors adopted a food frequency questionnaire and a North-American software (Nutrition Data System; School of Public Health, University of Minnesota, Minnesota, USA), and obtained a daily average intake of 4,150.6 µg of carotenoids (β-carotene, α-carotene, β-cryptoxanthin, lycopene, and lutein).
BFP beneficiary boys ingested more β-carotene and lutein + zeaxanthin from foods classified in Category 1 and
Table 3. Intake of carotenoids by adults according to sex and to the participation in the ‘Bolsa Família’ Program and sex. Brazil, 2008-2009.
Carotenoids Participation in BFP
Carotenoid sources
Total
Prudent individual daily intakes
(PIDI)
Category 1 Category 2 Category 3
Average (sd) % Average (sd) % Average (sd) % Men
Total Yes 1,865.5 (223.0) 51.0 1,679.7 (131.0) 45.9 111.3 (13.2) 3.0 3,656.5 (257.6) 9,000-18,000 Carotenoids No 2,624.3 (84.0) 58.9 1,698.3 (67.3) 38.1 135.1 (10.3) 3.0 4,457.8 (112.1) 9,000-18,000 Pro- Yes 1,084.0 (205.2) 65.7 531.3 (48.0) 32.2 33.3 (2.7) 2.0 1,648.6 (210.0) 5,200-6,000 Vitamin A No 1,121.1 (44.1) 66.0 533.6 (24.5) 31.4 43.6 (2.7) 2.6 1,698.4 (51.4) 5,200-6,000 β-carotene Yes 1,022.2 (204.2) 69.7 417.0 (42.6) 28.4 28.0 (2.3) 1.9 1,467.2 (208.0) 5,200-6,000 No 1,007.7 (40.5) 68.7 421.8 (21.6) 28.7 38.3 (2.1) 2.6 1,467.7 (46.6) 5,200-6,000 Lycopene Yes 343.4 (52.8) 30.8 756.9 (82.3) 67.8 15.8 (8.0) 1.4 1,116.1 (98.2) NA
No 639.2 (38.3) 41.0 882.5 (56.8) 56.6 36.1 (8.9) 2.3 1.557.8 (70.3) NA Lutein + Yes 438.1 (45.8) 49.1 391.4 (52.9) 43.9 62.2 (8.5) 7.0 891.7 (69.6) NA Zeaxanthin No 864.0 (31.5) 71.9 282.3 (13.6) 23.5 55.4 (3.6) 4.6 1201.6 (34.4) NA β-cryptoxanthin Yes 20.9 (4.8) 38.0 29.0 (3.7) 52.8 5.0 (0.9) 9.2 54.8 (6.0) NA
No 56.2 (6.2) 63.7 28.5 (2.5) 32.4 3.4 (0.3) 3.9 88.1 (6.8) NA
α-carotene Yes 40.9 (10.7) 32.3 85.4 (9.5) 67.4 0.4 (0.1) 0.3 126.6 (10.7) NA
No 57.3 (5.5) 40.2 83.3 (4.6) 58.5 1.9 (0.8) 1.3 142.5 (7.1) NA
Women
Total Yes 1,887.9 (124.1) 54.8 1,458.5 (98.9) 42.4 96.4 (9.0) 2.8 3,442.8 (158.3) 9,000-18,000 Carotenoids No 2,993.3 (92.8) 63.0 1,642.3 (62.2) 34.5 118.9 (7.8) 2.5 4,754.5 (109.0) 9,000-18,000 Pro- Yes 910.1 (85.5) 63.6 490.9 (33.3) 34.3 30.0 (2.1) 2.1 1,431.0 (91.0) 5,200-6,000 Vitamin A No 1,276.9 (55.2) 66.0 607.9 (24.1) 31.4 50.2 (6.0) 2.6 1,934.9 (60.6) 5,200-6,000 β-carotene Yes 824.0 (83.1) 66.9 382.2 (27.3) 31.0 26.1 (1.8) 2.1 1,232.2 (86.9) 5,200-6,000 No 1,131.2 (53.0) 69.0 467.2 (19.6) 28.5 41.8 (4.1) 2.5 1,640.2 (56.6) 5,200-6,000 Lycopene Yes 473.1 (49.7) 41.1 668.0 (81.2) 58.0 11.0 (5.3) 1.0 1,152.1 (95.9) NA
No 723.8 (37.4) 47.2 790.7 (51.4) 51.6 17.8 (3.2) 1.2 1,532.3 (62.9) NA Lutein + Yes 504.7 (42.4) 58.7 299.7 (25.4) 34.9 55.3 (6.1) 6.4 859.7 (49.1) NA Zeaxanthin No 992.6 (34.2) 77.1 243.7 (11.5) 18.9 50.9 (2.6) 4.0 1,287.3 (35.6) NA β-cryptoxanthin Yes 35.6 (7.6) 57.1 23.9 (3.0) 38.4 2.8 (0.5) 4.5 62.3 (8.1) NA
No 96.3 (7.9) 76.0 27.9 (2.3) 22.0 2.6 (0.3) 2.0 126.7 (8.5) NA
α-carotene Yes 50.6 (9.2) 37.1 84.7 (7.9) 62.1 1.1 (0.3) 0.8 136.5 (11.8) NA
No 49.5 (5.2) 29.4 112.8 (5.8) 67.1 5.8 (1.8) 3.4 168.0 (7.9) NA
The data in Table 4 show that the elderly beneficiaries of the BFP ingested smaller amounts of carotenoids, compared to those of the non-beneficiaries of the Program. The content of pro-vitamin A carotenoids, however, was similar for both beneficiary and non-beneficiary women (2,260.9; sd = 501.6 µg for beneficiaries and 2,259.9; sd = 106.5 µg non- beneficiaries).
Category 1 foods were also the main sources of pro-vitamin A carotenoids for the elderly beneficiaries of the BFP. Minimally processed and fresh foods were the main sources of α-carotene for women in this group. Lutein + zeaxanthin were obtained mainly from Category 2 foods for men and women, as well as lycopene for men and β-cryptoxanthin and α-carotene for women beneficiaries of the BFP.
The elderly non-beneficiary of the BFP obtained carotenoids predominately from Category 1 foods, except for α-carotene which was obtained by men from Category 2 foods.
in Spain; 13,710 µg in the Netherlands; 14,380 µg in the United Kingdom and Northern Ireland; 14,530 µg, in the Republic of Ireland; and 16,100 µg in France.
In the United States of America, based on data of adults registered in the National Health and Nutrition Examination Survey (NHANES) from 2003 to 2006 obtained by using two food records, Murphy et al. (2012) estimated an average daily intake per capita of 9,645 µg of carotenoids.
Comparing the carotenoid intake, according to the participation in the BFP, beneficiary adults ingested significantly lower amounts than those of the non-beneficiaries.
Minimally processed and fresh foods were the main sources of carotenoids with pro-vitamin A activity (including β-carotene), for men and women beneficiaries of the BFP, and lutein + zeaxanthin and β-cryptoxanthin, for women. Category 2 foods, on the other hand, were the main suppliers of α-carotene and lycopene, for both men and women, and β-cryptoxanthin, for men.
Table 4. Intake of carotenoids by the elderly according to sex and to the participation in the ‘Bolsa Família’ Program and sex. Brazil, 2008-2009.
Carotenoids Participation in BFP
Carotenoid sources
Total
Prudent individual daily intakes
(PIDI)
Category 1 Category 2 Category 3
Average (sd) % Average (sd) % Average (sd) % Men
Total Yes 1,969.7 (409.4) 51.3 1,798.8 (401.0) 46.8 72.3 (19.4) 1.9 3,840.8 (632.2) 9,000-18,000 Carotenoids No 2,960.3 (186.1) 60.5 1,827.2 (155.1) 37.3 108.7 (22.5) 2.2 4,896.3 (249.6) 9,000-18,000 Pro- Yes 1,024.9 (263.0) 65.6 505.8 (144.0) 32.4 30.8 (8.9) 2 1,561.5 (288.5) 5,200-6,000 Vitamin A No 1,261.0 (91.3) 63.3 684.1 (54.0) 34.3 47.4 (12.3) 2.4 1,992.5 (109.2) 5,200-6,000 β-carotene Yes 817.1 (216.2) 68.8 343.6 (98.6) 28.9 27.1 (8.7) 2.3 1,187.8 (230.1) 5,200-6,000 No 1,053.1 (80.4) 66.5 489.9 (37.6) 31 39.6 (8.5) 2.5 1,582.6 (90.1) 5,200-6,000
Lycopene Yes 440.1 (185.3) 43.6 568.2 (289.3) 56.4 - 1,008.3 (445.8) NA
No 838.1 (82.9) 55.6 639.9 (93.2) 42.5 29.1 (17.1) 1.9 1,507.1 (124.9) NA Lutein + Yes 504.7 (156.0) 39.7 724.8 (240.5) 57 41.5 (15.3) 3.3 1,271.0 (285.4) NA Zeaxanthin No 861.2 (67.8) 61.7 503.2 (90.9) 36 32.2 (3.4) 2.3 1,396.7 (113.0) NA β-cryptoxanthin Yes 70.6 (53.0) 51.8 62.1 (20.2) 45.6 3.5 (1.8) 2.6 136.2 (54.4) NA No 138.1 (20.2) 72.5 50.4 (12.2) 26.5 1.9 (0.4) 1 190.5 (24.7) NA α-carotene Yes 137.2 (80.1) 57.8 100.1 (43.8) 42.2 0.2 (0.1) 01 237.5 (89.5) NA No 69.8 (12.3) 31.8 143.8 (14.8) 65.5 5.9 (3.9) 2.7 219.5 (19.3) NA
Women
Total Yes 2,350.6 (556.7) 53 1,991.1 (388.3) 44.9 93.2 (32.9) 2.1 4,434.9 (676.2) 9,000-18,000 Carotenoids No 3,406.2 (195.0) 66.3 1,640.6 (110.7) 32 87.3 (11.0) 1.7 5,134.1 (223.1) 9,000-18,000 Pro- Yes 1,424.0 (455.9) 63 809.9 (187.2) 35.8 27.0 (6.8) 1.2 2,260.9 (501.6) 5,200-6,000 Vitamin A No 1,521.1 (95.5) 67.3 703.5 (56.1) 31.1 35.3 (3.8) 1.6 2,259.9 (106.5) 5,200-6,000 β-carotene Yes 1,329.1 (449.6) 69.7 556.9 (148.0) 29.2 22.3 (5.2) 1.2 1,908.2 (482.4) 5,200-6,000 No 1,260.3 (82.9) 69.7 515.7 (45.3) 28.5 31.2 (3.0) 1.7 1,807.2 (91.3) 5,200-6,000 Lycopene Yes 451.5 (146.9) 46.6 511.9 (206.7) 52.8 5.8 (5.7) 0.6 969.2 (257.3) NA
No 918.9 (94.0) 62.5 537.5 (73.4) 36.5 14.5 (8.3) 1 1,470.9 (125.5) NA Lutein + Yes 475.1 (130.0) 39.4 669.3 (209.2) 55.5 60.5 (30.5) 5 1,204.9 (232.8) NA Zeaxanthin No 966.3 (66.5) 68.9 399.6 (36.6) 28.5 37.5 (5.5) 2.7 1,403.4 (72.8) NA β-cryptoxanthin Yes 61.6 (28.3) 34.6 115.2 (56.5) 64.6 1.6 (0.9) 0.9 178.3 (62.3) NA No 168.9 (22.2) 79.6 41.6 (6.9) 19.6 1.6 (0.3) 0.8 212.1 (23.1) NA α-carotene Yes 33.3 (29.8) 19.1 137.9 (41.7) 79.1 3.1 (2.1) 1.8 174.3 (50.7) NA No 91.8 (13.1) 38.2 146.3 (13.5) 60.8 2.5 (1.0) 1 240.6 (17.9) NA
and colour associated with the formation of β-carotene epoxides and oxidative cleavage derivatives. Food Chemistry, 147, 160-169, PMid:24206700. http://dx.doi.org/10.1016/j.foodchem.2013.09.106 Hwang, E. S., Stacewicz-Sapuntzakis, M., & Bowen, P. (2012).
Effects of heat treatment on the carotenoid and tocopherol composition of tomato. Journal of Food Science, 77(10), C1109-C1114. PMid:22950575. http://dx.doi.org/10.1111/j.1750-3841.2012.02909.x
Khan, N. C., Mai, L. B., Minh, N. D., Do, T. T., Khoi, H. H., West, C. E., & Hautvast, J. G. A. J. (2008). Intakes of retinol and carotenoids and its determining factors in the Red River Delta population of northern Vietnam. European Journal of Clinical Nutrition, 62 , 810-816. PMid:17622264. http://dx.doi.org/10.1038/sj.ejcn.1602782 Krinsky, N. I., Landrum, J. T., & Bone, R. A. (2003). Biologic
mechanisms of the protective role of lutein and zeaxanthin in the eye. Annual Review of Nutrition, 23, 171-201. PMid:12626691. http://dx.doi.org/10.1146/annurev.nutr.23.011702.073307 Lorenzo, Y., Azqueta, A., Luna, L., Bonilla, F., Domínguez, G., & Collins,
A. R. (2009). The carotenoid β-cryptoxanthin stimulates the repair of DNA oxidation damage in addition to acting as an antioxidant in human cells. Carcinogenesis, 30(2), 308-314. PMid:19056931. http://dx.doi.org/10.1093/carcin/bgn270
Mlcek, J., & Rop, O. (2011). Fresh edible flowers of ornamental plants: a new source of nutraceutical foods. Trends in Food Science
& Technology, 22(10), 561-569. http://dx.doi.org/10.1016/j.
tifs.2011.04.006
Monteiro, C. A., Levy, R. B., Claro, R. M., Castro, I. R. R., & Cannon, G. (2010). A new classification of foods based on the extent and purpose of their processing. Cadernos de Saúde
Pública, 26(11), 2039-2049. PMid:21180977. http://dx.doi.
org/10.1590/S0102-311X2010001100005
Morato, P. N., & Silva, M. V. (2008). Micronutrients with antioxidant properties and compounds available for brazilian families.
Nutrire, 33(1), 43-59.
Murphy, M. M., Barraj, L. M., Herman, D., Bi, X., Cheatham, R., & Randolph, R. K. (2012). Phytonutrient intake by adults in the United States in relation to fruit and vegetable consumption. Journal of the
Academy of Nutrition and Dietetics, 112(2), 222-229. http://dx.doi.
org/10.1016/j.jada.2011.08.044
National Academy of Sciences – NAS. (2000). Dietary reference intakes
for vitamin C, vitamin E, selenium, and carotenoids. Washington:
National Academy Press.
Niki, E. (2010). Assessment of antioxidant capacity in vitro and in vivo.
Free Radical Biology & Medicine, 49(4), 503-515. PMid:20416370.
http://dx.doi.org/10.1016/j.freeradbiomed.2010.04.016
Nishi, K., Muranaka, A., Nishimoto, S., Kadota, A., & Sugahara, T. (2012). Immunostimulatory effect of b-cryptoxanthin in vitro and
in vivo. Journal of Functional Foods, 4(3), 618-625. http://dx.doi.
org/10.1016/j.jff.2012.04.001
Nishino, H., Murakoshi, M., Li, T., Takemura, M., Kuchide, M., Kanazawa, M., Yang Mou, X., Wada, S., Masuda, M., Ohsaka, Y., Yogosawa, S., Satomi, Y., & Jinno, K. (2002). Carotenoids in cancer chemoprevention. Cancer and Metastasis Reviews, 21(3), 257-264. PMid:12549764. http://dx.doi.org/10.1023/A:1021206826750 Nishino, H., Tokuda, H., Murakoshi, M., Satomi, Y., Masuda, M.,
Onozuka, M., Yamaguchi, S., Takayasu, J., Tsuruta, J., Okuda, M., Khachik, F., Narisawa, T., Takasuka, N., & Yano, M. (2000). Cancer prevention by natural carotenoids. Biofactors, 13(1), 89-94. PMid:11237205. http://dx.doi.org/10.1002/biof.5520130115 O’Neill, M. E. O., Carroll, Y., Corridan, B., Olmedilla, B., Granado, F.,
Blanco, I., Van Den Berg, H., Hininger, I., Rousell, A. M., Chopra, M., Southon, S., & Thurnham, D. I. (2000). A European carotenoid
4 Conclusions
The estimated carotenoid intake by Brazilian subjects was not within the prudent individual daily intake levels.
With regard to the beneficiaries of the ‘Bolsa Família’ Program, minimally processed and fresh foods were (except for girls) the main sources of carotenoids pro-vitamin A.
Processed foods contributed significantly to the the lutein + zeaxanthin contents for the elderly and lycopene for adults participating in the conditional cash transfer program. The contribution of highly processed foods in the supply of carotenoids was considered low for the entire sample.
Government initiatives and actions toward the production, development, and consumption of carotenoid-rich foods can integrate a strategy to fight vitamin A deficiency. Along with the promotion of other healthy living habits (balanced nutrition and active lifestyle), the consumption of carotenoids can also contribute to attenuate the occurrence of chronic degenerative diseases associated with oxidative stress in Brazil.
References
Amancio, R. D., & Silva, M. V. (2012). Carotenoids consumption in Brazil: a contribution of out-of-home food intake. Segurança
Alimentar e Nutricional, 19(2), 130-141.
Brasil. (1969). Institui normas básicas sobre alimentos (Decreto-Lei nº 986, de 21 de outubro de 1969). Diário Oficial da União. Brasil. Agência Nacional de Vigilância Sanitária. (2008). Lista de
alegações de propriedade funcional aprovadas. Brasília: Anvisa.
Retrieved from http://www.anvisa.gov.br/alimentos/comissoes/ tecno_lista_alega.htm
Instituto Brasileiro de Geografia e Estatística – IBGE. (2011). Pesquisa de Orçamentos Familiares 2008-2009: análise do consumo alimentar
pessoal no Brasil. Rio de Janeiro: IBGE.
Camargo, C. F., Curralero, C. R. B., Licio, E. C., & Mostafa, J. (2013). Perfil socioeconômico dos beneficiários do Programa Bolsa Família: o que o cadastro único revela? In T. Campello & M. C. Neri (Eds.),
Programa Bolsa Família: uma década de inclusão e cidadania (Cap. 9,
pp. 157-178). Brasília: IPEA.
Di Mascio, P., Kaiser, S., & Sies, H. (1989). Lycopene as the most efficient biological carotenoid singlet oxygen quencher. Archives
of Biochemistry and Biophysics, 274(2), 532-538. http://dx.doi.
org/10.1016/0003-9861(89)90467-0
Fisberg, M., Wheba, J., & Cozzolino, S. M. F. (2002). One, two, bean
with rice: food in Brazil from North to South. São Paulo: Atheneu.
Gaino, N. M., & Silva, M. V. (2012). Availability of carotenoids in brazilian households. Nutrire, 37(3), 227-244. http://dx.doi. org/10.4322/nutrire.2012.018
Gale, C. R., Ashurst, H. E., Powers, H. J., & Martyn, C. N. (2001). Antioxidant vitamin status and carotid atherosclerosis in the elderly. American Journal of Clinical Nutrition, 74(3), 402-408. PMid:11522566.
Giovannucci, E. (2011). Serum lycopene and prostate cancer progression: a re-consideration of findings from the prostate cancer prevention trial. Cancer Causes Control, 22(7), 1055-1059. PMid:21573862. http://dx.doi.org/10.1007/s10552-011-9776-x Gurak, P. D., Mercadante, A. Z., González-Miret, M. L., Heredia, F. J.,
Slater, B., Enes, C. C., López, R. V. M., Damasceno, N. R. T., & Voci, S. M. (2010). Validation of a food frequency questionnaire to assess the consumption of carotenoids, fruits and vegetables among adolescents: the method of triads. Cadernos de Saúde
Pública, 26(11), 2090-2100. PMid:21180982. http://dx.doi.
org/10.1590/S0102-311X2010001100010
Stacewicz-Sapuntzakis, M., & Bowen, P. E. (2005). Role of lycopene and tomato products in prostate health. Biochimica et Biophysica Acta, 1740(2), 202-205. PMid:15949687. http://dx.doi.org/10.1016/j. bbadis.2005.02.004
Stahl, W., & Sies, H. (1996). Lycopene: a biologically important carotenoid for humans? Archives of Biochemistry and Biophysics, 336(1), 1-9. PMid:8951028. http://dx.doi.org/10.1006/abbi.1996.0525
United States Department of Agriculture. (2012). USDA national
nutrient database for standard reference: release 25. Washington:
USDA. Retrieved from http://www.ars.usda.gov/Services/docs. htm?docid=8964
World Health Organization, Food and Agriculture Organization of the United Nations. (2013). Codex general standard for food additives:
report of the Joint FAO/WHO Expert Committee on Food Additives.
Roma: JECFA.
Yamaguchi, M. (2012). Role of carotenoid β-cryptoxanthin n bone homeostasis. Journal of Biomedical Science, 19, 36-51. PMid:22471523 PMCid:PMC3361488. http://dx.doi.org/10.1186/1423-0127-19-36 database to assess carotenoid intakes and its use in a five-country
comparative study. British Journal of Nutrition, 85(4), 499-507. http://dx.doi.org/10.1079/BJN2000284
Osganian, S. K., Stampfer, M. J., Rimm, E., Spiegelman, D., Manson, J. E., & Willett, W. C. (2003). Dietary carotenoids and risk of coronary artery disease in women. American Journal of Clinical
Nutrition, 77(6), 1390-1399. PMid:12791615.
Palozza, P., & Krinsky, N. I. (1992). Antioxidant effects of carotenoids
in vivo and in vitro: an overview. Methods in Enzymology, 213
, 403-420. http://dx.doi.org/10.1016/0076-6879(92)13142-K
Rodriguez-Amaya, D. B., Kimura, M., & Amaya-Farfan, J. (2008).
Brazilian sources of carotenoids: tabela brasileira de composição de
carotenoides em alimentos. Brasília: Ministério do Meio Ambiente.
Rodriguez-Amaya, D. B. (2010). Quantitative analysis, in vitro assessment of bioavailability and antioxidant activity of food carotenoids: a review. Journal of Food Composition and Analysis, 23(7), 726-740. http://dx.doi.org/10.1016/j.jfca.2010.03.008
Rodriguez-Amaya, D. B. (1999). Carotenoides y preparación de alimentos: la retención de los carotenoides provitamina a en alimentos
preparados, procesados y almacenados. Campinas: USAID.