Evaluating seabed habitat representativeness across a diverse
marine protected area network on the Mid-Atlantic ridge
UNIVERSIDADE DO ALGARVE
Faculdade de Ciências e Tecnologia
Evaluating seabed habitat representativeness across a
diverse marine protected area network on
the Mid-Atlantic ridge
Mestrado em Biologia Marinha
Supervisor:
Dr. Jorge Gonçalves
Co-supervisor
Dr. Pedro Afonso
UNIVERSIDADE DO ALGARVE
Faculdade de Ciências e Tecnologia
2019
Ao Pedro Afonso, pela amizade e pela orientação e ajuda na realização desta minha primeira autoria.
Ao Jorge Gonçalves por aceitar ser meu orientador, pela sua disponibilidade, e pela confiança depositada em mim e neste trabalho.
À Mara Schmiing pela infinita paciência, pela sua disponibilidade e pelo seu apoio. Danke
schön! Sem ti, o processo teria sido bem mais diferente.
À Patrícia Amorim, ao Fernando Tempera e à Bárbara Horta e Costa, pela sua ajuda e contributo na construção deste trabalho.
Aos meus amigos e família por serem e estarem. Moltes gràcies polits!
Aos meus colegas e amigos do DOP, pela sua ajuda incondicional e por me fazerem rir em momentos de desespero.
À Professora Doutora Rita Castilho, pela sua humildade, profissionalismo e ajuda prestada desde o início do meu processo.
Abstract
Marine ecosystem-based management requires good spatial information on the distribution of marine species and habitats. Because such information is often limited to a few sampled locations, modelling techniques can be applied to produce predictive distribution maps. Harmonized broad-scale seabed habitat map was recently produced for Europe under the EMODnet Seabed Habitats programme. This new information was used to produce an extent-based evaluation of the representativeness and level of protection conferred by the current MPA network in the Azores (mid-north Atlantic ridge) to the variety of benthic marine habitats found in this region. A more objective assessment of the protection provided to these habitats was obtained by applying a scoring system to the MPAs based on the number of allowed extractive and non-extractive human activities, and on their potential impact on marine biodiversity and habitats. Results show that habitats protected by the network are nearly entirely classified as highly protected. In total, 26 habitats (including seven endangered and two rare) meet the Aichi Biodiversity Target 11 of 10% of coastal and marine areas protected by 2020. However, another 29 habitats fail to meet even the lowest target (four on-shelf habitats and 25 deep-sea habitats). These results highlight the need to extend effective protection levels to bathyal and abyssal habitats and to apply adequate ecological coherence criteria in the region. This approach sets a standard than can be used wherever similar information is available, be it in other European regions or beyond.
Keywords: protected area network, representativeness, marine habitats, EUNIS, regulation-based classification, Azores
Resumo
A gestão baseada nos ecossistemas marinhos é considerada como a abordagem mais abrangente e desejável para gerir as atividades humanas nos mares e oceanos, desde há pelo menos três décadas. Atualmente, esta estratégia é central em várias iniciativas de planeamento espacial marinho, diretivas europeias (Natura 2000, OSPAR, Diretiva Quadro Estrategia Marinha) e projetos de crescimento azul (Blue Growth). Um componente crítico subjacente aos seus processos de tomada de decisão é um bom conhecimento sobre a diversidade, extensão e distribuição dos habitats e das espécies marinhas. Frequentemente, esse tipo de informação é limitada a certos locais amostrados, podendo diferentes técnicas de modelação ser aplicadas para produzir mapas preditivos de distribuição. Em conformidade com essa necessidade, a catalogação e o mapeamento harmonizado de habitats bentónicos em escalas regionais tornaram-se uma prioridade nas últimas duas décadas, fortalecendo os esforços de conservação marinha e auxiliando na elaboração de relatórios obrigatórios.
Neste contexto, foi recentemente produzido um mapa harmonizado dos habitats do fundo marinho em larga escala para a Europa, no âmbito do programa EMODnet Seabed Habitats, cobrindo desde o Mar de Barents à Macaronésia, e mares adjacentes como o Mediterrâneo e o Mar Negro. Este mapa segmenta os ambientes do fundo do mar de acordo com a classificação de habitat do Sistema Europeu de Informação da Natureza (EUNIS) - um sistema abrangente de classificação que utiliza uma série de critérios ambientais para criar e delimitar espacialmente classes de habitat de forma hierárquica e harmonizada. Este tipo de mapas harmonizados facilitam o estudo e gestão de habitats do fundo do mar entre regiões e países. Uma aplicação óbvia e fundamental é a consideração dos mesmos no desenho de uma rede representativa de áreas marinhas protegidas (AMPs), sendo esta uma componente fundamental nas políticas de gestão e conservação de recursos naturais e uma necessidade à escala das bacias oceânicas. Idealmente, uma rede de AMPs bem projetada deve representar a amplitude de habitats vulneráveis presentes em uma determinada região, bem como as ligações funcionais entre eles (ou seja, a conectividade). Tais considerações nem sempre são realizadas, nomeadamente em casos onde a rede de AMPs foi montada ao longo de décadas, por meio de uma sucessão de iniciativas descoordenadas, como é o caso do arquipélago dos Açores. Esta região de Portugal, é um setor remoto do Atlântico Nordeste, associado a uma importante Zona Econômica Exclusiva (ZEE), totalizando quase em 1 milhão de quilômetros quadrados e
meio do Atlântico. Múltiplos usos humanos têm impactado os ecossistemas marinhos, principalmente por meio da exploração intensiva de algumas espécies marinhas comerciais, degradação de habitats e poluição localizada. Os seus ambientes costeiros são considerados como significativamente impactados.
Neste trabalho, utilizaram-se as novas informações para produzir uma avaliação da rede de AMPs dos Açores, baseada tanto na extensão da sua representatividade, como do nível de proteção conferido à variedade de habitats marinhos bentónicos encontrados na região. Uma avaliação mais objetiva da proteção oferecida aos habitats é obtida mediante a aplicação de um sistema de pontuação às AMPs, com base no número de atividades humanas extrativas e não extrativas permitidas e seu potencial impacto na biodiversidade e habitats marinhos. De acordo com este sistema de classificação, as AMPs / zonas foram classificadas e pontuadas considerando 1) o número de artes de pesca permitidas (comerciais e / ou recreativas); 2) o impacto das artes de pesca (comerciais e / ou recreativas); 3) a presença de aquicultura e exploração do fundo do mar; e 4) permissão de atividades recreativas não-extrativas (ou seja, ancoragem e passeios de barco). A metodologia permitiu categorizar a força de regulamentação em vigor, com fim a proteger os habitats bentónicos.
Os resultados mostram que a ZEE é amplamente dominada pelo habitat do mar profundo (25% batial e 74% abissal), enquanto os habitats rasos (incluem a plataforma das ilhas e os cumes das montanhas submarinas) representam menos de 1%. Um total de 28 tipos únicos de habitats EUNIS foram identificados na ZEE dos Açores. Esse número aumenta para 55 se considerarmos o mesmo habitat por zona biológica, substrato e exposição hidrodinâmica (quando aplicável). Nove dos habitats EUNIS identificados estão listados na Lista Vermelha da UE de habitats marinhos, quatro como ameaçados de extinção e os restantes habitats como vulneráveis. Os habitats protegidos pela rede são quase inteiramente classificados como altamente protegidos. No total, 26 habitats (sete dos quais estão ameaçados e dois são raros) atendem à meta de biodiversidade de Aichi 11, que visa possuir 10% das áreas costeiras e marinhas protegidas até 2020. Outros 29 não atingem a meta mais baixa (quatro habitats da plataforma da ilha e 25 habitats do mar profundo), destacando a necessidade de ampliar a proteção dos habitats batiais e abissais e aplicar critérios adequados de coerência ecológica. A aplicação de uma classificação de AMP baseada em regulamentação fornece um “state-of-the-art” e uma maneira objetiva de qualificar números com base na extensão, que por si só, poderiam influenciar a perceção de quão bem o ecossistema está protegido. Mostra-se que
geral de áreas totalmente protegidas em toda a ZEE da região. Tais áreas poderiam contribuir para uma proteção mais efetiva da biodiversidade marinha dos Açores contra pressões diretas e difusas. Na atual configuração da rede de AMPs, níveis mais altos de proteção, como os sugeridos na “Promessa de Sydney” (30% das áreas totalmente protegidas), poderiam apenas ser previstos para habitats infralitorais, e somente se as AMPs da plataforma da ilha fossem vigorosamente regulamentadas. Os resultados demonstram ainda que poucas AMPs existentes incluem algum tipo de zoneamento, ao contrário das recomendações de planeamento marinho para estabelecer zonas-tampão em torno dos locais principais para a conservação. O presente estudo fornece assim uma base para os decisores abordarem as deficiências de conservação por habitats marinhos e demonstram uma abordagem transponível para outras regiões europeias ou fora delas, sempre que informações semelhantes estiverem disponíveis. Os novos mapas de habitats e AMPs devem facilitar o desenho de uma rede que atenda às metas internacionais de conservação baseadas em extensão, bem como aos critérios de coerência ecológica. Melhorar a confiança em algumas classes de habitat exige pesquisas mais refinadas que devem permitir a discriminação de habitats prioritários cuja ocorrência e distribuição na região é atualmente impossível de avaliar.
Palavras-chave: rede de áreas marinhas protegidas, representatividade, habitats marinhos, EUNIS, classificação da proteção, Açores
Contents
Agradecimentos ... i
Abstract ... ii
Resumo ... iii
Index of Figures ... vii
Index of Tables ... viii
List of Abbreviations ... ix
Chapter 1: Introduction ... 1
1.1 EUNIS Habitat classification and habitat mapping ... 1
1.2 Regulation-based assessment of MPA networks ... 3
1.3 The marine ecosystem and conservation in the Azores archipelago ... 4
1.4 Objectives ... 7
1.5 References ... 8
Chapter 2: Evaluating seabed habitat representativeness across a diverse marine protected area network on the mid-Atlantic ridge ... 10
2.1 Abstract ... 11
2.2 Introduction ... 12
2.3 Material and Methods ... 15
2.3.1 Study area ... 15
2.3.1 The Azorean MPA network ... 16
2.3.2 Biological zones and habitat types ... 17
2.3.3 Regulation-based assessment ... 20
2.4 Results ... 23
2.4.1 Biological zones and EUNIS habitat types ... 23
2.4.2 Regulation-based classification of MPAs ... 26
2.4.3 Biological zone and habitat coverage by the MPA network ... 30
2.5 Discussion ... 33
2.5.1 Marine habitats and biological zones in the Azores ... 33
2.5.2 The Azores MPA network ... 34
2.5.3 Representativeness of biological zones in the MPA network ... 35
2.5.4 Conclusions ... 36
2.6 Acknowledgements ... 38
Index of Figures
CHAPTER 1
Figure 1.1. Examples of the EUNIS habitat classification with its hierarchy and the main
criteria used for its level classification. An example of a rocky habitat is represented on the left and of a sandy habitat on the right side………...2
Figure 1.2. Regulation-Based Classification System for Marine Protected Areas Schema
(adapted from Horta e Costa 2016) ...………...3
Figure 1.3. Map of the Azores region with highest resolution bathymetric data…………5 Figure 1.4. Example of different regulations applied on the island of Santa Maria………6 CHAPTER 2
Figure 2.1 EMODnet-based biological zonation in the Azores subregion of the
Portuguese EEZ as defined by light penetration, wave energy (wave base ratio) and bathymetry. Insets show a) the western group, b) the central group, and c) the eastern group. Rectangles represent current MPAs classified per protection level (white for moderately protected areas, black for highly protected areas, brown for fully protected areas). Note: There is just one fully protected area (not visible at this scale). (Layer from EMODnet Seabed Habitats portal, https://www.emodnet-seabedhabitats.eu/access-data/download-data/)………...15
Figure 2.2 Representativeness of EUNIS habitats in the different biological zones of the
Azores (Na = non-identified habitats, *threatened habitats listed in EU Red List, 1rare habitats)………...25
Figure 2.3 Temporal evolution of the total protected marine area in the Azores
archipelago; values include all five types of designated MPAs in the Region (see text for explanation)……….30
Figure 2.4 Representativeness (in %) of each biological zone in the Azores MPA
network, classified by level of protection. 10 and 30% thresholds represent Aichi Biodiversity Target 11 and Sydney recommendation, respectively. Note: The only fully protected area covers a mere 0.1% of the infralittoral………...31
Figure 2.5 Representativeness of each EUNIS habitat per biological zone in the Azores
MPA network (*threatened habitats listed in EU Red List, 1 rare habitat). The colour code represents % of protection: White >30%, light grey 10-29%, dark grey 1-9% and black >1%...31
Index of Tables
CHAPTER 2
Table 2.1. Variables and physical limits used for identifying biological zones in the
Azores (adapted from Populus et al. 2017)………...17
Table 2.2. (3 pages) EUNIS Habitat types present in the Azores (Levels 2 to 4) (adapted
from EMODnet 2017)………..18
Table 2.3. Summary of existing fishing gears for commercial and recreational fisheries,
and other activities with corresponding scores in the Azores (adapted from Horta el al. 2016)………22
Table 2.4. (2 pages) Representativeness of biological zones (grey) and EUNIS habitats
of the Azores Economic Exclusive Zone and percentage of the area included in the Azores MPA network per protection level………...23
Table 2.5. (3 pages) List of MPA network and respective zones, adapted for this study.
List of Abbreviations
AMP – Azorean Marine Park AP – archaeological park
EEZ – Exclusive Economic Zone
EMODnet – European Marine Observation Data Network EUNIS – European Nature Information System
FMA – fisheries management area HR – harvest reserves
INP – Island Natural Park
IUCN – International Union for Conservation of Nature KE – kinetic energy
MPA – marine protected area
Chapter 1: Introduction
Ecosystem-based management is now accepted as the best approach to manage human activities in the marine environment (McLeold & Leslie 2012). Among other factors, it largely requires a good knowledge on the composition, diversity and extension of seabed habitats which are fundamental for scenarios underlying decision-making processes. Consequently, there has been an increasing demand for marine spatial planning programmes, European Directives reporting requirements, marine conservation efforts and Blue Growth projects that boosted the cataloguing and mapping of benthic habitats over the last two decades (Harris & Baker 2011; Vasquez et al. 2015; Populus et al. 2017). Two very important tools in this framework are a classification (and mapping) of the habitats, and a classification (and mapping) for the levels of protection via Marine Protected Areas of different forms.
1.1 EUNIS Habitat classification and habitat mapping
In Europe, broad-scale advances have been made chiefly under the projects EUSeaMap, BALANCE, MESH and MESH-Atlantic (Al-Hamdani & Reker 2007; Coltman et al. 2008; Vasquez et al. 2015; Populus et al. 2017), which compiled available seabed habitat maps for all European Seas and developed a method to model the broad-scale habitat distribution. The products of these projects have been brought together in a seamless broad-scale seabed habitat map that is publicly available via the EMODnet Seabed Habitats portal (https://www.emodnet-seabedhabitats.eu/access-data/download-data/). Identified habitat types were classified according to the European Union Nature Information System (EUNIS) habitat classification, a comprehensive classification system which provides a harmonised, hierarchical nomenclature based on defined criteria for habitat identification via environmental variables (Davies et al. 2004). The current version of the classification starts at level 1, where marine habitats are distinguished from their terrestrial counterparts. Level 2 broad habitat types are defined using a set of variables linked to substrate, depth and light. At level 3 (habitat complexes) hydrodynamic exposure (kinetic energy, KE) is used to segment rocky areas while sediments are divided based on their grain size, depth or exposure. The discrimination of level 4 habitats (biotope complexes) and beyond (level 5 biotopes and level 6 sub-biotopes) further requires the integration of increasingly refined biological information (Connor et al. 2004) (Figure 1.1).
Figure 1.1. Examples of the EUNIS habitat classification with its hierarchy and the main
criteria used for its level classification. An example of a rocky habitat is represented on the left and of a sandy habitat on the right side.
The resulting broad-scale map covers all European basins and seas, from the Black Sea to the Mediterranean, Macaronesia and the Barents Sea. As such, it offers a comparable and comprehensible distribution of seabed habitats across Europe (i.e., EMODnet 2017, Populus et al. 2017). Such harmonized maps facilitate transboundary studies and management of seabed habitats (Populus et al. 2017). One of the current main applications is their consideration in the design of a representative network of marine protected areas, which constitutes a fundamental component of conservation and natural resources management policies (e.g., Dunn et al. 2018). In order to develop a well-designed MPA network in a given region, a broad representation of
its vulnerable habitats should be included, as well as the functional links between them (i.e., connectivity). However, this is seldom the case. Instead, networks are typically the result of an incremental ad-hoc process. For example, in the Azores archipelago the current network has been built over nearly four decades as result of (often) disjoint initiatives (Abecasis et al. 2015).
1.2 Regulation-based assessment of MPA networks
Several methods have been proposed to evaluate the current protection awarded by MPAs (Pomeroy et al. 2005, Horta e Costa et al. 2016, Rodríguez-Rodríguez et al. 2018). In this study, a regulation-based classification will be used to assess the potential of existing regulations in conserving the marine ecosystem (Horta e Costa et al. 2016, Figure 1.2). This system considers cumulative levels of disturbances and the multitude of combination of regulations and can be applied in single and multiple-zoning MPAs. Existing MPA regulations are used as proxies of impacts of (non-)extractive human activities on marine biodiversity and habitats (Horta e Costa et al. 2016). Such classification may be used complementarily to the IUCN categories that classify MPAs according to their conservation objectives (Horta e Costa et al. 2017).
Figure 1.2. Regulation-Based Classification System for Marine Protected Areas Schema
1.3 The marine ecosystem and conservation in the Azores archipelago
The Azores archipelago is composed of nine volcanic islands, located along 600 km between 37ºN and 40ºN, crossing the Mid-Atlantic Ridge in the Northeast Atlantic. The Azores subregion of the Portuguese Exclusive Economic (Azorean EEZ) encloses an area of nearly 1 million km2. Because of their volcanic origin, the islands and about 400 seamounts are flanked by slopes that drop steeply to the sea bottom (Morato et al. 2008). This large marine territory averages a depth of nearly 3000m and is dominated by a diverse mosaic of deep-sea habitats (e.g., Braga-Henriques et al. 2013; Tempera et al. 2013). Shallow areas (<200m depth) represent a mere 0.2% of the Azorean EEZ, generally consisting of narrow island shelves and a few eroded seamount tops (Figure 1.3). Most of the shoreline is exposed to heavy oceanic swells, except for some small bays and harbours that create sheltered environments (Wallenstein & Neto 2006; Tempera 2008). Growing and accumulated pressure of human uses have led to degrading marine ecosystems, including for example habitat loss, overexploitation, and pollution (Crain et al. 2009). This region is amongst the most impacted coastal ecoregions (Halpern et al. 2015) and environmental awareness is steadily growing. Since the first MPAs were created in the region in the 1980s, a multitude of MPA designations succeeded in different legal forms and with varying objectives (Abecasis et al. 2015). Presently, the Azores MPA network spreads out over the whole archipelago and extends from coastal areas out to the deep sea, including areas within the claimed extended continental shelf and currently beyond national jurisdiction. The Azores MPA network can be understood as a national contribute to basin-wide efforts of protecting representative sectors of the Mid-Atlantic ridge from mining (Dunn et al. 2018).
Figure 1.3. Map of the Azores region.
The Azores MPA network is supported by two distinct legal features for biodiversity conservation and resource management: the Island Natural Parks (INPs) and the Azores Marine Park (AMP) established between 2008 and 2011(Abecasis et al. 2015). These MPAs vary in their legal forms and objectives (Abecasis et al. 2015), for example, they are used as a tool for biodiversity conservation and resource management implemented under regional initiatives or under different European Directives and Agreements, some of them being mandatory (e.g. OSPAR, Natura 2000, RAMSAR, Marine Strategy Framework Directive). However, most designated areas have not yet been fully implemented and management plans are still to be produced (Abecasis et al. 2015). Best knowledge available at the time of their creation often did not include relevant ecological information, such as on mobility in pelagic and adult stages of key species or the distribution of seabed habitats. In addition to these MPAs, other areas were designated a) for resource management (i.e., harvesting reserves and fisheries management areas), b) for the preservation of archaeological artefacts (i.e., archaeological parks), or c) have been promoted by local stakeholders. This diversity of designation
approaches and the absence of management plans create uncertainty on what in fact is protected and which restrictions do apply where (Abecasis et al. 2015) (Figure 1.4).
Figure 1.4. Example of different regulated marine areas in the island of Santa Maria.
New opportunities appear to carry out post-hoc assessments of the existing MPA network when new ecological information becomes available, such as the EMODnet seabed habitat coverage. This information can be used to improve conservation and management efforts concerning the Azores marine biodiversity and resources (see Abecasis et al. 2015). In this region, previous work evaluated the MPA coverage of infralittoral grounds (Schmiing et al. 2014, 2015; Amorim et al. 2015), however, important information such as the network’s level of representativeness of the full breadth of shallow to deep water seabed habitats remains completely unassessed. This lacking data is fundamental to guide international policies, such as protecting 10% of coastal and marine protected areas by 2020 under the Aichi Biodiversity Target 11 (CBD Strategic Plan for Biodiversity 2010), and for ongoing conservation initiatives, such as the ‘Promise of Sidney’ recommendation of achieving 30% of protection by no-take zones (Wenzel et al. 2016).
1.4 Objectives
This study aims at: i) assessing the composition and representativeness of Azorean benthic habitats, as well as the biological zonation in the Azores subregion of the Portuguese Economic Exclusive Zone (EEZ), using datasets available from EMODnet Seabed Habitats portal (https://www.emodnetseabedhabitats.eu/access-data/download-data/); ii) evaluating and critically assess the effectiveness of the current MPA network in protecting the multitude of different habitats and biological zones in relation to European and world targets; and iii) supporting decision making by proposing potential adjustments to improve management and conservation efforts in the Azores.
1.5 References
Abecasis RC, Afonso P, Colaço A, et al. (2015) Marine conservation in the Azores: evaluating marine protected area development in a remote island context. Front Mar Sci 2:104. doi: 10.3389/fmars.2015.00104
Al-Hamdani Z, Reker J, Alanen U, et al. (2007) Towards marine landscapes in the Baltic Sea. BALANCE. BALANCE Interim Report, No. 10
Amorim P, Atchoi E, Berecibar E, Tempera F (2015) Infralittoral mapping around an oceanic archipelago using MERIS FR satellite imagery and deep kelp observations: A new tool for assessing MPA coverage targets. J Sea Res 100:141–151. doi: 10.1016/j.seares.2014.10.002 Braga-Henriques A, Porteiro FM, Ribeiro PA, et al. (2013) Diversity, distribution and spatial structure of the cold-water coral fauna of the Azores (NE Atlantic). Biogeosciences 10:4009–4036. doi: 10.5194/bg-10-4009-2013
Coltman N, Golding N, Verling E (2008) Developing a broadscale predictive EUNIS habitat map for the MESH study area. MESH Interim Report: 16pp. Available online from http://www.emodnet-seabedhabitats.eu/pdf/MESH%20EUNIS%20model.pdf
Connor DW, Allen JH, Golding N, et al. (2004) The Marine Habitat Classification for Britain and Ireland. Version 04.05. Joint Nature Conservation Committee, Peterborough
Convention on Biological Diversity (2010) DecisionX/2—The Strategic Plan for Biodiversity 2011–2020 and the Aichi Biodiversity Targets. Tenth Meeting of the Conference of the Parties to the Convention on Biological Diversity, Nagoya, Aichi Prefecture, Japan
Crain CM, Halpern BS, Beck MW, & Kappel CV (2009) Understanding and managing human threats to the coastal marine environment. Annals of the New York Academy of Sciences,
1162(1), 39-62
Davies CE, Moss D, O Hill M (2004) EUNIS habitat classification revised 2004. Interim Report of European Environment Agency – European Topic Centre on Nature Protection and Biodiversity, UK
Dunn DC, Van Dover CL, Etter RJ, et al. (2018) A strategy for the conservation of biodiversity on mid-ocean ridges from deep-sea mining. Sci Adv 4:eaar4313. doi: 10.1126/sciadv.aar4313
European Marine Observation Data Network (EMODnet) (2017) Seabed Habitats project. https://www.emodnet-seabedhabitats.eu/access-data/download-data/. Accessed 17 October 2017
Halpern BS, Frazier M, Potapenko J, et al. (2015) Spatial and temporal changes in cumulative human impacts on the world’s ocean. Nat Commun 6:1–7. doi: 10.1038/ncomms8615 Harris PT, Baker EK (eds) (2011) Seafloor Geomorphology as Benthic Habitat: Geohab Atlas
of Seafloor Geomorphic Features and Benthic Habitats. Elsevier, London
Horta e Costa B, Claudet J, Franco G, et al. (2016) A regulation-based classification system for Marine Protected Areas (MPAs). Mar Policy 72:192–198. doi: 10.1016/j.marpol.2016.06.021
Horta e Costa B, Claudet J, Franco G, et al. (2017) A regulation-based classification system for marine protected areas: A response to Dudley et al. Mar Policy 77:193–195. doi:
McLeold K and Leslie H (Editors) (2009) Ecosystem-based management for the oceans. Island Press: 392pp.
Morato T, Machete M, Kitchingman A, et al. (2008) Abundance and distribution of seamounts in the Azores. Mar Ecol Prog Ser 357:17–21. doi: 10.3354/meps07268
Pomeroy RS, Watson LM, Parks JE, & Cid GA (2005) How is your MPA doing? A methodology for evaluating the management effectiveness of marine protected areas. Ocean
& Coastal Management, 48(7-8), 485-502
Populus J, Vasquez M, Albrecht J, et al. (2017) EUSeaMap. A European broad-scale seabed habitat map. doi: 10.13155/49975
Rodríguez-Rodríguez, D (2018) Rapid assessment of protection and ecological effectiveness of the Spanish Fishing Reserve Network. Mar Pol, 90, 29-36
Schmiing M, Diogo H, Santos RS, Afonso P (2014) Assessing hotspots within hotspots to conserve biodiversity and support fisheries management. Mar Ecol Prog Ser 513:187–199. doi: 10.3354/meps10924
Schmiing M, Diogo H, Santos RS, Afonso P (2015) Marine conservation of multispecies and multi-use areas with various conservation objectives and targets. ICES J Mar Sci 72:851– 862. doi: 10.1093/icesjms/fsu180
Tempera F (2008) Benthic Habitats of the extended Faial Island Shelf and their relationship to geologic, oceanographic and infralittoral biological features. Dissertation, University of St Andrews
Tempera F, Atchoi E, Amorim P, et al. (2013) Atlantic Area Marine Habitats. Adding new Macaronesian habitat types from the Azores to the EUNIS Habitat Classification. Technical Report No. 4/2013. MeshAtlantic, IMAR/DOP-UAç, Horta. doi: 10.13140/RG.2.1.3479.8808
Vasquez M, Mata Chacón D, Tempera F, et al. (2015) Broad-scale mapping of seafloor habitats in the north-east Atlantic using existing environmental data. J Sea Res 100:120–132. doi: 10.1016/j.seares.2014.09.011
Wallenstein FFMM, Neto AI (2006) Intertidal rocky shore biotopes of the Azores: a quantitative approach. Helgol Mar Res 60:196–206. doi: 10.1007/s10152-006-0035-6 Wenzel L, Laffoley D, Caillaud A, Zuccarino-Crowe C (2016) Protecting the World’s ocean - The Promise of Sydney. Aquat Conserv Mar Freshw Ecosyst 26:251–255. doi: 10.1002/aqc.2659
Chapter 2: Evaluating seabed habitat representativeness
across a diverse marine protected area network on the
mid-Atlantic ridge
David Milla-Figueras1,2,3 *, Mara Schmiing1,2,3, Patrícia Amorim1,3, Barbara Horta e Costa4, Pedro Afonso1,2,3, Fernando Tempera1,5
Affiliations:
1 Institute of Marine Research (IMAR), Department of Oceanography and Fisheries, University of the Azores, Rua Prof. Frederico Machado 4, 9901-862 Horta, Portugal. 2 Okeanos, Department of Oceanography and Fisheries, University of the Azores, University of the Azores, Rua Prof. Frederico Machado 4, 9901-862 Horta, Portugal. 3 Marine and Environmental Sciences Centre (MARE), Department of Oceanography and Fisheries, University of the Azores, Rua Prof. Frederico Machado 4, 9901-862 Horta, Portugal.
4 Centre of Marine Sciences, CCMAR, University of Algarve, Campus de Gambelas, Faro, 8005-139 Portugal
5 IFREMER, STH, Centre de Bretagne, Z.I. de la Pointe du Diable, CS 10070, 29280 Plouzané, France
*Corresponding author. [email protected] Tel. +351910989920
Keywords: protected area network, representativeness, marine habitats, EUNIS,
regulation-based classification, Azores
2.1 Abstract
Marine ecosystem-based management requires good spatial information on the distribution of marine species and habitats. Often, such information is limited to a few sampled locations and modelling techniques can be applied to produce predictive distribution maps. Harmonized broad-scale seabed habitat map was recently produced for Macaronesia under the EMODnet Seabed Habitats programme. We use this new information to produce an extent-based evaluation of the representativeness and level of protection conferred by the current Azores MPA network to the variety of benthic marine habitats found in this mid-ocean region. A more objective assessment of the protection provided to the habitats is obtained by applying a scoring system to the MPAs based on the number of permitted extractive and non-extractive human activities and their potential impact on marine biodiversity and habitats. Results show that habitats protected by the network are nearly entirely classified as highly protected. In total, 26 habitats (7 of which are endangered and 2 are rare ones) meet the Aichi Biodiversity Target 11 of having 10% of coastal and marine areas protected by 2020. Another 29 fail to meet even the lowest target (four on-shelf habitats and 25 deep-sea habitats), highlighting the need to extend protection of bathyal and abyssal habitats and applying adequate ecological coherence criteria. The approach utilized sets a standard than can be used wherever similar information is available, be it in other European regions or beyond.
2.2 Introduction
Marine ecosystem-based management has been endorsed as a most comprehensive and desirable approach to manage human activities in the seas and oceans for at least 3 decades (e.g., Fogarty and McCarthy 2014). Currently it is at the core of several marine spatial planning initiatives, European Directives and Blue Growth projects (Hoof et al. 2012; Lillebø et al. 2017).
A critical component underlying its decision-making processes is a good knowledge on the diversity, extent and distribution of seabed habitats. In line with this need, cataloguing and harmonized mapping of benthic habitats at regional scales has become a priority over the last two decades (Harris and Baker 2011; Vasquez et al. 2015; Populus et al. 2017) strengthening marine conservation efforts and assisting reporting obligations.
In Europe, advances towards mapping the seabed environments at broad scales have been made chiefly under the projects EUSeaMap, BALANCE, MESH and MESH-Atlantic (Al-Hamdani et al. 2007; Davies and Young 2008; Vasquez et al. 2015; Populus et al. 2017). Over more than one decade they developed and refined a method (named EUSeaMap) to model the broad-scale habitat distribution and compiled available seabed habitat maps for all European Seas. The resulting products are currently available as a seamless broad-scale seabed habitat map distributed via the EMODnet Seabed Habitats portal (https://www.emodnet-seabedhabitats.eu/access-data/download-data/). Seafloor environments are segmented according to the European Nature Information System (EUNIS) habitat classification - a comprehensive classification system which uses a series of environmental criteria to create and spatially delimit harmonised, hierarchical habitat classes (Davies et al. 2004). The resulting broad-scale map offers comparable and comprehensive maps of European seabed habitats covering from the Barents Sea to Macaronesia as well as adjacent seas like the Mediterranean and the Black Sea (Populus et al. 2017).
Such harmonized maps facilitate the study and management of seabed habitats across regions and countries (Populus et al. 2017). An obvious and key application is their consideration in the design of a representative marine protected area (MPA) network, which is a fundamental component of natural resource management and conservation policies and a need at ocean basin scales (e.g., Dunn et al. 2018). Ideally, a well-designed MPA network should represent the breadth of vulnerable habitats present in a given
region as well as the functional links between them (i.e., connectivity). Where MPA networks have been put together over decades via a succession of uncoordinated initiatives this is not always accomplished.
The Azores region is a remote sector of the wider Northeast Atlantic associated to an important Exclusive Economic Zone (EEZ) totalling nearly 1 million square kilometres and encompassing a varied mosaic of sublittoral to deep-sea habitats straddling the mid-Atlantic ridge. Multiple human uses have impacted marine ecosystems, notably via the intensive exploitation of some commercial marine species, habitat degradation and localised pollution (Santos et al. 1995; Abecasis et al. 2015). According to Halpern et al. (2015) its coastal environments are significantly impacted.
Since the first Azores MPAs were created in the 1980s, environmental awareness has steadily grown and a multitude of MPA designations have succeeded. Presently, the Azores MPAs are spread all over the archipelago and combine coastal and deep-sea environments, including areas within the claimed extended continental shelf. Apart from its role at national level, the Azores MPA network can also be seen as a contribution to basin-wide efforts of protecting representative sectors of the mid-Atlantic ridge from mining (Dunn et al. 2018).
The Azores MPA network is supported by two distinct types of legal designations related to biodiversity conservation and resource management: the Island Natural Parks (INPs) and the Azores Marine Park (AMP). These MPAs vary in their legal framing and include a series of areas aimed at either biodiversity conservation or local resource management goals (Abecasis et al. 2015). Part of them integrates broader nature protection networks such as Natura 2000, OSPAR, RAMSAR and Biosphere Reserve networks. In addition to these designations, other spatially-based measures are applied in the archipelago including a) fishing management areas, b) underwater archaeological parks, and c) small (non legally-binding) fishing closures promoted by local stakeholders.
Ecological knowledge available at the time of MPA creation was often incomplete. Exhaustive benthic habitat maps were often unavailable and information on the mobility of the pelagic and adult stages of targeted fish species has only started to be available in the last 15 years. As new comprehensive datasets become available, such as the EMODnet seabed habitat coverage, opportunities arise to conduct post-hoc assessments
of the existing MPA network and propose necessary amendments (see Abecasis et al. 2015).
Although earlier works assessed the MPA coverage of infralittoral grounds in the Azores (Amorim et al. 2015; Schmiing et al. 2014, 2015), the network’s level of representativeness of the full breadth of shallow to deep-water seabed habitats that characterize the region remains unassessed. Such information is instrumental to guide regional, national and international action contributing towards conservation goals like the Aichi Biodiversity Target 11 (CBD Strategic Plan for Biodiversity 2010) of having 10% of coastal and marine areas protected by 2020 or the ‘Promise of Sydney’ recommendation (Wenzel et al. 2016) of achieving 30% of protection by no-take zones. In this study the newest EUSeaMap broad-scale habitat map is used to evaluate the representativeness and level of protection awarded by the Azores MPA network to the variety of benthic marine habitats found in the Azores subregion of the Portuguese EEZ (herafter named the Azores EEZ). For this purpose, the EUSeaMap habitat map is first extracted, refined and updated to the whole region. Secondly, a regulation-based classification is applied to the Azores MPA network with each zone/MPA being scored on the basis of the number of permitted extractive and non-extractive human activities and their potential impact on marine biodiversity and habitats.
Finally, both sets of information are combined to produce an extent-based analysis of the seabed habitats designated under the current MPA network accounting for the level of protection they statutorily afford from the regulations in place.
2.3 Material and Methods
2.3.1 Study areaThe Azores archipelago is composed of nine volcanic islands, located along 600 km between 37ºN and 40ºN and straddling the Mid-Atlantic Ridge in the Northeast Atlantic (Figure 2.1). The Azores EEZ encloses an area of nearly 1 million km2. Because of their volcanic origin, the islands and about 400 seamounts are flanked by slopes that drop steeply to the ocean floor (Morato et al. 2008). This large marine territory averages a depth of nearly 3000 m and is dominated by a diverse mosaic of deep-sea habitats (e.g., Braga-Henriques et al. 2013; Tempera et al. 2013). Shallow areas (<200m depth) represent a mere 0.2% of the Azores EEZ, generally consisting of narrow island shelves and some heavily eroded seamount tops. Most of the shoreline is exposed to strong oceanic swells. Sheltered environments are limited to a few small bays and artificial harbours (Wallenstein and Neto 2006; Tempera 2008).
Figure 2.1. EMODnet-based biological zonation in the Azores subregion of the
Portuguese EEZ as defined by light penetration, wave energy (wave base ratio) and bathymetry. Insets show a) the western group, b) the central group, and c) the eastern group. Rectangles represent current MPAs classified as moderately protected areas (white), highly protected areas (black), or fully protected areas (brown). Note: There is just one fully protected area (not visible at this scale). (Layer from EMODnet Seabed Habitats portal, https://www.emodnet-seabedhabitats.eu/access-data/download-data/).
2.3.1 The Azorean MPA network
Five types of legally-designated areas were considered as components of the Azores MPA network comprehending coastal and offshore areas. All of them have regulations that limit human activities directly affecting organisms associated with the seafloor and thereby contributing to achieving biodiversity conservation and living resource management goals. They consist of: 1) Island Natural Parks (INPs) generally aimed at protecting coastal areas (number MPAs=35); and 2) the Azores Marine Park (AMP) that encompasses offshore areas (n=11 inside the EEZ) (Abecasis et al. 2015). MPAs belonging to either an INP or the AMP are legally linked to goals of biodiversity conservation (Abecasis et al. 2015) and classified according to IUCN categories. Other designations include 3) harvest reserves (HRs), which specifically target the protection
of living benthic resources (n= 37); 4) fisheries management areas (FMAs), which aim to reduce conflicts by regulating fishing activity and access (n=12); and 5) archaeological parks (APs) designated to protect historical wrecks but which protect de facto the associated biodiversity via their prohibition of fishing and anchoring (n=5).
In some cases, those areas partly overlap in space with regulations adding up. This required merging or splitting of some MPAs prior to the analysis. All contiguous and overlapping areas were considered to be zones of the same MPA. If an MPA only partly laid inside the Azores EEZ then only this fraction was considered. MPAs in the extended continental shelf were thereby excluded from this study. The resulting set of polygons was subsequently used in the analysis.
2.3.2 Biological zones and habitat types
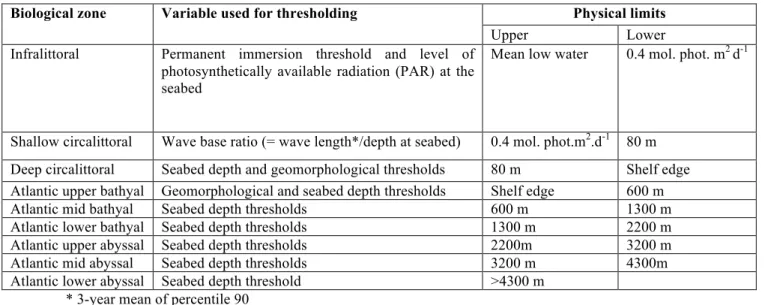
The biological zones are an intrinsic part of the EUNIS Marine Habitat Classification, which uses different environmental variables to define and classify habitats in a hierarchical system (Connor et al. 2004). The general depth-wise biological zonation of the Azores marine ecosystem was derived from a classification of raster layers representing light levels, wave energy (wave-base ratio) and bathymetry data (Vasquez et al. 2015). This zonation is presented in Table 2.1 and takes on board recent refinements proposed to the bathyal and abyssal thresholds (see Populus et al. 2017 for details).
Table 2.1. Variables and physical limits used for identifying biological zones in the
Azores (adapted from Populus et al. 2017).
Biological zone Variable used for thresholding Physical limits
Upper Lower
Infralittoral Permanent immersion threshold and level of photosynthetically available radiation (PAR) at the seabed
Mean low water 0.4 mol. phot. m2 d-1
Shallow circalittoral Wave base ratio (= wave length*/depth at seabed) 0.4 mol. phot.m2.d-1 80 m Deep circalittoral Seabed depth and geomorphological thresholds 80 m Shelf edge Atlantic upper bathyal Geomorphological and seabed depth thresholds Shelf edge 600 m
Atlantic mid bathyal Seabed depth thresholds 600 m 1300 m
Atlantic lower bathyal Seabed depth thresholds 1300 m 2200 m
Atlantic upper abyssal Seabed depth thresholds 2200m 3200 m
Geospatial layers downloaded from the Seabed Habitats EMODnet portal on 17th October 2017 were used as the source of biological zone data and habitat data (Table 2.2). This seabed habitat map is endorsed by the European Union via the EMODnet programme and is the first product to provide a broad-scale full-coverage map of the region. The layer resulted primarily from the project MESH-Atlantic (see Vasquez et al. 2015), which fed upon earlier smaller-scale efforts to survey, catalogue and map habitats (e.g., projects MAROV, MARÉ, GEMAS, BIOTOPE, OGAMP, MARMAC).
Prior to the analysis, the EuSeaMap data layer (EMODnet 2017) was projected to the ‘PTRA 08/UTM zone 26N’ coordinate system and clipped using the maritime area contained between the shoreline and the 200 nautical mile limit of the Azores EEZ. Thin blank slivers adjacent to the coast were simply classed as part of the infralittoral zone. No seabed type could be attributed to them, so their areas contributed only to obtaining more accurate infralittoral extents. The coverage of each EUNIS habitat in each biological zone was then estimated. Habitats with less than 1% of coverage per zone were considered ‘rare’. All spatial analyses were performed in a Geographical Information System (GIS) using ArcGISTM 10.1 (ESRI®).
Table 2.2. (3 pages) EUNIS Habitat types present in the Azores (Levels 2 to 4) (adapted
from EMODnet 2017).
EUNIS Code
Habitat EUNIS Biological zone Substrate Energy
A3.1 Atlantic and Mediterranean high energy infralittoral rock
Infralittoral Rock or other
hard substrata
High energy A3.2 Atlantic and Mediterranean moderate
energy infralittoral rock
Infralittoral Rock or other
hard substrata
Moderate energy A3.3 Atlantic and Mediterranean low energy
infralittoral rock
Infralittoral Rock or other
hard substrata Low energy A4.1 Atlantic and Mediterranean high energy
circalittoral rock
Shallow circalittoral Rock or other
hard substrata
High energy A4.12 Sponge communities on deep circalittoral
rock
Deep circalittoral Rock or other
hard substrata
High energy A4.2 Atlantic and Mediterranean moderate
energy circalittoral rock
Shallow circalittoral Rock or other
hard substrata
Moderate energy A4.27 Faunal communities on deep moderate
energy circalittoral rock
Deep circalittoral Rock or other
hard substrata
Moderate energy A4.3 Atlantic and Mediterranean low energy
circalittoral rock
Shallow circalittoral Rock or other
hard substrata Low energy A4.33 Faunal communities on deep low energy
circalittoral rock
Deep circalittoral Rock or other
hard substrata Low energy
A5.13 Infralittoral coarse sediment Infralittoral Coarse
sediment
A5.14 Circalittoral coarse sediment Shallow circalittoral Coarse sediment
NA
A5.15 Deep circalittoral coarse sediment Deep circalittoral Coarse
sediment
NA A5.23/
A5.24
Infralittoral fine sand/Infralittoral muddy sand
Infralittoral Sand NA
A5.25/ A5.26
Circalittoral fine sand/Circalittoral muddy sand
Shallow circalittoral Sand NA
A5.27 Deep circalittoral sand Deep circalittoral Sand NA
A5.33 Infralittoral sandy mud Infralittoral Sandy mud to
muddy sand
NA
A5.34 Infralittoral fine mud Infralittoral Fine mud NA
A5.35 Circalittoral sandy mud Shallow circalittoral Sandy mud to
muddy sand
NA
A5.37 Deep circalittoral mud Deep circalittoral Sandy mud to
muddy sand
NA
A5.43 Infralittoral mixed sediments Infralittoral Mixed
sediment
NA
A5.44 Circalittoral mixed sediments Shallow circalittoral Mixed
sediment
NA
A5.45 Deep circalittoral mixed sediments Deep circalittoral Mixed
sediment
NA
A6 Deep-sea bed Atlantic lower bathyal Coarse
sediment
NA
A6 Deep-sea bed Atlantic upper bathyal Coarse
sediment
NA
A6 Deep-sea bed Atlanto-Mediterranean mid bathyal Coarse
sediment
NA
A6.11 A6.11 : Deep-sea bedrock Atlantic lower abyssal Rock or other
hard substrata Low energy
A6.11 A6.11 : Deep-sea bedrock Atlantic lower bathyal Rock or other
hard substrata Low energy
A6.11 A6.11 : Deep-sea bedrock Atlantic mid abyssal Rock or other
hard substrata Low energy
A6.11 A6.11 : Deep-sea bedrock Atlantic upper abyssal Rock or other
hard substrata Low energy
A6.11 A6.11 : Deep-sea bedrock Atlantic upper bathyal Rock or other
hard substrata
High energy
A6.11 A6.11 : Deep-sea bedrock Atlantic upper bathyal Rock or other
hard substrata
Moderate energy
A6.11 A6.11 : Deep-sea bedrock Atlantic upper bathyal Rock or other
hard substrata Low energy A6.11 A6.11 : Deep-sea bedrock Atlanto-Mediterranean mid bathyal Rock or other
hard substrata Low energy
A6.2 Deep-sea mixed substrata Atlantic lower bathyal Mixed
sediment
NA
A6.2 Deep-sea mixed substrata Atlantic mid abyssal Mixed
sediment
NA
A6.2 Deep-sea mixed substrata Atlantic upper abyssal Mixed
sediment
NA
A6.2 Deep-sea mixed substrata Atlantic upper bathyal Mixed
sediment
NA
A6.2 Deep-sea mixed substrata Atlanto-Mediterranean mid bathyal Mixed
sediment
NA
A6.3 Deep-sea sand Atlantic lower bathyal Sand NA
A6.3 Deep-sea sand Atlantic mid abyssal Sand NA
A6.3 Deep-sea sand Atlanto-Mediterranean mid bathyal Sand NA
A6.4 Deep-sea muddy sand Atlantic lower abyssal Sandy mud to
muddy sand
NA
A6.4 Deep-sea muddy sand Atlantic lower bathyal Sandy mud to
muddy sand
NA
A6.4 Deep-sea muddy sand Atlantic mid abyssal Sandy mud to
muddy sand
NA
A6.4 Deep-sea muddy sand Atlantic upper abyssal Sandy mud to
muddy sand
NA
A6.4 Deep-sea muddy sand Atlantic upper bathyal Sandy mud to
muddy sand
NA
A6.4 Deep-sea muddy sand Atlanto-Mediterranean mid bathyal Sandy mud to
muddy sand
NA
A6.5 Deep-sea mud Atlantic lower abyssal Fine mud NA
A6.5 Deep-sea mud Atlantic lower bathyal Fine mud NA
A6.5 Deep-sea mud Atlantic mid abyssal Fine mud NA
A6.5 Deep-sea mud Atlantic upper abyssal Fine mud NA
A6.5 Deep-sea mud Atlantic upper bathyal Fine mud NA
A6.5 Deep-sea mud Atlanto-Mediterranean mid bathyal Fine mud NA
2.3.3 Regulation-based assessment
The Azores MPAs/zones were categorized according to a regulation-based classification system (Horta e Costa et al. 2016) to harmonise protection levels. This system considers the different types of uses allowed inside MPAs and their potential impact on biodiversity and habitats to categorize the regulation strength in force to protect benthic habitats. First, zones were classified and scored based on 1) the number of fishing gears allowed (commercial and/or recreational) classified into six groups (0, ]0-5], ]5,10], ]10-15], ]15-20], >20); 2) the impact of fishing gear (commercial and/or recreational) ranging from 0 (no fishing allowed) to 9 (most destructive gear); 3) the presence of aquaculture and seabed exploitation grouped into 0= prohibited, 1= aquaculture or bottom exploitation permitted but sand extraction, mining or oil and gas exploitation forbidden, 2= all activities permitted with no restrictions; and 4) permission of recreational non-extractive activities (i.e. anchoring, and boating) grouped into 0= anchoring not allowed, 1= activities allowed but anchoring is fully regulated, and 2= boating/anchoring allowed but anchoring is only partially or not regulated (see Horta e Costa et al. 2016 for details). Table 2.3 summarises the scores attributed to the different types of fishing gear used by the commercial fleets and recreational fishermen as well as to other activities. Other highly impacting gears, such as bottom trawling, are prohibited inside almost the entire Azores EEZ (Council Regulation (EC) No 1568/2005; DLR No 29/2010/A, republished in Annex II to DLR No 30/2012/A). Harvest reserves did not receive the most restrictive score where they still allowed the exploitation of some species (i.e., octopus, certain
crustaceans, or algae). The classification system was adapted to reflect the current situation in the Azores, disregarding potential future uses which currently do not occur but are not forbidden either. Hence, sand extraction was the single seabed exploitation considered because other potential bottom impacting activities, such as commercial aquaculture, mining, and wind farms are currently absent in the Azores. The resulting classification varies between 1 (no-take/no-go) and 8 (unregulated extraction) (Horta e Costa et al. 2016). Zone classes were then used to obtain an MPA index (IMPA) through the formula:
!"#$ = &'(× $'( $"#$
*'
'+,
where C is the class of the zone (z) i, Az the area of zone i, and AMPA the total area of the respective MPA (Horta e Costa et al. 2016). This index is continuous and ranges from 1 to 8 and is finally used to classify each MPA under one of five categories ranging from ‘fully protected’ to ‘unprotected’. The extent of each biological zone and each EUNIS habitat type inside each MPA and its associated index were subsequently calculated.
Table 2.3. Summary of existing fishing gears for commercial and recreational fisheries,
and other activities with corresponding scores in the Azores (adapted from Horta el al. 2016).
Fishing gear Commercial
fisheries
Recreational
fisheries Gear Score
Traps (lobster/octopus/crab) Yes No 4
Fish traps Yes No 6
Fixed fish traps "madrague" No No 6
Lines (jigs, hook and line, rod, troll) Yes Yes 5
Longlines (pelagic) Yes No 4
Longlines (bottom) Yes No 5
Purse seining (pelagic) Yes No 5
Purse seining (bottom) No No 9
Beach seines No No 8
Trawl (pelagic) No No 5
Trawl (bottom) No No 9
Gillnets Yes No 6
Trammel nets No No 8
Surrounding nets near shore No No 8
Drift nets No No 5
Dredges (bivalves) No No 7
Hand dredges (bivalves) No No 5
Spearfishing/diving No Yes 3
Cast nets No No 3
Intertidal hand captures Yes No 3
Hand harvesting No Yes 4
Other extractive activities Score
Aquaculture or bottom exploitation not allowed 0
Aquaculture or bottom exploitation allowed, but not sand extraction 1 Both allowed with no restrictions or sand extraction allowed 2
Recreational non-extractive
activities Score
No anchoring 0
Boating and/or anchoring allowed, but anchoring fully regulated 1 Boating and/or anchoring allowed, but anchoring is partially regulated
or unregulated
2.4 Results
2.4.1 Biological zones and EUNIS habitat types
The biological zonation of the Azores EEZ established in the EUSeaMap layer is presented in Figure 2.1. The EEZ (954.5 x 10³ km2) is largely dominated by deep-sea habitat (25.4% bathyal and 74.4% abyssal) whereas shallow habitats (i.e. island shelf and shallow seamounts summits) represent a mere 0.2% (Table 2.4).
Table 2.4. (2 pages) Representativeness of biological zones (grey) and EUNIS habitats
of the Azores Economic Exclusive Zone and percentage of the area included in the Azores MPA network per protection level.
Ha bi ta t T yp e (% E E Z ) T ot al a re a [K m 2 ] % ha bi ta t p er b io lo gi ca l zo ne % F ul ly p ro te ct ed % H ig hl y pr ot ec te d % M od er at el y pr ot ec te d % T ot al p ro te ct ed ( K m 2 ) Infralittoral (0.1%) 814.2 0.1 25.6 17.2 42.9% (348.9) A3.1 174.5 21.4 0 26.3 18.8 45.1% (78.6) A3.2 122.8 15.1 0 27.1 16.1 43.2% (53.1) A3.3 54.3 6.7 0 30.6 19.5 50.1% (27.2) A5.13* 52.1 6.4 0 10.4 26.6 37.0% (19.2) A5.23/A5.24 130.5 16.0 0 27.3 21.3 48.7% (63.5) A5.331 1.0 0.1 0 0 0 0% (0) A5.341 0.2 <0.1 0 0 0 0% (0) A5.43 96.8 11.9 0.6 28.3 5.8 34.7% (33.6) NI 182.0 22.4 <0.1 24.2 16.2 40.5% (73.7) Shallow circalittoral (<0.1%) 120.0 0 12.6 10.8 23.4% (28.1) A4.1 5.8 4.9 0 9.2 24.8 34.1% (2.0) A4.2 16.1 13.4 0 13.1 7.9 21.1% (3.4) A4.3 19.9 16.6 0 9.2 22.5 31.7% (6.3) A5.14* 14.1 11.8 0 8.8 3.2 12.0% (1.7) A5.25/A5.26* 21.6 18.0 0 17.2 15.5 32.7% (7.0) A5.35*1 0.5 0.5 0 15.6 0 15.6% (0.1) A5.44* 38.3 31.9 0 12.4 5.1 17.5% (6.7) NI 3.6 3.0 0 23.9 1.2 25.0% (0.9) Deep circalittoral (0.1%) 875.5 0 8.2 6.8 15.0% (131.2) A4.12 16.7 1.9 0 29.8 16.7 46.5% (7.8) A4.27 29.1 3.3 0 10.6 12.8 23.4% (6.8) A4.33 294.3 33.6 0 9.0 11.3 20.2% (59.6) A5.15* 134.6 15.4 0 5.5 1.6 7.2% (9.6) A5.27* 112.7 12.9 0 6.4 7.6 13.9% (15.7) A5.37*1 4.1 0.5 0 0 0 0% (0) A5.45* 262.4 30.0 0 8.1 2.7 10.8% (28.2) NI 21.7 2.5 0 5.7 10.6 16.2% (3.5)
Atlantic upper bathyal (0.7%) 6283.3 0 7.6 2.0 9.6% (602.4)
A6 198.4 3.2 0 3.6 1.0 4.6% (9.2)
A6.11 1042.7 16.6 0 5.7 1.9 7.6% (79.5)
A6.5 507.2 8.1 0 <0.1 0 <0.1% (0.1)
Atlanto-Mediterranean mid bathyal (4.3%) 41108.1 0 5.3 0.6 5.8% (2400.5)
A61 386.1 0.9 0 25.5 0 25.5% (98.4) A6.11 2853.4 6.9 0 7.2 0.2 7.4% (210.4) A6.2 10052.1 24.5 0 9.5 1.3 10.8% (1088.1) A6.3 5350.2 13.0 0 8.4 1.6 9.9% (530.8) A6.41 290.8 0.7 0 1.2 3.9 5.1% (14.8) A6.5 22175.5 53.9 0 2.0 <0.1 2.1% (457.9)
Atlantic lower bathyal (20.4%) 194831.0 0 4.9 <0.1 4.9% (9610.4)
A61 118.4 0.1 0 <0.1 0 <0.1% (<0.1) A6.11 2373.6 1.2 0 4.9 <0.1 4.9% (115.7) A6.2 8358.2 4.3 0 11.7 0.1 11.8% (985.5) A6.3 4510.2 2.3 0 9.3 0.1 9.4% (422.3) A6.4 2348.0 1.2 0 0.2 0 0.2% (3.8) A6.5 177122.7 90.9 0 4.6 <0.1 4.6% (8083.1)
Atlantic upper abyssal (27.2%) 259985.2 0 5.2 0 5.2% (13456.7)
A6.111 1014.0 0.4 0 3.6 0 3.6% (36.2)
A6.21 1242.0 0.5 0 2.0 0 2.0% (25.2)
A6.31 549.8 0.2 0 <0.1 0 <0.1% (0.2)
A6.4 6197.2 2.4 0 0.3 0 0.3% (18.3)
A6.5 250982.2 96.5 0 5.3 0 5.3% (13376.8)
Atlantic mid abyssal (32.1%) 306729.4 0 2.6 0 2.6% (7828.4)
A6.111 2635.8 0.9 0 0.9 0 0.9% (24.6)
A6.21 0.2 <0.1 0 0 0 0% (0)
A6.31 226.9 0.1 0 0 0 0% (0)
A6.4 11544.3 3.8 0 <0.1 0 <0.1% (<0.1)
A6.5 292322.3 95.3 0 2.7 0 2.7% (7803.8)
Atlantic lower abyssal (15.1%) 143753.1 0 0.1 0 0.1% (199.9)
A6.111 352.2 0.2 0 0 0 0% (0)
A6.41 12.0 <0.1 0 0 0 0% (0)
A6.5 143388.9 99.7 0 0.1 0 0.1% (199.9)
Total area EEZ 954499.7 100 <0.1 3.6 0.1 3.6% (34606.5)
Shallow habitats 1809.7 0.2 <0.1 16.3 11.7 28.1% (508.2)
Deep sea habitats 952690.0 99.8 0 3.5 <0.1 3.6% (34098.3)
NI habitat in shallow zones 207.3 11.5 <0.1 22.3 15.4 37.7% (78.1)
NI = non-identified habitat; *threatened habitats listed in EU Red List; 1rare habitats
A total of 28 unique EUNIS habitat types were identified in the Azores EEZ. This number rises to 55 if we consider the same habitat per biological zone, substrate and hydrodynamic exposure (when applicable) (Table 2.2, Figure 2.2; e.g., six EUNIS habitat A6.2 in Atlantic lower bathyal, Atlantic upper bathyal, Atlantic mid abyssal, Atlantic upper abyssal, Atlanto-Mediterranean mid bathyal biological zones). Shallow zones, although least represented, presented higher habitat diversity when compared with deeper zones. A decrease in habitat diversity per biological zone was observed, from eight habitats in the infralittoral to three habitats in the Atlantic lower abyssal (Figure 2.2). Almost the entire Azores EEZ was classified as deep-sea bed (99.8%, A6; Table 2.4), of which deep-sea mud (A6.5) dominated with almost 93% of coverage (72% at abyssal depths and 21% at bathyal ones). About 43.2% of the infralittoral was composed of hard
substrates (habitats A3.1, A3.2 and A3.3), of which 21.4% were classified with a high hydrodynamic exposure (Atlantic and Mediterranean high energy infralittoral rock – A3.1). Contrastingly, sediment was less common in the infralittoral (16.0% corresponding to infralittoral fine sand/infralittoral muddy sand – A5.23/A5.24). About 11.5% of the infralittoral had no associated substrate data (Table 2.4). The shallow circalittoral was dominated by circalittoral mixed sediment (A5.44; 31.9%) and circalittoral fine sand/circalittoral muddy sand habitats (A5.25/A5.26; 18.0%), whereas the deep circalittoral was mostly characterised by faunal communities on deep low energy circalitoral rock (A4.33, 33.6%) and deep circalittoral mixed sediments (A5.45, 30.0%). Sixteen rare habitats with less than 1% of coverage per zone were identified among all biological zones (Table 2.4).
Figure 2.2. Representativeness of EUNIS habitats in the different biological zones of the
Azores (NI = non-identified habitats, *threatened habitats listed in EU Red List, 1rare habitats).
Nine of the identified EUNIS habitats are listed on the EU Red List of marine habitats, four as endangered (A5.25/A5.26, A5.27, A5.35, A5.37) and the remaining habitats (A5.13, A5.14, A5.15, A5.44, A5.45) as vulnerable (Gubbay et al. 2016). They occur in the infra- and circalittoral and cover small areas, ranging from 0.5 to 262.4 km2 (Table 2.4).
2.4.2 Regulation-based classification of MPAs
The application of the different protection typologies results in a total of 100 legally-designated areas that cover a total of 34,606.5 km2 and 3.6% of the Azores EEZ (Table 2.5, Figure 2.3). The “re-organized” network contained a final set of 46 MPAs composed of 93 zones. A single MPA encompassed up to 10 zones with distinct protection regime (Table 2.5) and a maximum of four overlapping zones (e.g. MPA ‘Azo24’). Most of the classified no-take zones (4 of 6) are legally-designated as, e.g. FMAs and APs, but are not part of the biodiversity-oriented MPAs (Table 2.5).
Table 2.5. (3 pages) List of MPA network and respective zones, adapted for this study. Overlapping and adjacent protected areas were edited and
joined to the same MPA.
MP A c od e Nr . o f zo ne s Zo ne C ode Ye ar Nr . fi sh in g ge ar s Ma x. z on e ge ar s co re Ma x. o th er a ct iv it ie s sc or e Ma x. o th er re cre at io na l. us es sc or e Zo ne c la ss Zo ne C la ss if ic at io n MP A in de x MP A C la ss if ic at io n Ar ea k m 2
Azo01 1 PMA06 2011 5 5 0 2 4 Highly regulated extraction 4.0 Highly protected 2689.2
Azo02 1 PMA07 2011 5 5 0 2 4 Highly regulated extraction 4.0 Highly protected 2607.0
Azo03 1 PMA05 2011 4 5 0 2 4 Highly regulated extraction 4.0 Highly protected 4093.1
Azo04 1 PMA14 2016 2 5 0 1 4 Highly regulated extraction 4.0 Highly protected 242.0
Azo05 2 PMA01 2011 4 5 0 2 4 Highly regulated extraction 5.0 Highly protected 16.2
Azo05 2 PMA11 2011 7 5 0 2 5 Moderately regulated extraction 5.0 Highly protected 329.8
Azo06 1 PMA15 2016 7 5 0 2 5 Moderately regulated extraction 5.0 Highly protected 369.7
Azo07 3 PMA02 2011 4 5 0 2 4 Highly regulated extraction 4.9 Highly protected 265.4
Azo07 3 PMA03 2011 4 5 0 2 4 Highly regulated extraction 4.9 Highly protected 302.1
Azo07 3 PMA13 - EEZ 2016 6 5 0 2 5 Moderately regulated extraction 4.9 Highly protected 8591.7
Azo08 1 PMA12 - EEZ 2016 6 5 0 2 5 Moderately regulated extraction 5.0 Highly protected 13620.4
Azo09 4 COR02 2008 9 6 2 2 6 Weakly regulated extraction 6.0 Moderately protected 249.8
Azo09 4 COR02-COR(A) 2008 9 6 0 2 5 Moderately regulated extraction 6.0 Moderately protected 2.2
Azo09 4 COR02-COR(B) 2008 9 6 2 2 6 Weakly regulated extraction 6.0 Moderately protected 3.5
Azo09 4 COR02-COR(C) 2008 9 6 0 2 5 Moderately regulated extraction 6.0 Moderately protected 2.5
Azo10 4 FLO(A) 2014 9 6 0 2 5 Moderately regulated extraction 5.0 Highly protected 13.4
Azo10 4 FLO09 2011 9 6 0 2 5 Moderately regulated extraction 5.0 Highly protected 14.2
Azo10 4 FLO09-FLO(A) 2011 9 6 0 2 5 Moderately regulated extraction 5.0 Highly protected 6.3
Azo10 4 FLO09-FLO(B) 2011 9 6 0 2 5 Moderately regulated extraction 5.0 Highly protected 19.3
Azo11 2 FLO(C) 2014 9 6 2 2 6 Weakly regulated extraction 6.0 Moderately protected 17.2
Azo11 2 FLO(C)-PASS 2014 0 0 0 1 2 No-take/Regulated access 6.0 Moderately protected 0.2
Azo12 1 GRA08-GRA(A) 2014 7 6 0 2 5 Moderately regulated extraction 5.0 Highly protected 2.8
Azo14 3 GRA(B)-AREPZMIG(IP) 2014 3 5 0 2 4 Highly regulated extraction 4.7 Highly protected 0.3
Azo14 3 GRA02-GRA(B)-AREPZMIG(IP) 2008 3 5 0 2 4 Highly regulated extraction 4.7 Highly protected 2.1
Azo15 3 GRA(C) 2014 9 6 0 2 5 Moderately regulated extraction 4.1 Highly protected 1.9
Azo15 3 GRA01-GRA(C)-AREPZMIG(IB) 2008 3 5 0 2 4 Highly regulated extraction 4.1 Highly protected 1.3
Azo15 3 GRA07-GRA(C) 2008 0 0 0 2 3 No-take/Unregulated access 4.1 Highly protected 1.4
Azo16 1 GRA(D) 2014 9 6 0 2 5 Moderately regulated extraction 5.0 Highly protected 1.0
Azo17 2 SJO(A) 2014 9 6 0 2 5 Moderately regulated extraction 5.0 Highly protected 0.1
Azo17 2 SJO10-SJO(A) 2011 9 6 0 2 5 Moderately regulated extraction 5.0 Highly protected 2.1
Azo18 1 SJO11-SJO(D) 2011 9 6 0 2 5 Moderately regulated extraction 5.0 Highly protected 2.5
Azo19 1 SJO12-SJO(B) 2011 9 6 0 2 5 Moderately regulated extraction 5.0 Highly protected 8.7
Azo20 2 SJO(C) 2014 9 6 0 2 5 Moderately regulated extraction 5.0 Highly protected 5.9
Azo20 2 SJO13-SJO(C) 2011 9 6 0 2 5 Moderately regulated extraction 5.0 Highly protected 6.0
Azo21 1 FAI13-FAI(B) 2008 8 6 0 2 5 Moderately regulated extraction 5.0 Highly protected 8.9
Azo22 1 FAI12-FAI(A) 2008 8 6 0 2 5 Moderately regulated extraction 5.0 Highly protected 5.0
Azo23 2 FAI(D) 2014 9 6 2 2 6 Weakly regulated extraction 5.4 Moderately protected 0.8
Azo23 2 FAI11-FAI(D) 2008 8 6 0 2 5 Moderately regulated extraction 5.4 Moderately protected 1.3
Azo24 10 FAI01-FAI(C)-AREPZMIFP(MG) 1980 0 0 0 0 1 No-take/No-go 5.7 Moderately protected 0.1
Azo24 10 FAI10 2008 9 6 2 2 6 Weakly regulated extraction 5.7 Moderately protected 154.8
Azo24 10 FAI10-FAI(C) 2008 9 6 2 2 6 Weakly regulated extraction 5.7 Moderately protected 16.5
Azo24 10 FAI10-FAI(C)-AREPZMIFP(MG) 2008 3 5 0 2 4 Highly regulated extraction 5.7 Moderately protected 2.2
Azo24 10 PIC(A) 2014 9 6 0 2 5 Moderately regulated extraction 5.7 Moderately protected 11.7
Azo24 10 PICO(22) 2008 9 6 0 2 5 Moderately regulated extraction 5.7 Moderately protected 30.5
Azo24 10 PICO22-PIC(A) 2008 9 6 0 2 5 Moderately regulated extraction 5.7 Moderately protected 32.8
Azo24 10 PICO22-PIC(A)-AREPZMIFP(BB) 2008 0 0 0 2 3 No-take/Unregulated access 5.7 Moderately protected 1.0
Azo24 10 PICO22-PIC(A)-AREPZMIFP(IM) 2008 3 5 0 2 4 Highly regulated extraction 5.7 Moderately protected 2.4
Azo24 10 PICO22-PIC(A)-AREPZMIFP(IM)-PASBC 2008 1 5 0 1 4 Highly regulated extraction 5.7 Moderately protected 0.1
Azo25 1 PIC(B) 2014 9 6 0 2 5 Moderately regulated extraction 5.0 Highly protected 9.3
Azo26 1 PICO21-PIC(C) 2008 9 6 0 2 5 Moderately regulated extraction 5.0 Highly protected 6.0
Azo27 2 PIC(D) 2014 9 6 2 2 6 Weakly regulated extraction 5.9 Moderately protected 14.1
Azo27 2 PICO20-PIC(D) 2008 9 6 0 2 5 Moderately regulated extraction 5.9 Moderately protected 1.5
Azo28 1 TER(A) 2014 9 6 0 2 5 Moderately regulated extraction 5.0 Highly protected 27.7
Azo29 5 TER(B) 2014 9 6 0 2 5 Moderately regulated extraction 4.9 Highly protected 42.7
Azo29 5 TER(B)-AREPZM(QR) 2018 2 5 0 2 4 Highly regulated extraction 4.9 Highly protected 2.6
Azo29 5 TER15-TER(B) 2011 9 6 0 2 5 Moderately regulated extraction 4.9 Highly protected 1.8