2211, Page 1
Experimental and Numeric Quantitative Evaluation of Thermal Performance in
Refrigerated Display Cabinets with Variation of Air Curtain Thickness and Porosity of the
Back Panel
Samuel M. NASCIMENTO
1, Gustavo G. HEIDINGER
1, Pedro D. GASPAR
2,*, Pedro D. SILVA
2 1Eletrofrio Refrigeração Ltda, r João Chede, 1599, Cidade Industrial,
Curitiba - PR, 81170-220, Brazil,
+55 (41) 2105-6097, [email protected]; [email protected]
2
University of Beira Interior, Engineering Faculty, Dept. of Electromechanical Engineering,
Rua Marquês d’Ávila e Bolama, 6201-001, Covilhã, Portugal,
+351 275 329 759, * [email protected]; [email protected]
* Corresponding Author
ABSTRACT
Open multideck display cabinets are widely used to expose perishable products in supermarkets and convenience stores. This paper reports the results of experimental tests performed according to ISO23953 in an open multideck refrigerated display cabinet to assess the impact on the thermal performance by varying the width of the discharge air grille and the perforation density of the back panel. The experimental laboratory tests were conducted for climate class n.° 3 (25° C and 60%). The results evaluation shows that the perforation density of the back panel and the width of discharge air grille alter significantly the thermal entrainment factor and the energy consumption of the equipment. The best performance configuration showed a 10% reduction of the cooling load. The analysis of the results provides valuable information for the development of these equipments.
1. INTRODUCTION
Since ancient times, man has the need and the will of obtaining cooling ways that make the temperature of foods products to reach a value below the environmental temperature in order to preserve them for longer periods. The perishable food products, from production to the final consumer, are preserved and channeled through the system named as cold chain. According to Rigot (1991), the cold chain can be described by five main links: Cold in the production stage; Cold during storage, Refrigerated transportation; Cold in the distribution stage; Home cooling. The fourth link in the cold chain, which is the subject of this paper, is commonly referred as commercial refrigeration by being placed at the trade level. ASHRAE (2010) indicates that the percentage of energy consumed in a typical supermarket due to the refrigeration systems reaches 50%. Compressors, refrigerated display cabinets, walk-ins and condensers consume this energy. Among the refrigerated display cabinets installed in a supermarket, which consumes more energy are of the vertical and open type. According to Faramarzi (1999), ASHRAE (2010) and Gaspar et al. (2011), the thermal load due to ambient air infiltration to a vertical open refrigerated display cabinet (VORDC) corresponds respectively to 67% - 77%, 73.5% and 78% - 81% of the total thermal load. This condition results from the low efficiency of the curtain air, which forms a physical barrier between the internal and external environments of the equipment.
The work developed by various researchers has focused, for this type of equipment, in qualifying and quantifying the perceptible thermo-physical properties of the jet that provides a cold air curtain. Hayes & Stoecker (1969) developed a correlation that describes the ability of the air curtain to provide a proper separation between environments. The correlation is given by a dimensionless parameter named as deflection modulus, Dm, which is the ratio between the air curtain momentum and the modulus of the transverse forces caused by temperature difference between the contiguous environments. Faramarzi (1999) determined the relative weight of the total cooling load components for
2211, Page 2
VORDC, composed by the loads from infiltration, radiation, conduction, product pull-down cooling, devices (lights and fans), defrost and anti-sweat heaters, and product respiration. According to EN-ISO 23953 (2005), the total thermal cooling load can be determined by eq. (1).𝑄̇𝑡𝑜𝑡 = 𝑚̇𝑟𝑒𝑓∙ ∆𝑖 (1)
Chen et al. (2005, 2009, 2011) developed studies using Computational Fluid Dynamics (CFD) codes to evaluate the thermo-physical parameters of the air curtain in the VORDC. The performance of air curtain was evaluated by the following dimensionless numbers/parameters: Reynolds number, Grashof number, Richardson number and dimensionless temperature, given by eq. (2) to eq. (5) respectively, for different aspect ratios (height/width) of the air curtain. 𝑅𝑒 = (𝑢∙𝑏 𝜈 )𝐷𝐴𝐺 (2) 𝐺𝑟 =𝑔𝜉(𝑇𝑎𝑚𝑏−𝑇𝐷𝐴𝐺)𝐻3 𝜈𝐷𝐴𝐺2 (3) 𝑅𝑖 = 𝐺𝑟 𝑅𝑒2 (4) 𝑋𝑗= 𝑇𝑅𝐴𝐺−𝑇𝐷𝐴𝐺 𝑇𝐴𝑚𝑏−𝑇𝐷𝐴𝐺 (5)
The results provided the following conclusions: There is a range of values of Reynolds number quantifying the flow that can be reduced by reducing the height/width ratio of the air jet for optimal thermal insulation developed by the cold air curtain jet; As the Grashof number provides the fluctuation proportion of the buoyancy force that acts on a viscous fluid in situations involving heat transfer by natural convection while the Richardson number provides the information on the influence of natural convection in relation to forced convection, it is possible to use them for describe the flow. Thus, it can be stated that air curtains with small height/width ratio provide a good thermal performance. Navaz et al. (2005) developed further studies using Digital Particle Image Velocimetry (DPIV), focusing mainly in studying the effectiveness of the curtain and maintaining the temperature of food products to a predetermined value. The results evaluation indicates that the Reynolds number has direct effect on the ambient air entrainment into the refrigerated equipment due to its role in the turbulence development. According to Navaz et al. (2005), the best range of values for the Reynolds number in the discharge air grille (DAG) is about 3200-3400. In that study, the authors defined the Thermal Entrainment Factor, TEF, to quantify the thermal entrainment of the air curtain with the ambient air, varying 0 < TEF < 1.
The analysis to the correlation shows that as closer to 0 is TEF, lower is the thermal entrainment with the ambient air. The correlation described by Navaz et al. (2005) does not take into account the air flow through the perforated back panel (PBP). Yu et al. (2009) developed the TEF equation considering this air flow. The new correlation is given by eq. (6) to eq. (8) including the dimensionless temperature given by eq. (5).
TEF = (1 − 𝛽)𝑋𝑗− 𝛽𝑋𝑗𝑋𝑃𝐵𝑃 (6) 𝛽 = 𝑚̇𝑃𝐵𝑃 𝑚̇𝑃𝐵𝑃+𝑚̇𝐷𝐴𝐺 (7) 𝑋𝑃𝐵𝑃= 𝑇𝑃𝐵𝑃−𝑇𝐷𝐴𝐺 𝑇𝐴𝑚𝑏−𝑇𝐷𝐴𝐺 (8)
The results obtained by Yu et al. (2009) show a good approximation for TEF and temperature value at the return air grille (RAG) with deviations of 0.9% and 0.1 °C respectively. These deviations indicate that the correlation has a good approximation at the engineering level and can be applied in the design of VORDC. Gaspar et al. (2009, 2010, 2011) evaluated the stability of the air curtain for climatic classes n.º 1, n.º 2 and n.º 3 according to EN-ISO 23953 (2005) and other classes beyond the standard. The evaluation was made by experimental testing and numerically using CFD models. The results showed that the VORDC performance strongly depends on the ambient air conditions such as temperature, humidity, velocity and direction of ambient air flow in relation to the VORDC's frontal opening. These authors showed that (1) the cooling load increases with the air temperature and relative humidity of the external environment, (2) the increase of the ambient air velocity increases more significantly the power consumption of the ORDC than the airflow direction change from parallel to perpendicular in relation the frontal opening of the ORDC,
2211, Page 3
(3) the magnitude of deflection modulus Dm related with minimum momentum required to maintain a stable curtain of air is between 0.12 and 0.25; (4) the cooling load due to air infiltration is 78% - 81%, which is range closer to the value obtained by Faramarzi (1999) which is of 73.5%, and (5) TEF is not constant along the equipment length for parallel air flow. Furthermore, the TEF value increases when the ambient air flow goes from parallel to perpendicular, being the worst case for θamb = 45°. In the case study, TEF = 0.25, 0.32, 0.3 for θamb = 0°, 45°, 90° respectively. Laguerre et al. (2012) developed a simplified analytical model based on heat transfer equations to determine the values of air and product temperatures at various locations of a VORDC. The heat gain by radiation is more significant for products located on the front (top and bottom) and the heat gain by air infiltration is more significant for the products located in the rear (front and rear). Cao et al. (2010, 2011) developed a new strategy for conception and optimization in the air curtains design for vertical ORDC. The strategy is based on the heat transfer model between two fluids (two-fluid of cooling loss - CLTF) developed based on a Support Vector Machine (SVM) algorithm.Some researchers have advanced the development of VORDC with the aid of computer codes. For simulation of the heat and mass transfer in these systems, one of the most popular and accepted computational methods among users is the Computational Fluid Dynamics (CFD). There have been many examples where the comparison of numerical and experimental results shows a small difference. The prediction of laminar and turbulent flows of various problems involving heat and mass transfer by the iterative resolution of the conservation equations of mass, momentum and energy, has been widely used in Heating, Ventilation, Air Conditioning & Refrigerating (HVAC&R) for presenting suitable mathematical modeling techniques to simulate the flow and the thermal behavior. The experimental and numerical studies involving heat and mass transfers are constantly subject to errors due to numerous variables that involve the system under study and that are not possible to be quantified accurately, by either physical limitations or cost of measuring equipment and/or limitation regarding the solution of differential equations with partial derivatives that govern the physical phenomena. Therefore, a number of simplifications in the numerical models are often necessary to reduce the hardware requirements and time that may lead to numerical predictions with some deviations from the actual thermos-physical phenomenon. However, CFD technique has become an analysis tool that allows replacement or support tests on prototypes, being appropriate in efficient design solutions with a lower cost. Overall, the features and benefits of applying CFD techniques to HVAC&R systems lead to the development of unique models, the analysis of various phenomena at a lower cost, the ability to predict results in any location, answered failure questions, to determine incomes and promote faster implementation of projects with lower cost, on the basis that the model results are close to reality. The numerical work focused on refrigerated display cabinets has been performed with several models, vertical and horizontal, open and closed, and, most studies are focused on equipment of the vertical open type by energy issues. Most of the work done in CFD aims to evaluate flow and heat details, compare with experimental results and achieve improvements in a specific equipment.
From the published studies, Gaspar et al. (2007) describes in detail the numerical model used to evaluate the influence of the fixed pressure boundary conditions to simulate the ambient air in VORDC. They concluded that the fixed pressure should be fixed, at least, at 3/2*L from the frontal opening of VORDC, for deviations of 1.3% with respect to the temperature values obtained in the experimental tests. In another study, Gaspar et al. (2010) evaluated the influence of the angle of incidence (amb = 0º; 45º and 90º) of the test room ventilation on the overall performance of the VORDC. George & Buttsworth (2000) performed studies in a VORDC with two evaporators and a discharge air grill with vanes. The numerical model was solved for in a 2D mesh, in steady state for two flow conditions, laminar and turbulent (k-ε). The numerical results showed that the turbulent simulation was more accurate than the laminar simulation. However, the air temperature in the return air grille (RAG) and heat loads presented discrepancy in both the cases comparing with the experimental results. This can be attributed to the two-dimension consideration or to wrong boundary conditions definition. Nevertheless, they observed that in some places the actual flow is transitional. D'Agaro et al. (2006) developed simulations in CFD to evaluate a VORDC with three air curtain jets. The three layers of the air curtain are able to protect a compartment to exhibit frozen food with a temperature of -18 °C. The authors demonstrate some comparison of results obtained with 2D and 3D CFD models, and perform a qualitative assessment of results obtained with k-ε and RNG k-ε turbulence models. The results of the 2D model disagree with the experimental results due to the incapacity to predict the effects of the secondary vortices on the lateral walls side due to lateral air flow. Moureh & Yataghene (2016) experimentally and numerically investigate the aerodynamic behavior and the effectiveness of an air curtain confining cavity and subjected to external lateral stream. Experiments were carried out on a scale down model (1:5) representing a generic configuration of a VORDC, using LDV and PIV techniques to investigate the air flow characteristics. A CFD model was developed to better understand the local air flow characteristics. A good agreement was obtained between the CFD model with RSM turbulence model and experimental results. Comparisons of experimental and numerical data obtained with and without external perturbation allowed quantifying the effect of the perturbation on the air curtain characteristics. It was showed that for higher values
2211, Page 4
of external lateral velocity, the performance of the air curtain was reduced consequently, as already described by Gaspar et al. (2011).This paper aims to contribute to studies on the thermal performance of VORDC, showing and evaluating the experimental results and numerical of the relation between the porosity of PBP and the GDA width on the overall performance of the VORDC.
3. COMPUTATIONAL MODEL
This paper presents a comparative study between the numerical and experimental results. Thus, based on experimental tests developed by Nascimento et al. (2015), a CFD model was developed and a methodology for its improvement was applied. This procedure assessed the influence of characteristics of the mathematical model, description of physical phenomena and of the numerical model that characterizes the iterative procedure of resolution. Various optimization studies of the model were performed to analyze the influence of the CFD code; the dependence of the refinement of the computational mesh; of the discretization scheme of the convective terms in the transport equations and the dependence of the turbulence model (Gaspar & Pitarma, 2004). It is clear that the numerical predictions are affected by these factors. The computer simulation based on mathematical modeling of flow with heat transfer inside the VORDC is described by differential equations of conservation of mass, of the momentum and of energy (Ferziger & Peric, 2002). Considering the end effects in relation to the length of the simulated equipment, a three dimensional model is developed, wherein the turbulent flow is non-isothermal and the heat transfer process are considered in steady state. The air is considered as an ideal gas, incompressible but dilatable and with constant properties. To account for the density variation, the term representative of the buoyancy effect was added to the vertical component of the equations of momentum conservation. It is used the equation of state of ideal gases to evaluate the variation of density with temperature gradients in the flow. The energy equation is developed for the temperature, given the absence of internal heat generation and neglecting the term of viscous dissipation due to flow characteristics. In the mathematical modeling is considered SST k-ω turbulence model, as it is more precise and reliable model for a broader class flows. The mathematical and numerical models for the simulation of physical phenomena that are intended to represent and the corresponding resolution procedure are implemented in the CFD code - Fluent with a three-dimensional computational tetrahedral unstructured grid generated by the Pave algorithm. The CFD code solves the discretized differential equations according to upwind differencing methods, UDS - Upwind Differencing Scheme, (Karki & Patankar, 1989), and MUSCL - Monotone Upstream-Centered Schemes Laws for Conservation (Van Leer, 1979), by the method of finite differences - control volume formulation as defined by Patankar (1980). The use of discretization methods of different orders aims to increase the global convergence and accuracy of the results. The choice of discretization methods for each variable was carried out after analysis of the convergence of a series of preliminary numerical resolutions. The PISO algorithm solves the algebraic system of finite differences equations according to an iterative numerical method for the computational mesh. The pressure interpolation method used is PRESTO!. The models were processed by a HP Z280 Workstation with Intel(R) Xeon(R) CPU E5-2640 v2 @2.00GHz with 16GB of RAM.
The boundary conditions (BC) imposed in the models are as follows:
(1) isothermal walls with the prescribed temperature value obtained experimentally;
(2) imposition of the values of velocity, temperature, kinetic energy and its dissipation rate in the mass inputs and outputs;
(3) uniformly distributed flow rate to simulate the dissipation heat generated by the lighting of the VORDC;
(4) constant pressure for the opening of the VORDC to ambient air, wherein the flow direction is determined in each surface control volume (CV) depending on the pressure difference.
Taking into consideration that the variation in density will cause pressure differences requiring the direction of flow into the VORDC and considering the climate condition n.º 3 shown in standard 23953 (2005), (Tamb = 25 °; amb = 60%), the temperature of ambient air is 25 °C. It is important to note that all re-entry quantities in the computational domain were specified as normal to the boundary condition. The BC4 is very likely to cause convergence difficulties due to the mass fluctuations at the inputs and outputs. the following parameters are imposed in BC4:
- Static pressure - relative pressure, p0 = 0 Pa;
- Return temperature - Ambient temperature, Tamb = 25 °C;
The condition imposed on the turbulence intensity, the most unfavorable, intends to incorporate the effects of turbulence resulting from the passage of consumers in front of the VORDC, influence of discharge velocity of air conditioning system and the influence of other equipment in the vicinity.
2211, Page 5
All simulations ran on in steady state. Radiation Discrete ordinates (DO) and Species Transport models were considered to take into account heat load due to thermal radiation and the influence of water vapor in the heat and mass transfer phenomena. 4000 iterations were set for the iterative procedure. The residuals were stable and constant at the end of the iterative process. Each simulation was completed in 6 hours, for a total simulation time of 48 hours.Figure 1: Three dimensional model of the VORDC.
3. EXPERIMENTAL STUDY
3.1 Experimental apparatus
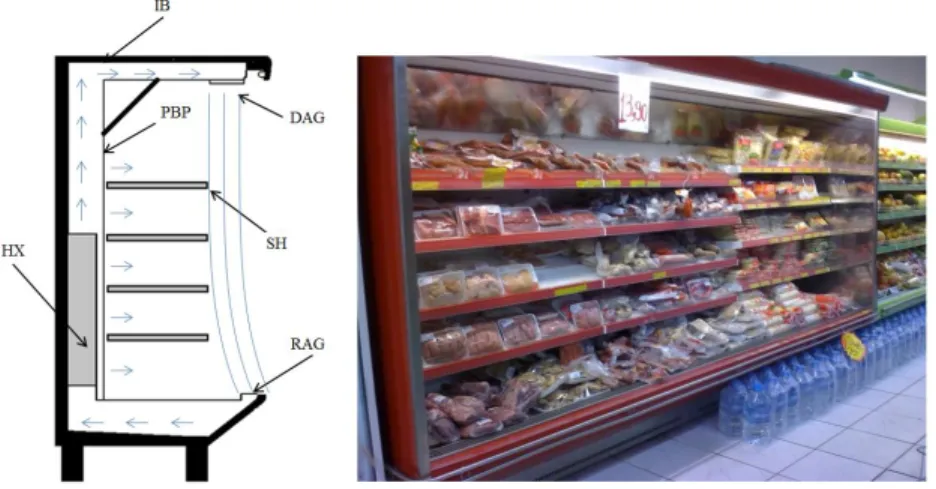
The VORDC provided by Eletrofrio Refrigeration LTDA - Brazil has 2.5x1.1x2.1 m3. It comprises (1) an insulating body (IB) surrounding all the equipment; (2) tube and fins heat exchanger (HX); (3) discharge air grille (DAG); (4) return air grille (RAG); (5) perforated back panel (PBP) and shelves (SH) as shown in Fig. 2. The temperature of the refrigerated compartment is provided by the cold air mass flow that exits DAG and PBP and returns to RAG to be cooled again in the HX. The air flow exiting DAG forms an air curtain which protects the inner refrigerated compartment. Note that this equipment has a primary air curtain (PAC) and a secondary air curtain (SAC) in order to promote a more effective aerothermodynamics sealing.
Figure 2: Vertical open refrigerated display cabinet.
The device has four fans with 53 W each to supply a flow rate of 0.4 m3.s-1 to DAG and PBP. The air, before reaching the DAG, passes through an evaporator with dimensions 2.20x0.13x0.35 m3 constituted by 222 fins and three rows of tubes in the air flow direction and 8 rows of tubes perpendicular to it. The DAG has a total width, b, of 140 mm, which is equally distributed to form the PAC (bPAC = 90 mm) and SAC (bSAC = 60 mm). This equipment is used to display products with temperature class M1 (-1 °C to +5 °C). It was installed a remote mechanical system with a compressor
2211, Page 6
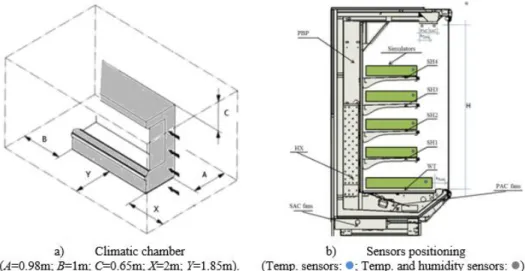
Octagon 2DC-3.2 and water condenser. The measuring instruments were selected in order to obtain reliable measurements of the relevant physical properties variation collected every minute during the experimental test. The experimental tests (ET) followed EN ISO 23953 (2005) and were performed in a climatic chamber designed in accordance as shown in Figure 3: Climatic chamber and sensors location on the VORDC.a. Figure 3: Climatic chamber and sensors location on the VORDC.
b shows the middle section of the VORDC. Temperature and humidity sensors Super MT 530 were placed in DAG, RAG and ambient. Temperature sensors type PT1000 were placed in the test packages (product simulators). A Coriolis flowmeter MASSFLO 2100 DI 6 was installed at the liquid refrigerant line. Table 1 shows the experimental techniques and probes/experimental measuring devices used to collect the relevant physical properties.
Figure 3: Climatic chamber and sensors location on the VORDC. Table 1: Experimental techniques and probes/experimental measuring devices.
Experimental technique Model Measuring range Accuracy
Thermometry PT 1000 -40°C to +80°C ± 0.3 °C
MT 530 Super -10°C to 70°C ± 1.5 °C
Hygrometry MT 530 Super 20% to 85% ± 5%
Anemometry HTA 4200 0,3 m.s-1 to 34 m.s-1 ± 1%
Flowmetry MASSFLO 2100 0 to 1000 kg.h-1 0.1%
Barometry AKS 32 0 to 200 psig ± 0.3%
3.2 Experimental testing procedure
Experimental tests (ET) were performed for initial evaluation of the VORDC. The PBP airflow ratio, β, is calculated by eq. (7) considering constant air density. The characteristic length of DAG influences the TEF and overall energy consumption. Thus, tests were conducted to four different levels of total air flow, i.e. to four different levels of mass air flow distributed by the DAGPAC and PBP (𝑚̇ = 𝑚̇PAC + 𝑚̇PBP). The control of the system is provided by a
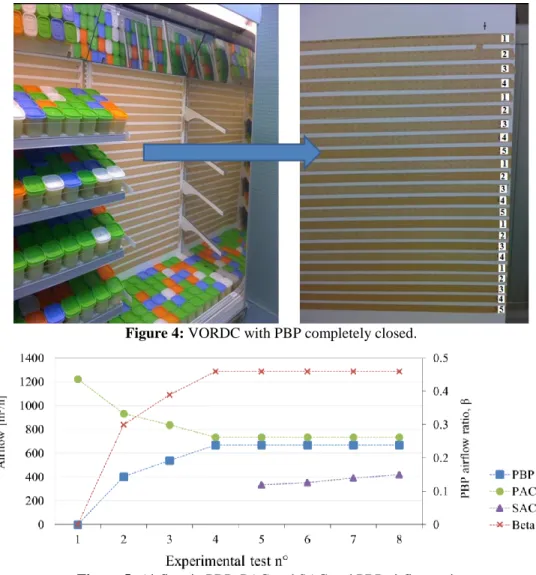
frequency inverter connected to the fans of DAGPAC. After identifying the best configuration for the PBP distribution i.e. its porosity, the fans of DAGSAC were also connected. With this procedure, the air curtain thickness was doubled. The air velocity in DAGSAC outlet was modulated to five different levels via control of the frequency inverter connected to the fans of DAGSAC. The PBP was initially closed with tape as shown in Fig. 4 for the first four tests (ET1 to ET4). The tapes were partially withdrawn at each series of ET. The tapes were taken by its numerical order (as shown in Fig. 4) to obtain a better distribution of air over the shelves. The procedure consists in firstly to take out all tapes n.º 1, then take out also the tapes with n.º 2, and so on. After identifying the best configuration for β, DAG width was increased from bPAC = 70 mm to bPAC+SAC = 140 mm for ET5 to ET8.
The air velocity in DAG (PAC and SAC), RAG and PBP were measured with the propeller type anemometer model HTA4200 in twelve points along the opening perpendicular to flow. These values are shown in Fig. 5 in the form of air flow rate for each ET. This figure also includes the value of β for each ET.
2211, Page 7
Figure 4: VORDC with PBP completely closed.
Figure 5: Airflow in PBP, PAC and SAC and PBP airflow ratio.
4. RESULTS ANALYSIS AND DISCUSSION
With the experimental results it was possible to adjust the VORDC and obtain a 10% reduction of energy consumption compared to commercial equipment (given by ET4). The criteria for evaluating the performance of the ORDC was, (1) lowest TEF, (2) test packages temperature below 5 °C, and (3) lowest cooling load.
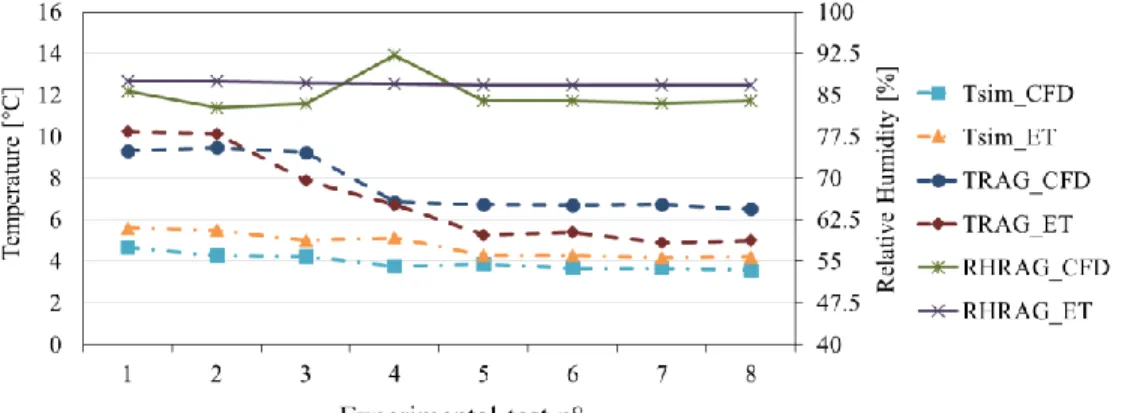
The air temperature and humidity values obtained in the carried out ET (ET1 to ET8) are shown in Fig. 6.The test results (ET1 the ET8), showed that: (1) there is an optimal value for β, (2) increasing the DAG thickness reduces TEF and the cooling load. The values of TEF, total cooling load (Qtot) and the average and maximum test packages temperatures (Tsim) for the ET are shown in Fig. 6. The maximum value of test packages temperature is measured in the well tray for all ET. Qtot values were determined by eq. (1) whereas the TEF values were determined by eq. (5) to eq. (8). Fig. 6 shows the comparison of numerical and experimental results. The trends are very similar. The average relative error in the temperature is 11% and 17% in the product simulators and RAG respectively. The average relative error in the relative humidity prediction in the RAG is 2%. Fig. 7 shows the comparison of the total heat load and TEF of experimental tests and CFD models. Although the result show a similar trend, the average relative error of the total heat load was 23% while the relative error of TEF was only 9%. In Fig. 7 it is possible to see that the air curtain efficiency is a relevant factor to reduce energy consumption and maintenance of product temperature. An efficient sealing ability provided by DAG can be identified by analyzing the TEF values. In order to obtain more efficient VORDC considering the previously defined evaluation criteria (lowest TEF, Qtot and Tsim), without making major changes in the current design, the best configuration shown in Fig. 7 is given by ET7, where β = 0.46, considering VPAC = 734 m3.h-1, VSAC = 391 m3.h-1 and VPBP = 669 m3.h-1. The mass flows on other ET are different due to the different pressure drop caused in the different configurations.
2211, Page 8
Figure 6: Comparison of temperature and relative humidity values of experimental tests and CFD models.
Figure 7: Comparison of Qtot and TEF of experimental tests and CFD models.
The air velocity in DAG, RAG e β for each ET is shown in Fig. 8. In ET7 was obtained a uDAG = 0.92 m.s-1. Gaspar et al. (2011) determined the best performance at uDAG = 1.5 m.s-1, Cao et al. (2011) obtained the best performance at uDAG = 0.8 m.s-1 to 1 m.s-1, while Yu et al. (2009) found an optimum DAG velocity from uDAG = 0.7 m.s-1 to 0.8 m.s-1. Comparing the results with these obtained by other authors, we can be stated that the optimal DAG velocity depends on the physical characteristic of the air curtain and the PBP airflow ratio, so for every height/width ratio exists an optimum value for the DAG velocity. With the experimental study, it was possible to adjust this particular VORDC and improve its performance by reducing 10% the energy consumption (ET7) as compared to commercial design (ET4).
2211, Page 9
5. CONCLUSIONS
This paper includes an optimization technique for VORDC based on experimental tests and numerical models. This is a test method of great value to industry because it describes the experimental studies measuring the thermo-physical parameters to quantify the air curtain flow. Additionally, the use of CFD allows evaluating particular designs and the variation of parameters. With the combined analysis it was possible to identify a value for the airflow rate and its distribution between the PBP and DAG that provides a design with better performance. The optimum values are given by uPAC = 0.92 m.s-1; uSAC = 0.72 m.s-1; uRAG = 2.22 m.s-1; bDAG = 140 mm; and β = 0.46. With the development of this work, it is evident the fact that for each type of VORDC with a height/width ratio different from the model where presented, there are optimum values for β and DAG and RAG velocities. Further CFD models will be developed, both in steady and transient states to provide new directions for the development and innovation of the equipment.
NOMENCLATURE
b air curtain width (m)
g Gravitational accelerations (m.s-1)
Gr Grashof number (-)
H Air curtain height (m)
i enthalpy (J.kg-1)
𝑚̇ Mass flow rate (kg.h-1)
𝑄̇ Thermal power (W) Re Reynolds number (-) Ri Richardson number (-) RH Relative humidity (%) T Temperature (K) u Velocity (m.s-1) V Airflow rate (m3/h) X Dimensionless temperature (-) Abbreviation
CFD Computational fluid Dynamics DAG Discharge Air Grille
RAG Return Air Grille
PBP Perforated Back Panel TEF Thermal Entrainment Factor
PAC Primary Air Curtain
SAC Secondary Air Curtain
Greek symbols
𝜃 Airflow direction ( º )
ν Kinematic viscosity (m².s-1)
ξ Thermal expansion coefficient (K-1)
β Back panel airflow ratio (-)
Subscripts
amb ambient
DAG Discharge air grille ET Experimental test HX Heat exchanger PAC Primary Air RAG Return air grille SAC Secondary Air
SH Shelve
sim simulator tot total
2211, Page 10
REFERENCES
ASHRAE. (2010). ASHRAE Handbook: Refrigeration. Atlanta, Ga: American Society of Heating, Refrigerating and Air Conditioning Engineers (ASHRAE).
Carneiro, R., Gaspar, P.D., & Silva, P.D. (2015). 3D transient CFD modeling of sliding door operation and its influence on the thermal performance of cold rooms. Proc. of the 24th IIR Int. Congress of Refrigeration (ICR2015), IIR, Yokohama, Japan. Cao, Z., Gu, B. Mills, G., & Han, H. (2010). A novel strategy for predicting the performance of apen vertical refrigerated display cabinets based on the MTF model and ASVM algorithm. Int. J. Refrig. 33(7), 1413-1424.
Cao, Z., Gu, B. Mills, G., & Han, H. (2010). Application of an effective strategy for optimizing the design of air curtains for open vertical refrigerated display case. Int. J. Therm. Sci. 49(6), 976-983.
Cao, Z., Gu, G., Han, & H. (2011). A novel optimization strategy for the design of air curtains for open vertical refrigerated display cases. Appl. Therm. Eng. 31(16), pp. 3098–3105.
Chen, Y., & Yuan, X.-L. (2005). Simulation of a cavity insulated by a vertical single band cold air curtain. Energ. Convers. Manage. 46(11-12), 1745-1756.
Chen, Y. (2009). Parametric evaluation of refrigerated air curtains for thermal insulation. Int. J. Therm. Sci. 48(10), 1988-1996. Chen, Y., & Xia, D.H. (2011). The flow characteristics analyses of refrigerated air curtains in multi-deck display cabinets. Proceedings of the International Congress of Refrigeration, 23rd ed., Prague, Czech Republic: IIF/IIR.
D'Agaro, P., Cortella, G., & Croce, G. (2006). Two- and threedimensional CFD applied to vertical display cabinets simulation. International Journal of Refrigeration 29(2), 178-190.
Faramarzi, R. (1999). Efficient display case refrigeration. ASHRAE Journal 41(11), 46–52.
Foster, A.M., Madge, M., & Evans, J.A. (2005). The use of CFD to improve the performance of a chilled multi-deck retail display cabinet. International Journal of Refrigeration, 28(5), 698–705.
Ferziger, J.H., & Perić, M. (2002). Computational methods for fluid dynamics, 3rd ed. Springer, Berlin, Germany. Entrainment by a Refrigerated Air Curtain Down a Wall
George, B.N., & Buttsworth, D.R. (2000). Investigation of an open refrigeration cabinet using computational simulations with supporting experiments. Proc. of the 2000 ASME Int. Mech. Eng. Congress and Exposition, Orlando, Fla, USA.
Gaspar, P.D., & Pitarma, R.A. (2004). Simulação de equipamento industrial de refrigeração: estudo de caso. Proc. of the VI Congresso de Métodos Computacionais em Engenharia, Lisboa.
Gaspar et al. (2007). Influência da localização da condição de fronteira de pressão fixa e constante na simulação de aberturas ao ar ambiente. Proc. of the CMNE/CILAMCE, Porto, Portugal.
Gaspar, P.D., Gonçalves, L.C.C., & Vogeli, A. (2009). Dependency of air curtain performance on discharge air velocity (grille and back panel) in open refrigerated display cabinets. Proceedings of the ASME International Mechanical Engineering Congress and Exposition, Lake Buena Vista, Florida, U.S.A: ASME.
Gaspar, P.D., Gonçalves, L.C.C., & Ge, X. (2010). CFD parametric study of ambient air velocity magnitude influence in thermal behaviour of open refrigerated display cabinets. Proc. of the 5th Euro. Conf. on CFD (ECCOMAS CFD 2010), Lisbon, Portugal. Gaspar, P.D., Gonçalves, L.C.C., & Ge, X. (2010). Influence of ambient air velocity orientation in thermal behaviour of open refrigerated display cabinets. Proc. of the ASME 2010 10th Biennial Conference on Engineering Systems Design and Analysis ESDA 2010 (ASME ESDA 2010), Istanbul, Turkey, July: ASME.
Gaspar, P.D., Gonçalves, L.C.C., & Pitarma, R.A. (2011). Análise Experimental da estabilidade de cortinas de ar de equipamentos de refrigeração para diferentes condições do ar ambiente, Proc. of the Int. Conf. on Engineering (UBI 2011), Covilhã, Portugal. Gaspar, P.D., Gonçalves, L.C.C., & Pitarma, R.A. (2011). Experimental analysis of the thermal entrainment factor of air curtains in vertical open display cabinets for different ambient air conditions. Appl. Therm. Eng. 31(5), 961–969.
Karki, K.C., & Patankar, S.V. (1989). Pressure-based calculation procedure for viscous flows at all speeds in arbitrary configurations. AIAA Journal 27, 1167–1174.
Hayes, F.C., & Stoecker, W.F. (1969). Design data for air curtains. ASHRAE Transactions 75(2), 68-180.
ISO 23953-2 (2005). Refrigerated display cabinets - Part 2: Classification, requirements and test conditions. Geneva, Switzerland: International Organization for Standardization (ISO).
Laguerre, O., Hoang, M.H., & Flick, D. (2012). Heat transfer modelling in a refrigerated display cabinet: the influence of operating conditions. Journal of Food Engineering 108(2), 353-364.
Moureh, J., & Yataghene, M. (2016). Numerical and experimental study of airflow patterns and global exchanges through an air curtain subjected to external lateral flow. Experimental Thermal and Fluid Science 74, 308–323.
Nascimento, S.M., Heidinger, G.G., Gaspar, P.D., & Silva, P.D. (2015). Experimental analysis to optimize the performance of air curtains and heat exchangers: Application to open refrigerated display cases, Ch. 16, pp. 590-640, in Gaspar, P.D., & Silva, P.D. (Eds.), Handbook of Research on Advances and Applications in Refrigeration Systems and Technologies, IGI Global.
Navaz, H.K., Henderson, B.S., Faramarzi, R., Pourmovahed, A., & Taugwalder F. (2005). Jet entrainment rate in air curtain of open refrigerated display cases. International Journal of Refrigeration 28(2), 267–275.
Patankar, S.V. (1980). Numerical heat transfer and fluid flow. Hemisphere Publish. Corp., Washington. D.C., U.S.A. Reindl, D.T., & Jekel, T.B. (2009). Frost on air-cooling evaporators. ASHRAE Journal 51(2), 27-33.
Rigot, G. (1991). Meubles et Vitrines Frigorifiques. PYC DITION, París, France, 340p.
Van Leer, B. (1979). Toward the ultimate conservative difference scheme, IV, a second order sequel to Godunov's method. Journal of Computational Physics 32, 101–136.
Yu, K., Ding, G., & Chen, T. (2009). A correlation model of thermal entrainment factor for air curtain in a vertical open display cabinet. Applied Thermal Engineering 29(14-15), 2904–2913.