UNIVERSIDADE DA BEIRA INTERIOR
Engenharia
Optimal Demand Response Strategy in Electricity
Markets through Bi-level Stochastic
Short-Term Scheduling
Saber Talari
Tese para obtenção do Grau de Doutor em
Engenharia Electrotécnica e de Computadores
(3º ciclo de estudos)
Orientador: Doutor João Paulo da Silva Catalão
Co-orientador: Doutor Pedro Miguel de Figueiredo Dinis Oliveira Gaspar Co-orientador: Doutor Miadreza Shafie-khah
UNIVERSITY OF BEIRA INTERIOR
Engineering
Optimal Demand Response Strategy in Electricity
Markets through Bi-level Stochastic
Short-Term Scheduling
Saber Talari
Thesis submitted in fulfillment of the requirements for the Ph.D. degree in
Electrical and Computer Engineering
(3
rdcycle of studies)
Supervisor: Dr. João Paulo da Silva Catalão
Co-supervisor: Dr. Pedro Miguel de Figueiredo Dinis Oliveira Gaspar Co-supervisor: Dr. Miadreza Shafie-khah
This work was supported by FEDER funds through COMPETE 2020 and by Portuguese funds through FCT, under Projects SAICT-PAC/0004/2015 - POCI-01-0145-FEDER-016434 (ESGRIDS) and 02/SAICT/2017 - POCI-01-0145-FEDER-029803 (UNiTED). Moreover, Saber Talari gratefully acknowledges Fraunhofer-IEE for the support as visiting scholar.
Acknowledgments
Firstly, I would like to express my sincere gratitude to my Ph.D. advisors, Dr. João Catalão, Dr. Pedro Dinis Gaspar and Dr. Miadreza Shafie-khah, for the continuous support of my Ph.D. studies and related research, for their patience, motivation and immense knowledge. Their constructive guidance, advice, and comments helped me at all times during the research and writing of this thesis.
I thank all the co-authors of my works and especially to my closest collaborators, Dr. Wang, Dr. Nadali, Dr. Aghaei, Dr. Wei, and Dr. Siano. I would like to thank to my fellow colleagues in the “Sustainable Energy Systems Lab” especially Dr. Gerardo Osório and Dr. Sérgio Santos for providing a great environment and dealing with all needs in the Lab during the past years. I would like also express my gratitude to all colleagues and students in ‘Fraunhofer institute for Energy Economics and Energy System Technology’ for supporting me during my stay as a visiting researcher in Kassel, Germany.
Last but not least, I would like to thank my family, especially my parents, my brothers and all my friends who have been beside me in the last years.
Resumo
A tecnologia atual na monitorização inteligente, incluindo a Internet of Things (IoT), permite que a rede elétrica ao nível da transporte e distribuição faça uso de programas de demand
response (DR) para garantir a operação segura e económica dos sistemas de energia.
A liberalização e a reestruturação da indústria dos sistemas de energia elétrica também promovem a gestão do lado da procura de forma otimizada.
Os impactes da implementação de DR no mercado elétrico podem ser expressos pelo conceito de agregadores de DR (DRAs), sendo a interface entre o lado da oferta e o lado da procura de energia elétrica. Vários mercados, como os mercados diário e em tempo real, são estudados visando a gestão otimizada do ponto de vista do Independent System Operator (ISO) ou do
Distribution System Operator (DSO).
Para atingir os objetivos propostos, modelos de otimização em um ou dois níveis podem ser desenvolvidos. O comportamento das fontes de energia renováveis dependentes do clima, como a produção de energia eólica e fotovoltaica que acarretam incerteza, é modelado pelo método de simulação de Monte Carlo. Ainda, two-stage stochastic programming é aplicada para minimizar o custo de operação.
Os resultados deste estudo demonstram a importância de considerar todos os participantes efetivos no mercado, como DRAs e clientes finais, no custo de operação. Ainda, considerando a incerteza no modelo beneficia os operadores da rede na redução de custos, capacitando a resiliência e fiabilidade da rede.
Palavras Chave
Otimização em dois níveis; Demand response; Rede de distribuição e transporte; Mercado elétrico; Fontes de energia renováveis.
Abstract
Current technology in the smart monitoring including Internet of Things (IoT) enables the electricity network at both transmission and distribution levels to apply demand response (DR) programs in order to ensure the secure and economic operation of power systems. Liberalization and restructuring in the power systems industry also empowers demand-side management in an optimum way.
The impacts of DR scheduling on the electricity market can be revealed through the concept of DR aggregators (DRAs), being the interface between supply side and demand side. Various markets such as day-ahead and real-time markets are studied for supply-side management and demand-side management from the Independent System Operator (ISO) viewpoint or Distribution System Operator (DSO) viewpoint.
To achieve the research goals, single or bi-level optimization models can be developed. The behavior of weather-dependent renewable energy sources, such as wind and photovoltaic power generation as uncertainty sources, is modeled by the Monte-Carlo Simulation method to cope with their negative impact on the scheduling process. Moreover, two-stage stochastic programming is applied in order to minimize the operation cost.
The results of this study demonstrate the importance of considering all effective players in the market, such as DRAs and customers, on the operation cost. Moreover, modeling the uncertainty helps network operators to reduce the expenses, enabling a resilient and reliable network.
Keywords
Bi-level programming; Demand response; Distribution and transmission network; Electricity market; Renewable energy sources.
Contents
Acknowledgments ... iii Resumo ... iv Palavras Chave ... iv Abstract... v Contents ... vi List of Figures ... xList of Tables ... xii
List of Symbols ... xiii
Relevant Acronyms ... xviii
Chapter 1 ... 1
1 Introduction ... 1
1.1 Background ... 1
1.2 Research Motivation and Problem Definition ... 2
1.3 Research Questions, Objectives and Contributions of the Thesis ... 4
1.4 Methodology ... 6
1.5 Notation ... 6
1.6 Organization of the Thesis ... 6
Chapter 2 ... 8
2 Stochastic Modelling of Renewable Energy Sources from Operators’ Point-of-View: A Survey... 8
2.1 Introduction ... 8
2.2 Stochastic Analysis of Renewable Energy Sources ... 10
2.2.1 Stochastic Independency ... 10 2.2.1.1 Point Forecasts ... 10 2.2.1.2 Probabilistic Forecast... 11 2.2.1.2.1 Quantile Forecast ... 11 2.2.1.2.2 Forecast Interval ... 11 2.2.1.2.3 Density Forecasts ... 11 2.2.1.3 Scenario Forecast ... 12 2.2.1.3.1 Analytical Methods ... 12
2.2.1.3.2 Monte-Carlo Simulation ... 13
2.2.2 Stochastic Dependence ... 13
2.2.3 Multidimensional Dependence ... 15
2.3 Uncertainty Tackling by Demand Side Flexibility ... 16
2.3.1 Various Demand Response Modelling ... 17
2.3.1.1 Demand Response Programs ... 17
2.3.1.2 Demand Response Conditions ... 18
2.3.1.2.1 Demand Behaviour ... 19
2.3.1.2.2 Negative Supplier ... 19
2.3.1.2.3 Demand Bidding ... 20
2.3.1.2.4 Demand Response Aggregation ... 21
2.3.1.2.5 Demand Response Price Modelling ... 21
2.4 Electricity Market Role for Mitigation of the Stochastic Nature of RESs ... 23
2.4.1 Day-Ahead Market ... 24
2.4.1.1 Two-Stage ... 25
2.4.1.2 Chance Constrained ... 25
2.4.1.3 Robust Programming ... 26
2.4.1.4 Multi-Stage ... 27
2.4.2 Intraday Market (Adjustment Market) ... 27
2.4.3 Balancing Market ... 28
2.4.4 Demand Response Exchange (DRX) Market ... 29
2.5 Brief Remarks from the Survey ... 31
Chapter 3 ... 32
3 Optimal Scheduling of Demand Response in Pre-Emptive Markets Based on Stochastic Bi-l evel Programming Method ... 32
3.1 State-of-the-Art and Aims ... 32
3.2 Problem Statement ... 36
3.2.1 DR Aggregator’s Perspective ... 36
3.2.2 ISO’s Perspective ... 37
3.2.3 Demand Response Options ... 38
3.2.3.1 Load Curtailment ... 38
3.2.3.2 Load Shifting and Load Recovery ... 39
3.3 Problem Formulation... 41
3.3.1 Bi-level Programming ... 41
3.3.2 Implementing Duality Theory ... 44
3.3.3 Equivalent Single-Level Problem ... 45
3.4 Numerical Studies ... 45
3.5 Brief Remarks of the Chapter ... 51
Chapter 4 ... 52
4 Real-Time Scheduling of Demand Response Options Considering the Volatility of Wind Power Generation ... 52
4.1 State-of-the-Art and Aims ... 52
4.2 Problem Statement ... 54
4.2.1 Stochastic Modeling ... 55
4.2.2 Scenario Generation ... 55
4.2.3 Market Structure ... 56
4.2.4 Demand Response Options ... 56
4.2.4.1 Day-Ahead DR Decisions ... 58
4.2.4.2 Real-Time DR Decisions ... 58
4.2.4.3 DR Price Bidding Scheme ... 59
4.3 Two-Stage Stochastic Programming ... 60
4.4 Numerical Studies ... 62
4.5 Brief Remarks of this Chapter ... 70
Chapter 5 ... 71
5 Stochastic Management of Demand Response Aggregators Considering Customers’ Preferences within Distribution Networks ... 71
5.1 State-of-the-Art and Aims ... 71
5.2 Problem Statement ... 74
5.2.1 Operation Strategy ... 74
5.2.2 Stochastic Bi-level Model ... 75
5.2.3 DR Trading ... 76
5.3 Problem Formulation... 78
5.3.1 Bi-level Model ... 78
5.3.2 Dual Form of the Lower-Level Problem ... 81
5.4 Case Study and Numerical Results ... 82
5.4.1 Case Study ... 83
5.4.2 Numerical Results ... 84
5.4.2.1 Case 1: Two DRAs in Two Nodes ... 84
5.4.2.2 Case2: Several DRAs ... 87
5.5 Brief Remarks of the Chapter ... 89
Chapter 6 ... 90
6 Conclusions, Directions for Future Work and Contributions ... 90
6.1 Main Conclusions ... 90
6.2 Directions for Future Works ... 93
6.3 List of Publications ... 93
6.3.1 Book Chapters ... 93
6.3.2 Publications in Peer-Reviewed Journals ... 93
6.3.3 Publications in International Conference Proceedings ... 94
List of Figures
Figure 2.1 Various methods of stochastic analysis of renewable energy sources... 12
Figure 2.2 Different types of Copula methods. ... 15
Figure 2.3 Demand response programs categories. ... 18
Figure 2.4 Demand response bid curve as negative supplier. ... 20
Figure 2.5 Demand response bid curve for demand bidding. ... 21
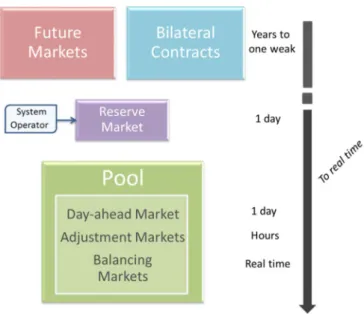
Figure 2.6 Market Structures. ... 24
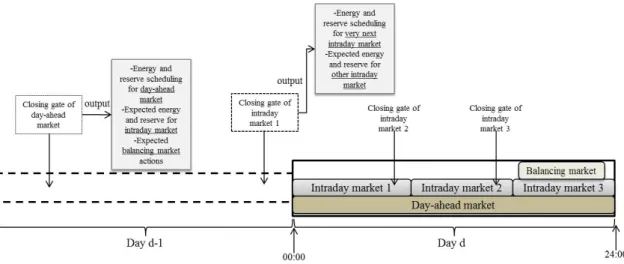
Figure 2.7 The framework of short-term electricity market. ... 29
Figure 2.8 DRX market framework. ... 30
Figure 3.1 Proposed bi-level model. ... 37
Figure 3.2 Scenario generation flowchart. ... 39
Figure 3.3 DR price bidding. ... 40
Figure 3.4 Interaction among different players. ... 41
Figure 3.5 One-line diagram of studied 6-bus network. ... 47
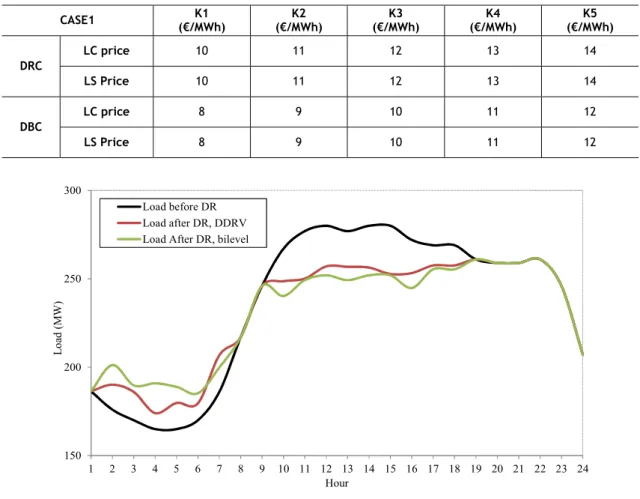
Figure 3.6 Impact of proposed DR model on load profile for case 1. ... 47
Figure 3.7 Impact of proposed DR model on load profile for case 2. ... 49
Figure 3.8 Impact of proposed DR model on load profile for case 3. ... 49
Figure 3.9 The impact of DR prices and WF capacity on total operation cost. ... 50
Figure 4.1 The framework of scenario generation for WPG. ... 57
Figure 4.2. Proposed model framework. ... 57
Figure 4.3. DR price bidding for day-ahead and real-time market ... 60
Figure 4.4. The diagram of 6-bus network. ... 62
Figure 4.5The relationship between the limitation of DR quantity in the day-ahead and real-time markets. ... 64
Figure 4.6Forecasted wind power generation and all scenarios extracted via the model. ... 65
Figure 4.7 Base load and loads after DR in different states. ... 66
Figure 4.8 the quantity of DR for all three options LC, LS, and LR and all DR aggregators per scenarios and in the day-ahead market. ... 67
Figure 4.9 DR cost in different DRAs and different scenarios a) total cost b) LS cost c) LC cost. ... 68
Figure 4.10 Sensitivity analysis for different real-time DR price for total cost and DR cost. . 69
Figure 4.11. Differences of LC scheduling in two scenarios for two DR prices... 69
Figure 5.1 The framework of the proposed bi-level model. ... 75
Figure 5.2 Stochastic model ... 77
Figure 5.3 The structure of interaction among different players in the proposed model. .... 78
Figure 5.4 15-bus distribution network. ... 83
Figure 5.5 Hourly different prices. ... 83
Figure 5.6 DR prices for DRA3 and DRA5 in different hours. (scenario 6) ... 85
Figure 5.7 Scenario 1 results. ... 85
Figure 5.8 Scenario2 results. ... 85
Figure 5.9 Scenario 3 results. ... 86
Figure 5.10 Scenario 4 results. ... 86
Figure 5.11 Scenario 5 results. ... 86
Figure 5.12 Scenario 6 results. ... 86
Figure 5.13 Scenario 7 results. ... 87
Figure 5.14 DR cost for each DRA in different numbers of DRAs in the network. ... 88
Figure 5.15 Hourly total DR cost for different numbers of DRA in the network. ... 88
List of Tables
Table 2.1 Taxonomy of different methods for modelling renewables uncertainties. ... 16
Table 2.2 Taxonomy of Different DR programs. ... 19
Table 2.3 Taxonomy of different markets and relevant literatures. ... 30
Table 3.1 Taxonomy of key relevant papers and the differences with the current work ... 35
Table 3.2 DR prices for 5 offers and two options in case 1. ... 47
Table 3.3 Unit commitment status of units’ comparison among proposed bi-level model and conventional method for case 1 ... 49
Table 3.4 Unit commitment status of units’ comparison among proposed bi-level model and conventional method for case 3 ... 50
Table 3.5 Different costs in all cases based on two methods ... 50
Table 4.1 Units’ Data. ... 62
Table 4.2 Transmission line data. ... 63
Table 4.3 DR prices for 5 offers and two options. ... 64
Table 4.4 Case studies. ... 64
Table 4.5 Different costs in all cases ... 69
Table 4.6 Comparison the results of performing the model on 6-bus system and RTS-96 ... 69
List of Symbols
The main notations used in Chapters 3, 4 and 5 are listed below. Other symbols are defined where they first appear.
Chapter3
Indices (sets) and abbreviations
DBK Set of demand response offers between DR aggregator and customer. DRK Set of demand response offers between ISO and DR aggregator. g (NG) Index (set) of generating units.
gen Generator units.
k (NK) Index (set) of demand response offers. l (NL) Index (set) of transmission lines.
LC Load curtailment option.
LS Load shifting option.
LR Load recovery option.
n (NN) Index (set) of nodes. s (NS) Index (set) of scenarios.
scen Superscripts for wind scenarios. shed Superscripts for load shedding. spill Superscripts for wind spillage.
t
(NT) Index (set) of hours., ,
TC TS TR Set of times for load curtailment, shift and recovery options.
ˆ , ,
X LC LS LR∈ Superscripts for LC and LS and LR.
Parameters
gen tg
C Production cost of generator units. ,
up down
tg tg
C C Up/down reserve cost of generator units.
. , .
strt up sht dwn g g
C C Generator start-up/shut-down cost.
spill tns
C s Wind spillage cost per scenario.
,
up down tgs tgs
Cs Cs Up/down reserve cost per scenario.
voll tns
Cs
Value of loss of load per scenario.ˆ ˆ
, , ,
Cost X Cost X
tnk tnk
DR DB Cost of offer kfrom demand response option Xˆ.
ˆ ˆ
, , ,
Min X Min X
tnk tnk
ˆ ˆ , , ,
Max X Max X
tnk tnk
DRK DBK Maximum offer k from demand response optionXˆ. ˆ,min, ˆ,max
X X
nk nk
LCD LCD Min/max time for offer k from demand response optionXˆ .
tn
LD Forecasted load.
ˆ
X nk
MC Maximum number of calling DR option Xˆper day. max, min
l l
pf pf Maximum/minimum transmission line capacity.
max, min
g g
P P Maximum and minimum capacity of generating units.
max,up, max,down
g g
R R Maximum up/down reserve.
,
up dwon
g g
Rmp Rmp Maximum ramp-up/-down.
nl
X Transmission lines inductance.
Binary variables
, ,
u y z Binary variables for on/off, start-up and shut-down status.
ub On/off for demand response offers from DR aggregator viewpoint.
Variables
ˆ ˆ
,
X X
DRK DBK Demand response scheduling for demand response optionXˆ. P Thermal power generation.
,
pf pfs Power line flows day-ahead/balancing.
,
up down
tg tg
R R Up/down reserve of units.
,
up down
tgs tgs
Rs Rs Up/down reserve of units for scenarios.
W Wind power generation.
θ
Voltage angle.Chapter 4
Indices and setsg (N G) Thermal generators. k (N K) Offers of DR. l (N L) Branches.
n
(N N) Buses.s
(NS) Real-time scenarios.t
(N T) Time.Abbreviations and superscripts gen Thermal Generators.
scen
Wind scenarios superscript.shed
Load shedding superscript.spill
Wind spillage superscript., ,
TCTS TR
Time sets dedicated to load curtailment, shifting and recovery, respectively.ˆ
X LC, LS, and LR.
Parameters
gen tg
C Thermal generation units cost.
,
up down
tg tg
C C Up and down thermal generators reserve cost, respectively.
. , .
strt up sht dwn
g g
C C Start-up/shut-down cost for thermal generators.
spill tns
Cs
Cost of wind spillage for each scenario.,
up down
tgs tgs
Cs Cs Cost of up/down reserve for each scenario.
voll tns
Cs
Value of loss of load for each scenario.ˆ ˆ
, , ,
Cost X Cost X
tnk tnk
DR DRs Cost of offering DR option
ˆX
for offerk
in day-ahead and in real-timemarket.
ˆ ˆ
, , ,
Min X Min X
tnk tnk
DRK DRKs Minimum possible DR option
ˆX
for offerk
in day-ahead and real-timemarket.
ˆ ˆ
, , ,
Max X Max X
tnk tnk
DRK DRKs Maximum possible DR option
ˆX
for offerk
in day-ahead market and real-time market.ˆ,min, ˆ,max
X X
nk nk
LCD LCD Min/max possible time for offer
k
to be available from DR optionˆX
.tn
LD Total Forecasted load at each hour for each bus.
ˆ ˆ
,
X X
nk nk
MC MCs Maximum possible number of calling DR for each day and each scenario per day.
max min
,
l l
pf
pf
Maximum/minimum branch capacity.max, min
g g
P P Maximum/minimum capacity of thermal generators.
max,up, max,down
g g
R R Maximum up/down reserve of thermal generators.
,
up dwon
g g
Rmp Rmp Maximum ramp-up and ramp-down of thermal generators.
nl
X
Reactance of branches.Binary variables
, ,
u y z On/off, start-up and shut-down states for the day-ahead market.
, ,
us ys zs On/off, start-up and shut-down states for the real-time market.
Variables
ˆ ˆ
,
X X
CDR CDRs Total cost of DR scheduling for day-ahead and real-time market.
ˆ ˆ
,
X X
DRK DRKs DR scheduling in day-ahead and real-time market for DR option
ˆX
.P Production of Thermal power generators.
,
,
up down tg tg
R R
Up/down reserve of thermal generators.,
up down tgs tgs
Rs Rs
Up and down reserves of thermal generators for scenarios.θ
Voltage angle.W The production of wind generators.
Chapter 5
Indices (sets) and abbreviations
DBK Set of demand response offers between DR aggregator and customer. DRK Set of demand response offers between ISO and DR aggregator. g (NG) Index (set) of generating units.
gen Generator units.
k
(N K) Index (set) of demand response offers.l
(NL) Index (set) of transmission lines.LC
Load curtailment option.LS Load shifting option.
LR Load recovery option.
n (NN) Index (set) of nodes.
s
(NS) Index (set) of scenarios.scen
Superscripts for wind scenarios. shed Superscripts for load shedding.spill
Superscripts for wind spillage.t
(N T) Index (set) of hours., ,
TC TS TR Set of times for load curtailment, shift and recovery options.
ˆ , ,
X LC LS LR∈ Superscripts for LC and LS and LR.
Parameters
gen tg
C
Production cost of generator units.,
up down
tg tg
C C Up/down reserve cost of generator units.
.
,
.strt up sht dwn g g
C
C
Generator start-up/shut-down cost.spill tns
Cs
Wind spillage cost per scenario.,
up down tgs tgs
Cs Cs
Up/down reserve cost per scenario.voll tns
Cs Value of loss of load per scenario.
ˆ ˆ
, , ,
Cost X Cost X
tnk tnk
DR DB Cost of offer kfrom demand response option Xˆ.
ˆ ˆ
, , ,
Min X Min X
tnk tnk
ˆ ˆ , , ,
Max X Max X
tnk tnk
DRK DBK Maximum offer k from demand response optionXˆ. ˆ,min, ˆ,max
X X
nk nk
LCD LCD Min/max time for offer k from demand response optionXˆ. tn
LD
Forecasted load.ˆ
X nk
MC Maximum number of calling DR option Xˆper day. max, min
l l
pf pf Maximum/minimum transmission line capacity.
max, min
g g
P P Maximum and minimum capacity of generating units.
max,up, max,down g g
R R Maximum up/down reserve.
,
up dwon
g g
Rmp Rmp Maximum ramp-up/-down.
nl
X Transmission lines inductance.
Binary variables
, ,
u y z
Binary variables for on/off, start-up and shut-down status.ub
On/off for demand response offers from DR aggregator viewpoint.Variables
ˆ ˆ
,
X X
CRK CBK Total cost of demand response scheduling for demand response option. Xˆ
ˆ ˆ
,
X X
DRK DBK Demand response scheduling for demand response optionXˆ.
P
Thermal power generation.,
pf pfs
Power line flows day-ahead/balancing.,
up down tg tg
R R
Up/down reserve of units.,
up down
tgs tgs
Rs Rs Up/down reserve of units for scenarios.
W Wind power generation.
Relevant Acronyms
DR Demand response.
DRA Demand response aggregators.
DRP Demand response programs.
DRX Demand response exchange market.
DSO Distribution system operator.
EMS Energy management systems.
IoT Internet of things.
ISO Independent system operator.
Genco Generation company.
LC Load curtailment.
LS Load shifting.
LR Load recovery.
MILP Mixed-integer linear programming.
MINLP Mixed-integer non-linear programming.
MCS Monte-Carlo simulation.
PV Photovoltaic.
RES Renewable energy sources.
SCUC Security constrained unit commitment.
WF Wind farm.
Chapter 1
1 Introduction
1.1 Background
Since the perception of demand side participation in the electricity market is being increased, a framework for demand response (DR) in electricity market should be designed. Some papers investigated possible markets for DR programs. In some studies, a special agent called DR aggregators are proposed mostly as an interface between customers and wholesale market. DR aggregators can participate in the capacity market (e. g. PJM, Ontario) and energy-only markets (e.g. ERCOT, Alberta, and Singapore)[1]. Reference [2] presents bottom-upper aggregators for appliances of residential demand-side in order for gathering reserve bids offered in day-ahead reserve market.
Reference [3] uses DR aggregator to consider technical constraints of customers in developing an optimal trading strategy in the wholesale market, whereas customer constraints are not considered in most papers like [4]–[6] in which investigates DR from market operator's perspective. Some modeling strategies for energy markets are offered in [7] in which DR aggregators offer customers various contracts for an hourly reduction in order to determine optimal DR in the day-ahead market. DR aggregators can even participate in balance market as well, for example, DR aggregator schedules thermal heating loads based on day-ahead price; however, conducts DR in balance market through bonus price in [8].
Moreover, bilateral forward contracts, which are based on fixed price and volume are proposed in [9], [10] without modeling the bottom-level DR programs. For bottom-level DR modeling paper [2], [7] offered a new model which consider load shifting, load curtailment and load recovery programs as DR constraints but they have not studied these DR constraints in details. DR can be traded as a commodity in DR exchange (DRX) market [11]. DRX collects both aggregated demand and individualized supply curves and then it balances the supply and demand at a common price to clear the market [12]. From retailers' point of view, [10] proposed a new DR scheme in which innovative agreements among retailers and aggregators or customers are investigated by a stochastic energy program.
Both of incentive and price-based DR programs are addressed in [13] with only considering elasticity as customer constraint. New incentive mechanism is proposed in [14] which the way customers respond to rewards is determined through game theory approach. One of the methods to cope with the uncertainty of weather-dependent renewable generation is using flexible loads as DRP.
A two-stage problem is solved in [9] to get the best DR agreements according to wind producer plans at each time period. Ref [15] presents a multi-layer agent-based model to investigate the behavior of electricity market participants in the presence of wind power producers.
For household energy management, various appliances can be modeled in DRP. Some models for space heating/cooling, water heating are presented in[16]. Air conditioning control models are in [17]. A DR model for electric heating systems is presented in [18]. The behavior of consumers to control their controllable loads is proposed in [19] through an automated energy management framework. Yet, detailed constraints of loads and appliances have not been considered in these studies.
1.2 Research Motivation and Problem Definition
With merging various smart facilities and equipment as well as Internet of Things (IoT) into different sections of power systems including generation, transmission and distribution section, consideration of DR programs is going to be much easier in order to ensure the secure, economic and less emission pollutant operation of power systems and smart cities. Meanwhile, power systems restructuring aid for implementation of optimized ways for demand-side management. For example, the impacts of DR scheduling on both of wholesale market and the retail market can be revealed through the concept of DR aggregators, which are the connection between supply side and demand side. Various time horizon such as day-ahead, balancing, intra-day and real-time markets can be considered in energy, capacity, reserve, ancillary service, or even DRX [11] market from the Independent System Operator (ISO) viewpoint or Distribution System Operator (DSO) viewpoint.
From DSO perspective, different DR programs including load shifting, load curtailing, load recovery and load growth can be implemented in a retail market through DR aggregators. In load curtailment strategy, customers reduce their total electricity without shifting them to any other times. In load shifting, customers reschedule and shift their consumption to other time. For example, residential consumers may delay operating their appliances [7]. Customers contributing in load shifting are able to recover their reduced load in off-peak periods through load recovery program. However, they have to pay the cost for it because DR aggregators should buy surplus energy from market to recover loads [3].
In a retail market, electricity consumers can freely select a retailer to procure their required power. There is a competition among retailers to attract customers. Retailers are supposed to choose their demand side participants to apply DR for decrease the risk of market price volatility. In this way, retailers are able to set different DR contracts including, pool-based, spike-based, forward and reward DR contract.
Each contract has a specific DR amount, price and period. In pool-based contract, DR contract will be carried out only if the total DR price is less than purchasing the energy from pool market. Otherwise, the retailer has to pay specified fee as the penalty of not doing the contract. The spike-based contract is designed for retailers during high price period. It is similar to pool-based one and the difference is that it is just for a strike price which is negotiated among retailer and DR seller.
The forward contract is among retailer and aggregators or consumer for DR and it can be directly negotiated the price and size. In the reward-based the volume of reduction load will increase in a stepwise way as the retailer offer higher reward. Moreover, the retailer can purchase and sell energy from the wholesale market and the price is considered as a stochastic variable[20].
DR aggregators can also participate in the wholesale market for trading the energy either for more profit or for providing energy shortage. Running this interaction with providing enough details leads to maximization of social welfare, profit of participants and minimization of total operation cost. While, The DR aggregator is exposed to financial risks due to market price volatility, because it purchases electricity from the wholesale market at volatile rates and sells it to consumers at a flat rate.
On this basis, the aggregator can propose some DR-based contracts to customers. By reducing consumption during price spikes period, the aggregator may cover a part of these risks. On the other hand, customers can earn advantages from the DR-based contracts because of contract flexibility and reduction of their costs due to compensation of the aggregator’s financial risks. In smart grids, DR will be considered as a tradable commodity that is exchanged between DR buyers and sellers in a pool-based market called DRX and is completely separated from other electricity markets [12]. In this context, a DR aggregator is able to participate in the intraday DRX market as a buyer to amend its bid and as a seller to modify its offer in order to reduce its imbalance losses to cover its risks and avoid imbalance penalties. The aggregator as a financial agent in the power market has to compete with other players for selling and purchasing electricity.
In the business competition, the aggregator has to compete for keeping the current customers and attracting new ones. In other words, the aggregator should struggle with other market participants on three sides: offering strategy (with Gencos), bidding strategy (with retailers) and customers (also with retailers). The competition of the aggregator for customers has not been addressed in previous works. Hence, active customers as well as DR aggregators are considered for finding the best and most efficient DR programs in smart systems.
There is a classification for DR program that has two categories called incentive- and price-based DR programs. Incentive-price-based DR programs include Direct Load Control, Emergency Demand Response Program, Ancillary Service Demand Response and price-based programs involve Time of use, Real-time Pricing. Different possible markets are investigated for evaluation of DR programs.
Besides, high penetration of renewable energies like wind farms and photovoltaic systems causes a drop in electricity price which leads to a decrease of customer's tendency for joining in DR program. As a result, a suitable market mechanism and proper DR program are applied to cope with it. In addition, the behavior of participants including different entities and aggregators is modeled through game theory to predict market participants in the case of any changes in market regulation.
In order to model upper and bottom level of power market, it is possible to develop a bi-level optimization [15]. This environment is modeled from DR aggregator’s viewpoint. Different stochastic variables including weather-dependent renewable energy sources make an uncertain environment in power systems.
For dealing with these uncertainties, a two-stage stochastic programming is utilized in order to minimize the total operation cost. Accordingly, a short-term operation management is run for given market mechanism which can be a day-ahead market, balancing market or other proper markets.
1.3 Research Questions, Objectives and Contributions of the
Thesis
This thesis presents a comprehensive analysis of DR-based power network scheduling in an uncertain environment. New analysis tools and methods are developed in this thesis that take into account the operational variability and uncertainty associated with the RES power generation while considering several electricity market players in different levels, simultaneously.
The ultimate aim of all this is to enable DSOs, ISOs and other operators to operate the network optimum, sustainable, stable and secure, using proper flexibilities, such as DR and regulation, as solutions for RES uncertainty. In other words, it is tried that applying potentials of electricity market and the relevant players, a precise strategy to operate the network is made while all network constraints are considered.
The main objectives of this thesis are:
• To investigate the-state-of-the-art survey on existence mathematical methods to model stochastic nature of renewable sources in the operation of the power system;
• To study different available approaches to cope with uncertainty of renewables generation in short-term scheduling of the power system;
• To develop an appropriate optimization method for system operator in order for a steady state operation of transmission network while all constraints are taken into account;
• To present suitable market scheme for ISOs, which are able to perform demand-side management through DRAs;
• To extract the extra potential of customers for DR implementation in real-time market in addition to day-ahead market, which has been ignored, for enhancing the stability of the transmission network and operation cost reduction;
• To develop the optimization model for distribution operator in order for DR employment through several DRAs while meeting all network constraints and customers’ preference in an uncertain environment;
• To present a proper market mechanism to operate a DR-enabled distribution network with customers as active players.
In particular the following research questions are addressed:
• What are the current solutions for modelling the stochastic nature of renewable
energy resources and how to cope with the negative impacts of these sources of uncertainty on power system scheduling?
• What is the best market scheme to operate a power system with high penetration of
wind power generation within the transmission network (wholesale market) and how to apply the potential of the DRA as an active market player?
• How to employ the possible extra potential of customers in the real-time market to
participate in demand-side management, while their potential in day-ahead market has already been taken into account?
• How to apply demand-side management in the distribution network (retail market)
when DRAs are responsible for DR trade-off and customers are playing an active role to benefit from this opportunity in an uncertain environment?
The contributions of this thesis (all already published in prestigious venues) are summarized as follows:
• An overview on stochastic modeling of RESs in power system operation and the impact of different market schemes and demand-side management on accuracy increment of power system scheduling in the presence of RESs. This contribution is published in Renewable and Sustainable Energy Reviews (ELSEVIER) [21];
• A method to model the interaction of DRA and ISO to run a proper DR-enabled market to find an optimum scheduling of power system while minimizing the operation cost in an uncertain environment is proposed in a bi-level model. This contribution has been published in IEEE Transactions on Industrial Electronics [22].
• An expression about the possibility of DR implementation in real-time market through DRAs is presented. Unpredicted behavior or events in real-time can lead to provide the opportunity of DR implementation and the proper solution to perform this concept practically is modeled. This contribution has been presented and published in the 20th Power Systems Computation Conference (PSCC 2018) [23].
• A comprehensive study of DR implementation in real-time market in addition to day-ahead market using the extra potential of DR-enabled customers and considering the interaction of DRAs and customers as well as ISOs are discussed. A two-stage stochastic programming is applied to run this market. This contribution has been published in IEEE Transactions on Sustainable Energy [24].
1.4 Methodology
The mathematical models developed in this thesis are based on well-established methods, namely, mixed-integer linear programming (MILP), bi-level optimization and two-stage stochastic programming. In order to achieve the main research objective, beyond the simulation models, this thesis develops methods and solution strategies to analyze the demand response scheduling in power system operation under uncertainty, and a dramatically changing power generation scheme over time.
The proposed optimization models and the solutions strategies are implemented in GAMS© and solved in most cases using the CPLEX™ algorithm, mostly by invoking default parameters. The clustering methodology is implemented in the MATLAB© programming environment, with Excel© used as an interface for this purpose.
1.5 Notation
The present thesis uses the notation commonly used in the scientific literature, harmonizing the common aspects in all sections, wherever possible. However, whenever necessary, in each section, a suitable notation may be used.
The mathematical formulas will be identified with reference to the subsection in which they appear and not in a sequential manner throughout the thesis, restarting them whenever a new section or subsection is created. Moreover, figures and tables will be identified with reference to the section in which they are inserted and not in a sequential manner throughout the thesis. Mathematical formulas are identified by parentheses (x.x.x) and called “equation (x.x.x)” and references are identified by square brackets [xx]. The acronyms used in this thesis are structured under synthesis of names and technical information coming from the English language, accepted in the technical and scientific community.
1.6 Organization of the Thesis
The thesis comprises seven chapters that are organized as follows.
Chapter 1 is the introductory chapter of the thesis. First, the background of the thesis is presented. Then, the research motivations and the problem definition are provided. Subsequently, the research questions and contributions of this thesis are presented. Then, the methodology used throughout the thesis is introduced, followed by the adopted notations. Finally, the chapter concludes by outlining the structure of the thesis.
In Chapter 2, a comprehensive overview of stochastic models for RESs is presented. First, stochastic analysis of renewables is conducted and mathematical solutions for stochastic modelling are presented. Then, the models that the uncertainties arising from RESs can be handled by demand side flexibilities are investigated. Finally, the role of electricity market to mitigate the stochastic nature of RESs is discussed.
In Chapter 3, a DR-enabled operation model is formulated as a multi-level, multi-stage optimization problem in order to run a pre-emptive market while considering both ISO and DRAs perspective in different levels, simultaneously. Uncertain behavior of RESs in real-time market is modeled in a two-stage programming and in a bi-level model ISO minimizes the operation cost and DRA maximizes the profit.
In Chapter 4, DR implementation in real-time market in addition to day-ahead market is modeled. A two-stage programming is formulated as MILP to consider unpredicted events in real-time which provide the extra potential for customers to participate in real-time DR. different scenarios are generated by MCS method.
Chapter 5 presents a multi-stage and multi-level optimization model in distribution network in order to find an optimum DR from DSO’s perspective in one level and customers’ viewpoint in another level. Stochastic nature of PVs and WPG in distribution network is modeled by scenario generation through MCS method. A proper market scheme is also offered.
Chapter 6 presents the main conclusions of this work. Guidelines for future works in these fields of research are provided. Moreover, this chapter reports the scientific contributions that resulted from this research work and that have been published in journals, book chapters or conference proceedings of high standard (IEEE).
Chapter 2
2
Stochastic Modelling of Renewable Energy
Sources from Operators’ Point-of-View: A Survey
High penetration of renewable energy sources, especially weather-dependent sources, has increased the power systems uncertainties. For any analysis in power systems such as planning and operation, it is essential to confront the stochastic nature of these sources in order to get much more precise results. Since operators need proper strategies and methods to decline negative effects of probabilistic behavior of renewable power generators, such as total operation cost growth, this chapter provides a review of different state-of-the-art approaches from the operator’s viewpoint for handling the stochastic behavior of renewable sources. Hence, in this chapter, three different strategies are categorized for stochastic analysis of these sources. The first strategy is mathematical modelling including stochastic dependency and independency, multi-dimensional dependence, forecast and scenarios. Afterwards, demand side management, which is one of the other approaches for dealing with these uncertainties, is investigated and different demand response programs and some methods to model them are presented.
Finally, the effect of different electricity market schemes and relevant optimization methods to mitigate the variations of renewable energy sources are discussed. The chapter demonstrates that an operator should choose one or a combination of these three approaches based on its requirements.
2.1 Introduction
Renewable energy sources are being highly merged into the power systems. They can be found everywhere in different sizes either as a centralized huge power plant or as a distributed generation near the end-users [25]. Moreover, it is possible to apply several renewable sources as a hybrid system to meet the load requirements of a region [26].
In this case, combining these sources such as wind and solar with backup units provides more reliable, environment-friendly and economic load supply in comparison with a single source. There are stand-alone renewable sources which can be operated alone without the need of global network [27], [28]; however, stand-alone renewable sources are beyond the scope of this literature. The main target of this literature is an investigation of different aspects of emerging renewable energy sources in power systems.
Many kinds of literature have studied the impact of renewable sources penetration on voltage [29], frequency [30], [31], power quality [32], environment [32], power systems dynamic and stability [32], [33] and power losses [34]. Before analyzing renewable energy sources in power systems especially weather-dependent sources like wind and solar, their stochastic nature should be considered in order to increase the accuracy of the results.
The uncertainty of weather-dependent renewable sources has studied in some literature by different stochastic methods including possibility and probability approaches. Some literature used possibility approach which is divided into two categories including quantitative and qualitative methods [35].
The quantitative is used for epistemic uncertainty like fuzzy power flow analysis [36], [37], and the latter is for choosing the proper type of weather-dependent source for designers in planning stage [38]. In this survey, stochastic analysis of renewable energy resources in power systems operation is investigated through probability approach which includes Monte-Carlo simulation (MCS). Meanwhile, these uncertainties can be managed by some flexibilities like supply-side flexibility, e.g., capacity limits, ramping limits, minimum up/ down limits, energy storage availability, and transmission limit enhancement [39].
Moreover, [39] demonstrates the demand side flexibility for managing the sources uncertainties. In fact, renewable sources can be facilitated by demand response (DR) programs. Furthermore, impacts of stochastic nature of renewable energy sources on electricity market can be investigated for markets like day-ahead or balancing market because the market participants should make a decision in advance [39].
In fact, operators, due to their position, responsibility and duty, have to take proper measurements to address negative impacts of renewable sources uncertainties on the operation scheduling like total operation cost growth and deviations from scheduling. To this end, they have many options which one or a combination of some of them should be selected based on their requirements and capabilities. In this chapter, the most common, useful and modern strategies for operators are introduced and investigated through a comprehensive study among relative articles.
Some literatures like [40] studied uncertainty modelling techniques in power systems and its classification is for general usages in power systems. We study stochastic modelling techniques from weather-dependent renewable sources in different kinds of literatures which include stochastic dependency and independency, multi-dimensional dependence, forecast, and scenarios.
Afterwards, demand side management, which is one of the other approaches to deal with these uncertainties, is investigated and different demand response programs and some methods to model them are presented. Moreover, different methods of stochastic optimization in different market frameworks for dealing with uncertainties raised from stochastic renewable sources are discussed through relevant literature. This is a new classification of stochastic analysis of renewable resource among other works.
The chapter is structured in four sections. In Section 2.2, methods of dealing with the stochastic behaviour of stochastic generators including solar and wind are investigated. Applying demand side flexibility to confront power generation uncertainty is described in Section 2.3. Section 2.4 expresses the role of the electricity market to mitigate the effect of renewable energy sources uncertainty. Finally, in Section 2.5 conclusion and possible future work are presented.
2.2 Stochastic Analysis of Renewable Energy Sources
For obtaining enough information in terms of renewable sources output, forecasting their output is important especially for decision makers and operational problems. According to needs of operators, different methods are applied for tackling the renewable uncertainties; therefore, in this chapter from a deterministic forecast to a scenario-based one are studied. In the following, various models for forecast and stochastic modelling in both dependent, independent, and the multi-dimensional state will be investigated which is demonstrated in Figure 2.1.
2.2.1 Stochastic Independency
Forecast and scenarios are in fact extrapolation. It means that a model is built and fitted to a set of data. The correlation between different stochastic variables may not consider, and the scenario generation or forecast is conducted, independently.
2.2.1.1 Point Forecasts
In this method, the renewable sources forecast are generated at time for time + which is m time after the time and it is a single valued either. It means that having information at the forecast value in + is calculated. In other words, only one value will be generated in point forecasts method and this value can be used in both stochastic model and deterministic model.
In [41], point forecast of wind and solar are considered in both deterministic and stochastic approaches for comparison purposes in microgrid scheduling. In fact, the deterministic approach is a special case of stochastic approach with only one scenario. First, a day-ahead simulation is run through the forecast point of the wind and solar power output, and then, in real-time, the actual amount is replaced. The point forecast error will be compensated by energy storage systems in the microgrid.
2.2.1.2 Probabilistic Forecast
In contrast to point forecast, probabilistic one aims to get full information about what is going to occur in the future. It can be divided into some subsection.
2.2.1.2.1 Quantile Forecast
This method is based on quantile of the distribution function. It means, at time a random variable is generated for time + , and then, a forecast of probability density function (PDF) or related cumulative distribution function (CDF) is issued to fit the random variable.
The random variables can be generated by different methods such as Markov chain Monte Carlo methods, pseudorandom generators, Metropolis-Hastings algorithm and so on. In quantile forecast, random variable in time + determines a quantile which tells at time there is a special probability (nominal level) that renewable energy generation will be less than its quantile at time + [42], [43].
Moreover, it is in the form of threshold level related to probability and can be used for some operational problems. In [44], authors analyzed forecast error to build a model of quantiles of forecast error in wind farms. Wind power uncertainty was modelled in [45] through linear quantile regression by formulation a cubic B-splines for obtaining the quantile with a proportion of the forecast error.
Authors in [46] applied quantile forecast method for both solar and wind generator forecast which is used for deterministic power system unit commitment and comparison with the different probabilistic forecast method.
2.2.1.2.2 Forecast Interval
Quantile forecast method does not deliver any information about forecast uncertainty level. To this end, the forecast interval is used in [47]. Forecast interval is usually proper for robust optimization. Forecast interval has a nominal coverage rate and lower and upper bounds which define, for example, the probability that a wind farm generation is higher than a specific amount. Actually, forecast interval can cover point forecasts and quantile forecast through considering different nominal coverage rates. Therefore, full forecast distribution of stochastic variable like wind power can be obtained by this method [48].
2.2.1.2.3 Density Forecasts
Density forecast gives the whole information about renewable sources generation for the future. The produced PDF or CDF includes a complete description of the stochastic variable. In [49], to tackle wind power generation uncertainty, probability density forecasting provides an expected future values of uncertainties. To this end, a new type of forecast called weather ensemble forecasting is applied, which is generated from the atmospheric model and include several scenarios for the future value of a weather variable.
Figure 2.1 Various methods of stochastic analysis of renewable energy sources.
The distribution of these scenarios would be used as density forecast. Moreover, statistical time series techniques like daily wind speed or solar irradiance data of generalized autoregressive conditional Heteroskedasticity (GARCH) and long-memory time series model for a generation of density forecast is used [50], [51].
2.2.1.3 Scenario Forecast
In scenario generation method, some information about characteristics of the stochastic variable like renewable power generation is given. In a simple way, each lead time, location and renewable energy type are considered, independently. Since each forecast includes some kinds of errors and these errors can be in a relation with time and increase time by time, if the forecasts errors are not strongly correlated in time, the temporal dependence structure can be disregarded.
2.2.1.3.1 Analytical Methods
Analytical methods are based on convolution methods like fast Fourier transform method (FFTM), Multi-linear simulation method (MLSM) and point estimate method (PEM). In [52], FFTM is used for generation of a PDF for wind speed for some investigation about available transfer capability (ATC). MLSM is used in [53] for probabilistic load flow (PLF) of distribution system with the wind and photovoltaic (PV).
PEM is employed in [54], as a deterministic routine to find the statistical moments of output random variables. The article implements PEM to model the output power of solar and wind power generators. It is important to put some simplifications in their formulation. These simplifications are linearization, independence and normality. In linearization of the system model, the problem can be solved much easier because it permits the representation of the system outputs as a linear combination of systems inputs [35].
In independent assumption, system inputs are considered statistically independent. This assumption, in a combination of linearization, helps to compute outputs by series of convolution or application of Gram-Charlier expansion method and computation of cumulants of system outputs by system inputs based on their invariance to a linear transformation. This method is widely used for PLF [55]; however, some articles considered wind generators besides probabilistic load flow.
For example, in [56], authors used a combination of cumulants and Gram-Charlier expansion to calculate (PLF) containing large-scale wind power. In normality assumption, inputs are presumed to be normally distributed. This assumption let to apply linear correlation for the dependence structure among random variables [35]. Some literature mention that analytical methods need a fewer number of the simulation than Monte-Carlo simulation (MCS) method [57].
2.2.1.3.2 Monte-Carlo Simulation
MCS methods are the most accurate and straight-forward method; however, it needs remarkable computational efforts [57]. For the wind or PV generation, a PDF should be assigned for every time period. In the most articles, Weibull PDF is considered as the best function for modelling the stochastic behaviour of wind power generation [58]–[61]. Beta PDF is generally dedicated for the stochastic attitude of solar power generation [62], [63].
With determining the proper PDF, related PDF for every time period is generated through the expected or forecasted value of the wind or solar power generation. A large number of scenarios can be generated by fitting random variables to the PDFs with equal probability. The procedure is repeated for a number of iterations.
Some methods like Latin hypercube sampling (LHS) [64], sample-splitting approach (SPA) [65] and fission and roulette(F&R) method [66], are used to decrease the computation burden of MCS. Therefore, in each scenario, there are t time period (based on the horizon time) random wind or PV generation based on forecasted generation [67].
2.2.2 Stochastic Dependence
Some simplifications like independency between random variables and considering all PDF as Normal distribution would not get the accurate results and are full of fallacies. Therefore, it is essential to consider stochastic dependence between system inputs especially from output aggregation of multiple renewable generation inputs. The difference dependence structures yield different distributions around the same central point [35]. In this sense, it is required to find a way to measure the dependence between random variables.
In [35], this correlation between two stochastic power generators is considered. The most common method is the product moment correlation (PMC) or linear/Pearson correlation which for the dual case is as follows:
( ) ( ) ( ) [( ( )) ( ( ))] ( , ) ( , ) ( ) ( ) ( ) ( ) ( ) ( ) E XY E X E Y E X X Y Y Cov X Y X Y X X X X X X μ μ ρ σ σ σ σ σ σ − × − × − = = = × × × (2.1)
where , and are random variables with finite expectations of ( ), and ( ), finite variance ( ), and ( ) . If there are pairs of samples from variables, it calculates the population product moment correlation as follows:
1 , 2 2 1 1 ( ) ( ) ( ) ( ) N i i i x y N N i i i i x X y Y x X y Y ρ = = = − × − = − × −
(2.2) where: 1 1 N ( ) i i X x N = = ×
(2.3) 1 1 ( ) N i i Y y N = = ×
(2.4)Some of the results of equations (2.2), (2.3), (2.4) in some particular condition are as follows: • If , are independent, then: ( , ) = 0
• If , are linear dependent, i.e., = + , then: ( , ) = 1.
If the problem is not in the normal domain just in linear condition, it provides completely stochastic dependence; however, in non-linear states, it may cause some misleading. In other words, for two wind power generation, it cannot be introduced linearly because the distribution function is Weibull and the distribution is not linear. Therefore, it leads to introduce rank correlation [68].
In rank correlation, instead of measuring the correlation between the real amounts of random variables, the samples are ranked from lowest to highest, and then, the product moment correlation for responsive ranks is measured. In other words, the value of each sample is replaced by the value of its rank among other samples and product moment correlation is calculated using the ranks.
By using CDF to random variables, marginal distributions are transformed to rank. For example, authors in [69] transferred random variables of wind speeds, solar irradiance to a rank domain by using CDF transformation and stochastic dependence was examined. Moreover, for considering multivariate stochastic dependence, diagonal band copula, which will introduce later in this part, was applied.
In fact, through this method, dependence structure from marginal is decoupled, and the information of dependency between random variables is maintained in these ranks. Moreover, for multivariate distribution function Copulas are a function to couple them to their single dimensional margins [70]–[72].
As can be seen in Figure 2.2, it has different types including Sklar's theorem [73], Frechet-Hoeffding bounds, Gaussian Copulas, Normal Copula, Elliptical Copulas, Archimedean Copulas and Diagonal band Copula [69]. In [74], an integration of PV and wind turbines in a distribution network were studied using Archimedean copulas.
2.2.3 Multidimensional Dependence
Multidimensional dependence model has to be modelled based on available information. In this sense, joint normal transform (JNT) is suitable for a stochastic system with adequate information [75], which is an extension model of the normal copula. According to this model system correlation matrix is build.
Therefore, in multidimensional dependence method, the matrix should be semi-definite, which without it, it can be a problem for this method. To solve this problem, it is required to fill the matrix with positive semi-definiteness amounts and convert the matrix into a consistent one. In the case of lack of enough information and increasing the uncertainty or dimension, some methods like graphical model trees and vines [70] should be applied based on available information.
Another way for modelling high-dimensional Gaussian distributions is to simplify the multidimensional dependency model by a risk-averse model reduction technique [76]–[78]. It means that instead of making dependence between all random variables, risk-averse model is divided into groups which are called stochastic plants.
In Table 2.1, a summation of different mentioned methods for modelling stochastic nature of weather-dependent renewables in different articles are classified based on publication year. As can be seen, due to the accuracy of MCS and also since MCS gives more completed information about stochastic behaviour of the variables, the trend of using MCS is being boosted.
Table 2.1 Taxonomy of different methods for modelling renewables uncertainties. Year Po in t F ore ca st Qu an ti le F or e ca st For e ca st In te rv al De n sit y Fo re ca st Scenario Forecast
(Analytical Methods) Monte-Carlo Simulation
Pr od u ct M omen t Cor re la tio n R ank C or re la ti on Copu la Mu lt i-Dim en sio n al De pe n d en cy
FFTM MLSM PEM Wind Solar
2016 [40] [40] [76] 2015 [46] [52] [61][63] [62][63] [69] [75] 2014 [41] [53] [77] 2013 [47] 2012 [50] [54] [73] 2011 [45] [78] 2010 [48] [74] 2009 [49] [51] [58] [70] 2008 [43] [59] 2007 [35] 2006 [44] [68]
2.3 Uncertainty Tackling by Demand Side Flexibility
Demand side can participate to system flexibility to confront uncertainties raised from weather-dependent renewable sources. To this end, some measurements can be taken like shifting energy from high demand to low demand periods and lowering peak demand [39]. Growing of the communication facilities, advanced metering infrastructure (AMI) and internet-of-things (IoT), the potential of using demand flexibility integrated by renewable energy sources is going to be higher [79], [80].
The advantages of using DR include the ability to balance fluctuations in renewable generation, facilitate higher penetration of renewable sources on power systems, an increase in economic efficiency through the implementation of real-time pricing, and a reduction in generation capacity requirement, which are studied in [81].
However, there are some challenges faced DR including lack of experience and consequently need to employ huge assumption for modelling and evaluation sources. If a DR program is implemented successfully, an acceptable effect of DR in electricity price reduction can be revealed [82]. The existence of renewable energy sources can cause a reduction in electricity prices especially when wind production comes as an extra production to the system with zero marginal price and when there is a high CO2 tax for thermal generators in the market [83], [84].
Therefore, one of the other advantages of DR In these conditions and in pricing area is hedging cost reduction. As it will discuss in the next part, DR program has different types of implementation which according to the proposed usage can be applied, properly.
For compensation, the shortage power of weather-dependent renewable sources due to their inaccurate forecast, one of the DR programs is applied. One approach is providing direct control of customer; however, it is less acceptable for customers. According to [85], one of the best ways to get customers flexible is running a real-time pricing of electricity. It means that price-based elastic and load-shifting responses should be made. Moreover, authors have mentioned that using price-based elastic during low-wind events, peak demand in the UK may be reduced, significantly.
2.3.1 Various Demand Response Modelling
In this section, first the regular classification of DR programs is introduced, and then, some assumptions and models implemented by the literature in smart grids are discussed.
2.3.1.1 Demand Response Programs
There are some different DR programs which regarding the special utilization can be applied. Literature has classified DR programs in different ways; however, the most suitable and common ones are described in [13], [80], [86]–[88] where DR programs were classified into two categories including dispatchable and non-dispatchable, as can be seen in Figure 2.3.
In dispatchable DR programs, customers participate voluntarily in a special scheme for controlling customers appliances by operators [89]. For example, the operator can directly control the appliances like air conditioners during peak periods. Two methods in this category, including direct load control (DLC) and interruptible/curtailable service (I/C), are being used since long time ago [80].
In these aforementioned methods, operators make an incentive for reducing or curtailing the consumption of customer who has either contract (I/C method) or no contract (DLC) [87]. In emergency DR program (EDRP), customers need to respond only during the emergency period of time and operator pay customers in those time period. In the capacity market program (CMP), some customers offer a specific amount of load reduction in advance when the grid is in needs [88].
In demand bidding (DB) method, customers bid amount of load reduction in the wholesale market. In other words, customers identify how much load would like to curtail at a posted prices [86]. An ancillary service DR works as a reserve source. The customer can bid load curtailment in Independent System Operator (ISO) as an operating reserve, and if accepted, ISO pays customers for committing to be standby. In case that costumers capacity is needed, ISO calls them with spot market price [86].