1876-6102 © 2016 The Authors. Published by Elsevier Ltd. This is an open access article under the CC BY-NC-ND license (http://creativecommons.org/licenses/by-nc-nd/4.0/).
Peer-review under responsibility of the scientific committee of the Applied Energy Symposium and Forum, REM2016: Renewable Energy Integration with Mini/Microgrid.
doi: 10.1016/j.egypro.2016.11.286
Energy Procedia 103 ( 2016 ) 280 – 285
ScienceDirect
Applied Energy Symposium and Forum, REM2016: Renewable Energy Integration with
Mini/Microgrid, 19-21 April 2016, Maldives
A Hybrid Deep Learning Forecasting Model Using GPU
Disaggregated Function Evaluations Applied For
Household Electricity Demand Forecasting
Vitor N. Coelho
a,b,*, Igor M. Coelho
b,c, Eyder Rios
d, Alexandre S. T. Filho
e,
Agnaldo J. R. Reis
e, Bruno N. Coelho
b, Alysson Alves
b, Guilherme G. Netto
b,
Marcone J. F. Souza
fand Frederico G. Guimarães
gaGraduate Program in Electrical Engineering, Universidade Federal de Minas Gerais, Belo Horizonte, Brazil bInstituto de Pesquisa e Desenvolvimento de Tecnologias, Ouro Preto, Brazil
cDepartment of Computer Science, State University of Rio de Janeiro, Rio de Janeiro, Brazil dInstitute of Computer Science, Fluminense Federal University, Niteroi, Brazil
eDepartment of Control Engineering and Automation, Universidade Federal de Ouro Preto, Ouro Preto, Brazil fDepartment of Computer Science, Universidade Federal de Ouro Preto, Ouro Preto, Brazil gDepartment of Electrical Engineering, Universidade Federal de Minas Gerais, BeloHorizonte, Brazil
Abstract
As the new generation of smart sensors is evolving towards high sampling acquisitions systems, the amount of information to be handled by learning algorithms has been increasing. The Graphics Processing Unit (GPU) architectures provide a greener alternative with low energy consumption for mining big-data, harnessing the power of thousands of processing cores in a single chip, opening a widely range of possible applications. Here, we design a novel evolutionary computing GPU parallel function evaluation mechanism, in which different parts of time series are evaluated by different processing threads. By applying a metaheuristics fuzzy model in a low-frequency data for household electricity demand forecasting, results suggested that the proposed GPU learning strategy is scalable as the number of training rounds increases.
Keywords: Microgrid, Household Electricity Demand, Deep Learning, Graphics Processing Unit, Parallel forecasting model, Big Time-series Data
1. Introduction
Sometimes called as the hugest machine ever built, the power grid has been passing through several improvements. Researchers and the industry have been focusing on efficiently integrating Renewable Energy Resources (RER) into the grid. The massive insertion of RER is, usually, assisted by Artificial Intelligent (AI) tools [1].
The challenging task of making people's vision reality has been assisted by a new class of smart tools embedded on Smart Meters (SM) [2]. Smart in the sense that the modest use of sensors is being replaced by the ones fulfilled with computational abilities. In a common sense, these computational abilities are developed based on AI techniques or specific strategies envisioned by its creator/programmer. These class of meters are starting to talk [3] and introducing important information to be dealt by decision makers.
This paper tackles a mini/microgrid forecasting problem, the Household Electricity Demand Forecasting. Other low-frequency problems measured from RER, such as Wind Power Generation, can be tackled as future extension of the proposed framework. Embed the next generation of SM, also known as Soft Sensors, with forecasting abilities is a potential step towards efficient Smart Grid (SG) control and management. In special, machine learning techniques are being used to break down household energy consumption data into individual appliances. In our point of view, this information provided by house's independent devices opens a wide range of possibilities for enhancing mini/microgrid control. Researchers had begun to publicly release their data sets, such as the Reference Energy Disaggregation Dataset (REDD) [4], which provides low-frequency power measurements (3-4 second intervals) available for 10-25 individually monitored circuits.
Coelho et al. [5] recently introduced a Hybrid Fuzzy Model (HFM), calibrated through metaheuristics procedures, applied in a microgrid load forecasting problem with hourly samples. Motivated by the new class of big-data time series, which are reality in several areas (such as in the electric industry, biology, neuroscience, image processing, among others) we decide to enhance their model, designing a parallel function evaluation to work over a Graphics Processing Unit (GPU). Furthermore, HFM generic parameters matches the request for tackling Big Time-series Data, since the HFM model was designed as an automatic learning model, without magic numbers.
The use of GPU based architectures can provide a greener alternative with low energy consumption for mining information from such huge datasets [6]. Each GPU provides thousands of processing cores with much faster arithmetic operations than a classic Central Processing Unit (CPU). In a nutshell, we aim at generating ensemble GPU threads learning process, which provide independent forecasts, optimized in order to reduce a given forecasting statistical quality measure. The idea seams to fit the scope and design of the HFM, being, essentially, simple to be implemented and adapted to it, since the latter was based on metaheuristics and implemented in the core of the OptFrame [7].
In the remaining of this paper we introduce our GPU disaggregated forecasting process (Section 2), while the computational results and the analyzed parameters are presented in Section 3, finally, Section 4 draws some final considerations and possible extensions.
2. HFM with GPU disaggregated forecasting process
Let us consider a target time series ts = y1,..., yt, comprising a set of t observations. The goal is to
estimate the forecasts of a finite sequence {yt+1,..., yt+k}, with k indicating the number of steps ahead to be
predicted, namely forecasting horizon.
threads. Each thread runs an independent training, returning its predicted values for a given forecasting horizon k, a finite sequence of {ythread i+1,…, ythread i+k} forecasts, with tthread i א [1,...,t-k].
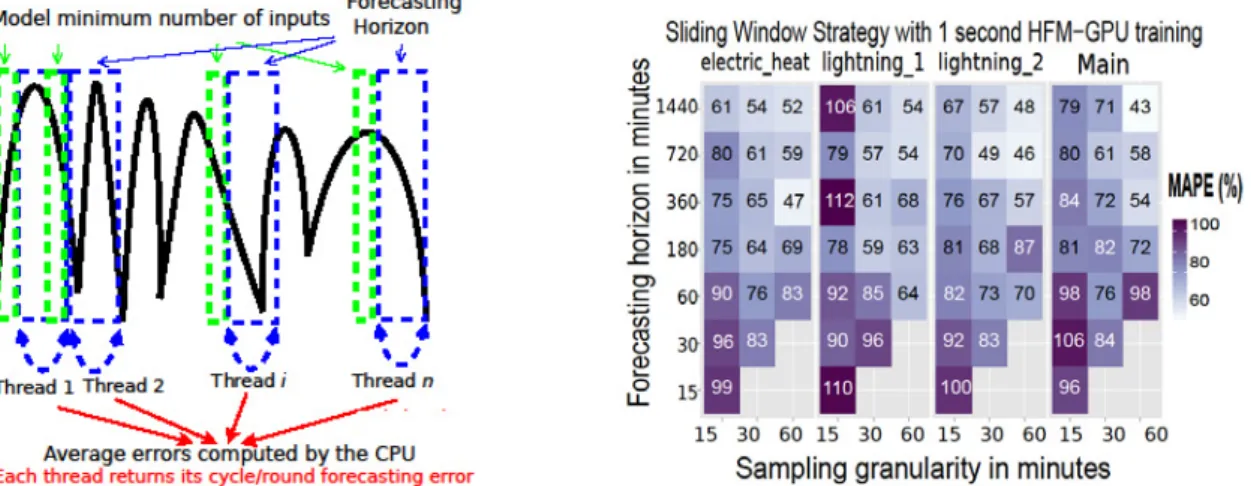
Figure 1: On the left side, the HFM with GPU disaggregated forecasting process can be seen. On the right side, MAPE for varying horizons and granularities with sliding window strategy, mentioned in Section 3.2
In special, the HFM requires a minimum number of tsmaxLag samples for feeding its model, thus the
green boxes limit model's minimum number of inputs. On the other hand, the blue boxes represents the forecasting horizon k to be predicted based on previous information. Each index tthread i points to the
beginning a blue box. The two boxes together should move along the whole tackled time series, as a sliding window strategy [10]. The sliding length is exactly the desired forecasting horizon. Thus, the blue box moves k samples ahead and, consequently, asking the green box to come together and to provide necessary inputs of the model.
3. Computational experiments
The REDD considered in this study provides low-frequency data for household electricity demand forecasting. Statistical analyzes of well-known forecasting models over this data set was done by Veit et al.[11]. Following their description, we extracted the data of house 1 from Apr 18th 2011 22:00:00 GMT to May 2nd 2011 21:59:00 GMT.
Four different time series are analyzed here: three different individually monitored circuits; and one of the two-phase mains input. Since the time series have several gaps, holes/breaks due to meters or sensors not providing measurements, they were interpolated. Each individual house component passed through linear interpolations in order to have a granularity of 1 second for each analyzed time series.
The tests were carried out on a computer Intel i7-4790K 4.00GHz, 16GB RAM, equipped with a NVIDIA GPU GTX TITAN X, 12GB of global memory, 3072 CUDA cores, compliant with Maxwell microarchitecture.
3.1. Speed up analysis
5, 10, 60, 360, 720, 1800, 3600 and 7200. Thus, the maximum forecasting horizon was 2 hours, the equivalent of 7200 seconds.
Following this design, the HFM model was fed with nSamples + k samples, allowing it to perform, at least, one training round for each configuration.
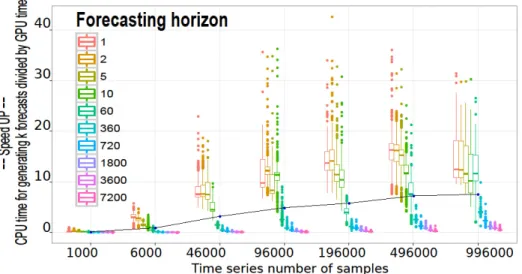
For each configuration, 1000 function evaluations were performed during the evolutionary process of the HFM. In general, each evaluation was related to a unique set of model's parameters. Figure 2 depicts a superimposed interactions plots using the ggplot2 R package. Time was measured with precision of millisecond (ms). Analyzing Figure 2, one can conclude that as the number of samples increases, GPU outperforms the CPU performance with a speedup of nearly 10 times. However we could also conclude that the disaggregated forecasting process is not suitable for small size time series. A similar conclusion could be reached for long forecasting horizons. However, we decide to look at the speed in a different way, thus, the Number of Training Rounds NTR related to each configuration was calculated. Basically, the NTR, also known as Number of Training Cycles, is equal to number of samples divided by the forecasting horizon.
Figure 2: Parallel forecasting model speed up using Titan X
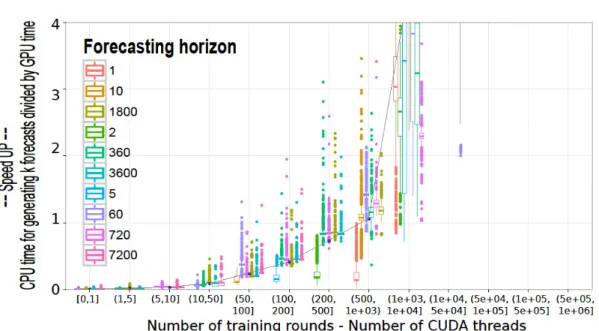
Thus, we calculated the NTR for each configuration, rounded it and cut into the following intervals: 0, 1, 5, 10, 50, 100, 200, 500, 1000, 10000, 50000, 100000, 500000 and 1000000. As can be noticed, the last three higher intervals were only executed for forecasting horizons with steps-ahead k equal to 1, 2 or 5.
Figures 3 and 4 show the new speed up interaction plots in relation to the NTR. In this case, a speedup of over 10 times is achieved, with the GPU being nearly 15 times faster than the CPU approach for a forecasting horizon considering one step ahead. In fact, by considering the gains on different training rounds it is possible to achieve a near exponential acceleration, which can be seen in Figure 4.
3.2. REDD dataset results with high granularities
Here, we report some initial results regarding a batch of 1 seconds training, following a similar branch of the experiments reported by Veit et al. [11]. As done by them, we run 18 different configurations, with granularities of 15, 30 and 60 minutes, covering seven different forecasting horizons of 1440, 720, 360, 180, 60, 30 and 15 minutes.
The sliding window strategy was used for, iteratively, training and testing the model. Thus, the data set was split into windows with a defined length (3 days + 3 days of tsmaxLag). Instead of setting the sliding
better performance. Since the proposed parallel processing strategy does not interfere with the quality of the prediction model, the convergence of the proposed parallel HFM model is guaranteed to follow the previously validated HFM model in literature.
Figure 3: Speed up according the number of CUDA threads
Figure 4: Specific range of speed up according the number of CUDA threads
4. Conclusions and future works
In this current study, a parallel time series forecasting framework was designed. The main core of our strategy was to split the time series through independent training parts, composed of k samples, namely forecasting horizon, plus the minimum number of inputs required by the metaheuristic hybrid fuzzy model of Coelho et al. [5]. The proposed GPU deep learning strategy appears to be scalable as the number of training rounds from the load time series increases, achieving up to 15 times speedup over a single threaded CPU implementation.
Exploring the fact that machine learning techniques can be used to break down household energy consumption data into individual appliances, we explored our proposal in public data set for energy disaggregation. The obtained results suggested that the proposal could be applied in the new generation of microgrid soft sensors, since its showed competitive performance in predicting the different house device's average consumption.
A possible extension is to explore novel designs for the parallel forecasting strategy applied in forecasting horizons higher than one (k 1). However, according model input, a high dependence on previous values can be expected. When the model requests inputs of low lags, values that had just been predicted should be feedback into the model, what generates a highly dependent computation (over previous values) that may not be easily explored by the GPU paradigm of Single Instruction Multiple Data. Exploring the advantages and disadvantages of those inputs on a parallel multi-step time series forecasting sounds a worth topic to be studied.
5. References
[1] K. W. Kow, Y. W. Wong, R. K. Rajkumar, R. K. Rajkumar, A review on performance of artificial intelligence and conventional method in mitigating PV grid-tied related power quality events, Renewable and Sustainable Energy Reviews 56 (2016) 334 - 346. [2] M. P. McHenry, Technical and governance considerations for advanced metering infrastructure/smart meters: Technology, security, uncertainty, costs, benefits, and risks, Energy Policy 59 (2013) 834 - 842
[3] R. Bertoldo, M. Poumadère, L. C. R. Jr., When meters start to talk: The public's encounter with smart meters in France, Energy Research & Social Science 9 (2015) 146 - 156, special Issue on Smart Grids and the Social Sciences.
[4] J. Z. Kolter, M. J. Johnson, Redd: A public data set for energy disaggregation research, in: Workshop on Data Mining Applications in Sustainability (SIGKDD), San Diego, CA, 2011.
[5] V. N. Coelho, I. M. Coelho, B. N. Coelho, A. J. Reis, R. Enayatifar, M. J. Souza, F. G. Guimarães, A self-adaptive evolutionary fuzzy model for load forecasting problems on smart grid environment, Applied Energy 169 (2016) 567 - 584.
[6] D. B. Kirk, W. H. Wen-mei, Programming massively parallel processors: a hands-on approach, Morgan Kaufmann, 2012. [7] I. M. Coelho, P. L. A. Munhoz, M. N. Haddad, V. N. Coelho, M. M. Silva, M. J. F. Souza, L. S. Ochi, A computational framework for combinatorial optimization problems, in: VII ALIO/EURO Workshop on Applied Combinatorial Optimization, Porto, 2011, pp. 51-54.
[8] N. Nedjah, L. Macedo Mourelle, High-performance hardware of the sliding window method for parallel computation of modular exponentiations, International Journal of Parallel Programming 37 (6) (2009) 537-555.
[9] M. J. Flynn, Some Computer Organizations and Their Effectiveness, IEEE Transactions on Computers C-21 (9) (1972) 948-960. [10] J. Fowers, G. Brown, P. Cooke, G. Stitt, A performance and energy comparison of FPGAs, GPUs, and multicores for sliding-window applications, in: Proceedings of the ACM/SIGDA, FPGA '12, ACM, New York, NY, USA, 2012, pp. 47-56.
[11] A. Veit, C. Goebel, R. Tidke, C. Doblander, H.-A. Jacobsen, Household electricity demand forecasting: Benchmarking state-of-the-art methods, in: Proceedings of the 5th ICFES, e-Energy '14, ACM, New York, NY, USA, 2014, pp. 233-234.
Biography