André Filipe Gonçalves Barreto
TOWARDS AN EARLY WEANING IN
SENEGALESE SOLE (SOLEA
SENEGALENSIS KAUP, 1858)
Universidade do Algarve
Master in Aquaculture and Fisheries
2017
André Filipe Gonçalves Barreto
TOWARDS AN EARLY WEANING IN
SENEGALESE SOLE (SOLEA SENEGALENSIS
KAUP, 1858)
Master in Aquaculture and Fisheries
Specialization in Aquaculture
Thesis supervision by:
Internal coordinator: Dr. Luís Eugénio da Castanheira Conceição, PhD
(Centro de Ciências do Mar - CCMAR e SPAROS Lda)
External coordinator: Dr. Wilson Gabriel Poseiro Coutinho Pinto, PhD
(SPAROS Lda)
Universidade do Algarve
Master in Aquaculture and Fisheries
2017
TOWARDS AN EARLY WEANING IN
SENEGALESE SOLE (SOLEA SENEGALENSIS
KAUP, 1858)
Declaração de autoria de trabalho:
Declaro ser o(a) autor(a) deste trabalho, que é original e inédito. Autores e
trabalhos consultados estão devidamente citados no texto e constam da
listagem de referências incluída.
Universidade do Algarve, 29 de Setembro de 2017
Copyright© André Filipe Gonçalves Barreto
A Universidade do Algarve reserva para si o direito, em conformidade com
o disposto no Código do Direito de Autor e dos Direitos Conexos, de
arquivar, reproduzir e publicar a obra, independentemente do meio
utilizado, bem como de a divulgar através de repositórios científicos e de
admitir a sua cópia e distribuição para fins meramente educacionais ou de
investigação e não comerciais, conquanto seja dado o devido crédito ao
autor e editor respectivos.
i
Acknowledgements
This thesis was supported by the project SOLEAWIN (31305/FEP/71), partially financed by the program PROMAR (Portugal) with FEDER funds.
I would like to acknowledge all the people that contributed to the successful completion of this Thesis.
Firstly, I would like to thank Dr. Luís Conceição (PhD) for giving me this opportunity and the privilege to have him as my coordinator.
I would like to sincerely thank Dr. Wilson Pinto (PhD) and acknowledge all the influence he had on this Thesis. I thank all the knowledge shared, all the support given and prompt availability he offered daily. His contribution to the success of this thesis was invaluable.
I would like to thank all the Sparos team for making me feel welcome, specially, André Santos for all the technical support in the laboratory and Vanda Chaveiro for all the help and company during the larval rearing phase.
iii
Abstract
This Thesis aimed to contribute towards an earlier weaning in Senegalese sole which currently starts at larvae 25 days after hatching (DAH) with good results. Two trials were conducted using different weaning strategies and microdiet formulations, targeting full weaning after larval settling (15 DAH). On the first trial, seven different treatments were tested: the control treatment was suddenly weaned at 25 DAH to a commercial diet, while the remaining six treatments were co-fed each a different microdiet and Artemia until full weaning at 23 DAH. Larvae achieved RGR values of around 12.4%.day-1, FCR values around 1.0 and survival between 56 to 79%, which are great improvements to results obtained by other authors in Senegalese sole weaning studies. WinFlat and NCAP (WinFlat variant with mixture of encapsulated and non-encapsulated taurine instead of the micronon-encapsulated version alone used in WinFlat) seem to be the most appropriate and cost effective microdiets used in this trial. The lowest growth performance was exhibited by the PH20 larvae that fed on a microdiet with increased inclusion levels of protein hydrolisates in relation to the commercial diet WinFlat. The control exhibited significantly inferior growth performances than all co-fed treatments, excluding PH20, and exhibited the lowest survival of all treatments. The results suggest that the use of a co-feeding regime is more appropriate when weaning larvae at such early stages of development. In the second trial, a total of seven different treatments were tested. All larvae were subject to a co-feeding regime, each with a different inert microdiet, until full weaning was performed at 19 DAH. Larvae achieved RGR values of around 11.1%.day-1, FCR values averaging 4.5 and survival between 45 to 61%. The overall growth results are superior to those obtained in the first trial at an approximate larval age and such good results had never been reported before. Nevertheless, the lowest survivals observed may be related to the more aggressive weaning strategy employed. The use of a mixture of encapsulated and non-encapsulated taurine instead of a microencapsulated version alone was beneficial to the larvae growth performance. The inclusion of the microalga Phaeodactylum tricornutum broken cells in the microdiets at an inclusion level of 10% produced superior growth performances than the commercial diet WinFlat. The inclusion of dietary tryptophan in WinFlat may enhance larvae growth performances. The use of a moist WinFlat variant, diluted in a 1:5 ratio, caused the larvae to exhibit inferior growth performances than all remaining treatments, probably due to insufficient nutrient intake. In conclusion, results from both
iv
trials conducted during this Thesis support that the age at which Senegalese sole currently starts to be weaned can be reduced from 25/30 DAH to 15 DAH. Nevertheless, results also suggest that improvements can still be made in weaning microdiets formulations and weaning strategies.
Keywords:
Senegalese sole, Solea senegalensis, early weaning, inert microdiets,v
Resumo
À medida que a população mundial continua a aumentar, a necessidade de fontes de alimento aumenta também. As pescas são a principal fonte de produtos aquáticos mas a produção tem estagnado. A aquacultura é vista como uma potencial alternativa e tem sofrido uma grande expansão nos últimos anos. O sector europeu de aquacultura também se expandiu mas produz poucas espécies de peixe. O salmão do Atlântico (Salmo salar Linnaeus, 1758), o robalo (Dicentrarchus labrax Linnaeus, 1758) e a dourada (Sparus aurata Linnaeus, 1758) são as espécies mais produzidas e enfrentam uma tendência para saturação de mercado. Tal como a maioria dos países europeus, Portugal também produz um número de espécies reduzido. A necessidade de diversificar a produção levou a que esforços estejam a ser feitos para encontrar novas espécies que possam aumentar a diversidade das espécies produzidas. Entre estas espécies, o linguado (Solea senegalensis Kaup, 1858) é visto como um dos principais candidatos para a diversificação da indústria de aquacultura. Esta espécie apresenta um valor comercial elevado e as suas capturas em mar estão a diminuir. Esforços de investigação nos últimos anos levaram a que a produção atingisse sucesso comercial nos países do Sul da Europa. Muitos avanços foram feitos em elementos chave da produção, tais como regime de temperatura, fotoperíodos e densidades nos tanques. No entanto, muitos esforços de investigação ainda se focam nas primeiras fases de desenvolvimento das larvas, já que a condição nutricional destas pode ter efeitos na qualidade dos juvenis. Alimentos vivos são usualmente usados nas primeiras fases de desenvolvimento mas estes podem trazer desvantagens, tais como, actuarem como vectores de bactérias patogénicas, terem valores nutricionais variáveis e a sua produção ser complicada e dispendiosa. Consequentemente, esforços têm sido feitos visando o desenvolvimento de microdietas inertes que permitam a total substituição dos alimentos vivos. O desmame, a transição dos alimentos vivos para as dietas inertes, é uma fase muito importante na produção. O período do desmame no linguado era considerado problemático até ao final dos anos 1990 devido a mortalidades elevadas e taxas de crescimento baixas. Apesar de os resultados ainda serem variáveis, os desenvolvimentos que ocorreram nas condições zootécnicas na fase pelágica e na qualidade das microdietas inertes permitem às larvas chegar ao desmame num estado nutricional bastante mais elevado, o que tem permitido reduzir progressivamente a importância dos alimentos vivos nos protocolos de desmame no Linguado. Esta Tese teve como
vi
objectivo contribuir para um desmame mais precoce no Linguado, que neste momento se inicia aos 25 dias após eclosão (DAE) das larvas com bons resultados. Duas experiências foram realizadas usando diferentes estratégias de desmame e formulações de microdietas, focadas no desmame total das larvas após estas se tornarem organismos bentónicos (cerca dos 15 DAE). Na primeira experiência, sete tratamentos diferentes foram testados: no tratamento controlo, a transição para alimento inerte foi feita abruptamente aos 25 DAE usando uma dieta comercial, enquanto os restantes seis tratamentos foram co-alimentados com uma microdieta (diferente para cada tratamento) e Artemia até desmame total aos 23 DAE. As larvas atingiram valores de RGR (taxa de crescimento relativo) à volta dos 12.4%.dia-1, valores de FCR (taxa de conversão alimentar) à volta de 1.0 e sobrevivências entre 56 e 79%, resultados que são grandes melhorias em relação aos obtidos por outros autores em estudos de desmame do linguado. As dietas usadas nesta experiência mais apropriadas e com um melhor custo-beneficio foram a dieta comercial WinFlat e a NCAP (variante de WinFlat com mistura de taurina encapsulada e não encapsulada, ao invés de apenas taurina microencapsulada usada no WinFlat). A performance de crescimento mais baixa foi exibida pelo tratamento PH20 que foi alimentado com uma microdieta com níveis de hidrolisados proteicos mais elevados dos que os que são encontrados na dieta comercial WinFlat. O controlo exibiu performances de crescimento significativamente inferiores aos tratamentos que foram co-alimentados, excluindo o PH20, e exibiram a sobrevivência mais baixa de todos os tratamentos. Os resultados obtidos sugerem que o uso de um regime de co-alimentação é mais apropriado quando se efectuam desmames em etapas de desenvolvimento das larvas tão precoces. Na segunda experiência, um total de sete tratamentos diferentes foram testados. Todas as larvas foram co-alimentadas, cada com uma microdieta diferente, até ao desmame total efectuado aos 19 DAE. As larvas atingiram valores de RGR à volta dos 11.1%.dia-1; valores de FCR à volta de 4.5 e sobrevivências entre 45 to 61%. Os resultados de crescimento foram superiores aos obtidos na primeira experiência em idades de desenvolvimento larval aproximadas. Nunca foram reportados resultados de crescimento similares. Os valores de sobrevivência foram, no entanto, mais baixos, o que pode estar relacionado com o uso de uma estratégia de desmame mais agressiva. O uso de uma mistura de taurina encapsulada e não encapsulada, ao invés da versão apenas com taurina microencapsulada foi benéfico para a performance de crescimento das larvas. A inclusão de células da microalga Phaeodactylum tricornutum com a parede celular
vii
destruída em níveis de inclusão de 10% na microdieta produziu performances de crescimento superiores que a dieta comercial WinFlat. A inclusão de triptofano na microdieta WinFlat pode ter tido efeitos positivos na performance de crescimento das larvas. O uso de uma variante húmida de WinFlat, diluída numa proporção de 1:5, produziu performances de crescimento das larvas inferiores às observadas nos restantes tratamentos, provavelmente devido a absorções de nutrientes insuficientes. Em conclusão, os resultados das duas experiências realizadas durante esta Tese suportam a possibilidade de reduzir a idade de início de transição para alimentos inertes no linguado de 25/30 DAE para 15 DAE. No entanto, os resultados também sugerem que ainda podem ser realizadas melhorias nas formulações das microdietas de desmame e nas estratégias de desmame.
Palavras-chave:
Linguado, Solea senegalensis, desmame precoce, microdietasviii
Table of contents
Acknowledgements………i Abstract………iii Resumo……….v Table of contents………...viii List of figures……….x List of tables……….xi List of abbreviations………xii 1. Introduction………...11.1. Aquaculture industry overview………..2
1.2. Aquaculture in Portugal……….3
1.3. Senegalese sole………..4
1.4. Senegalese sole weaning………5
1.5. Larval nutritional requirements and feed intake………7
1.6 Objectives………...8
2. Trial 1 – Targeting full weaning after settlement on Senegalese sole larvae………..10
2.1. Materials and methods……….11
2.1.1. Dietary treatments………11
2.1.2. Fish rearing………...13
2.1.3. Sampling………..15
2.1.3.1. Growth performance, survival and feeding efficiency……….15
2.1.3.2. Feed intake………15
2.1.4. Data analysis………16
2.2. Results………..17
2.2.1. Growth performance, survival and feeding efficiency……….17
ix
2.3. Discussion………...23
3. Trial 2 – Effects of different weaning microdiets on the performance of newly settled Senegalese sole larvae……….29
3.1. Materials and methods……….30
3.1.1. Dietary treatments………30
3.1.2. Fish rearing………...30
3.1.3. Sampling………..31
3.1.3.1. Growth performance, survival and feeding efficiency……….31
3.1.3.2. Feed intake………32
3.1.4. Data analysis………32
3.2. Results………..32
3.2.1. Growth performance, survival and feeding efficiency……….32
3.2.2. Feed intake………...35 3.3. Discussion………36 4. Final conclusions……….41 5. Bibliography………43 6. Annexes………...48 6.1. Annex 1………49 6.2. Annex 2………50 6.3. Annex 3………51
x
List of figures
Figure 1 – Experimental design used in Trial 1………..………12 Figure 2 – Dry weight of Senegalese sole larvae reared under different dietary treatments in Trial 1………...18 Figure 3 – Ingestion or no ingestion. Senegalese sole larvae ingestion pattern of different experimental labeled feeds offered at 19 DAH in Trial 1……….…20 Figure 4 – Amounts of labeled feed ingested in relation to bodyweight by Senegalese sole larvae fed different experimental microdiets at 19 DAH in Trial 1…………...…..20 Figure 5 – Ingestion or no ingestion. Senegalese sole larvae ingestion pattern of different experimental labeled feeds offered at 25 DAH in Trial 1……….21 Figure 6 - Amounts of labeled feed ingested in relation to bodyweight by Senegalese sole larvae fed different experimental microdiets at 25 DAH in Trial 1……….21 Figure 7 - Ingestion or no ingestion. Senegalese sole larvae ingestion pattern of different experimental labeled feeds offered at 40 DAH in Trial 1……….22 Figure 8 - Amounts of labeled feed ingested in relation to bodyweight by Senegalese sole larvae fed different experimental microdiets at 40 DAH in Trial 1……….23 Figure 9 – Dry weight of Senegalese sole larvae reared under different dietary treatments in Trial 2……….33 Figure 10 - Ingestion or no ingestion. Senegalese sole larvae ingestion pattern of different experimental labeled feeds offered at 25 DAH in Trial 2……….35 Figure 11 - Amounts of labeled feed ingested in relation to bodyweight by Senegalese sole larvae fed different experimental microdiets at 25 DAH in Trial 2……….36
xi
List of tables
Table 1 – Proximal nutritional composition of the diets used in Trial 1………11 Table 2 – Daily routines used during the co-feeding period in Trial 1……….…..14 Table 3 – Daily routines used after weaning was performed in Trial 1……….….14 Table 4 – Senegalese sole larvae DW values observed throughout the course of Trial 1………...17 Table 5 – Senegalese sole larvae TL values observed throughout the course of Trial 1………...…18 Table 6 – Senegalese sole larvae FCR, RGR and K values obtained at larvae 40 DAH in Trial 1………..19 Table 7 – Senegalese sole larvae FCR, RGR, K and survival values obtained at the end of Trial 1………..…19 Table 8 – Senegalese sole larvae DW values observed throughout the course of Trial 2………...33 Table 9 – Senegalese sole larvae TL values observed throughout the course of Trial 2………...34 Table 10 - Senegalese sole larvae FCR, RGR, K and survival values obtained at the end of Trial 2………..35 Table 11 – Estimated total daily amount of frozen enriched Artemia and inert microdiets given from 16 to 24 DAH in Trial 1………..49 Table 12 - Estimated total daily amount of inert microdiets given after weaning in Trial 1………...50 Table 13 - Estimated total daily amount of frozen enriched Artemia, inert microdiets and moist microdiets given in Trial 2……….……….51
xii
List of abbreviations
AA: Amino acid
DAH: Days after hatching
DGRM: Direcção Geral de Recursos Naturais, Segurança e Serviços Marítimos DW: Dry weight
FAA: Free amino acid
FAO: Food and Agriculture Organization of the United Nations FCR: Feed conversion ratio
FEAP: Federation of European Aquaculture Producers FIFO: Fish in fish out ratio
HUFA: Highly unsaturated fatty acids INE: Instituto Nacional de Estatística RGR: Relative growth rate
Tau: Taurine TL: Total length Trp: Tryptophan
1
2 1.1. Aquaculture industry overview
As the world population continues to expand the demand for food sources is increasing as well. Regarding aquatic food products, fisheries captures played a big role in meeting these demands for a long time but the production has stagnated. This stagnation is occurring both due to the depletion of wild stocks and an increasing ecological awareness by governments all around the world, which are forced to legally restrict catches. Given this fact, the emergence of an alternative that can complement fisheries in the production of aquatic food urges. Aquaculture is perceived as having the potential to fulfill this role, currently being the fastest growing animal food production sector (FAO, 2016).
According to FAO (2016), in 2014, the world aquaculture animal production continued to grow and reached a total of 73.8 million tonnes, which accounted for 44.1 percent of the world total fish production. Almost all fish produced in aquaculture is destined for human consumption, although by-products may be used for non-food purposes, such as the production of fish oil and fish meal. Nevertheless, the development in the aquaculture industry has been extremely important in the supply of fish for human consumption, and for the first time in 2014, it supplied more fish than capture fisheries.
Aquaculture production still has a highly uneven distribution and unbalanced development status. Asia countries are still the major producers, responsible for 88.9 percent of the world’s total production (FAO, 2016). Despite the extensive expansion over the last decades, the European aquaculture production shares have been gradually declining over the last few years and accounted for 3.9 percent of the global production in 2014 (FAO, 2016). European producers have to compete with producers from countries in which the production costs are lower due to greater production scales, lower labor costs, but also lower quality standards (DGRM, 2014). Nevertheless, Norway still is one of the world’s biggest producers, having produced 1.37 million tonnes in 2014, which represents 60.9 percent of the total European aquaculture production (FEAP, 2015; FAO, 2016). Despite having a small global representation, the European aquaculture industry is characterized by state of the art technology and feed production knowledge (DGRM, 2014). The European aquaculture sector has grown but it is still producing few species. The Atlantic salmon (Salmo salar Linnaeus, 1758), the European seabass (Dicentrarchus labrax Linnaeus, 1758) and gilthead seabream (Sparus aurata Linnaeus, 1758) are the most produced ones and are facing market
3
saturation. Therefore efforts are being made to find new species that can improve diversity and ensure sustainable industry development (DIVERSIFY, 2016). Some emerging species in European aquaculture are the Senegalese sole (Solea senegalensis Kaup, 1858) (Morais et al., 2016), meagre (Argyrosomus regius Asso, 1801), the greater amberjack (Seriola dumerili A. Risso, 1810), the wreckfish (Polyprion americanus Bloch & Schneider, 1801), the atlantic halibut (Hippoglossus hippoglossus Linnaeus, 1758) the grey mullet (Mugil cephalus Linnaeus, 1758) and the pikeperch (Sander
lucioperca Linnaeus, 1758) (DIVERSIFY, 2016).
1.2. Aquaculture in Portugal
Portugal has always been a country deeply connected to the sea. According to FAOSTAT, Portugal is the first country in the European Union and fourth country in the world with highest fish consumption per capita, reaching 57 kg per year. Due to its geographic location and its extensive coastline, Portugal has a wide range of habitats, being considered a rich area in biological terms, which gives fisheries and aquaculture activities great potential (DGRM, 2014). However, fisheries production is facing growing difficulties to meet the market demands, while aquaculture production is still small and undiversified to have a significant supplier role (DGRM, 2014).
Marine aquaculture in Portugal started as an added value to the traditional salt industry, producing fish on small scale extensive systems. After joining the European Union in 1986, aquaculture industry suffered great developments as a result of the funding received. Most of those production systems evolved to semi-intensive and intensive systems. It was not only until the 1990’s that aquaculture had its biggest growth. Still, and although it is possible to see nowadays a few intensive fish farms in the coastline, the Portuguese aquaculture sector is still mainly composed by small and family-based businesses (DGRM, 2014).
Portuguese aquaculture produced a total of 10.8 thousand tonnes of fish in 2014, which is only around 8% of the total production, while wild fish caught represent around 92% (INE, 2016). Only five fish species are currently being produced in a significant manner: turbot (Psetta maxima Linnaeus, 1758; 2.7 thousand tonnes), gilthead seabream (1.5 thousand tonnes), rainbow trout (Oncorhynchus mykiss Walbaum, 1792; 1 thousand tonnes), European seabass (500 tonnes), and Senegalese sole (60 tonnes) (FEAP, 2015). The remaining production is extensive production of clams and oysters.
4 1.3. Senegalese sole
Senegalese sole (Solea senegalensis Kaup, 1858) is a flatfish from the Soleidae family that inhabits sandy or muddy bottoms throughout the Atlantic and Mediterranean, from the Golf of Biscay to Senegal coasts, which feeds mainly on benthonic invertebrates, such as polychaets and bivalves (Whitehead, 1986). It is a gonochoric species that matures after 3 years of age, at around a total length of 32 cm (Dinis et al., 1999). The spawning season occurs naturally during Spring, from March to April/May and in September, a second shorter period may occur. In farming conditions, eggs may be obtained from natural spawns of wild broodstocks kept in captivity (Dinis et al., 1999) although induced spawning by manipulation of photoperiod and water temperature has been successfully achieved, leading farms to control Senegalese sole spawning according to production requirements (Wilson Pinto, personal communication). Temperature plays a big role in the spawning season because egg emission stops below 16ºC (Dinis et al., 1999). The eggs start to hatch after 36 to 48 hours, depending on the water temperature, which can vary between 16 and 18ºC (Dinis et al., 1999; Engrola, 2008). The newly hatched larvae are pelagic and have bilateral symmetry, measuring around 2.4 mm. Exogenous feeding starts at 2 DAH (days after hatching) when the larvae measure around 3.4 mm (Dinis et al., 1999). Although Senegalese sole larvae can feed upon Artemia nauplii at first feeding, enriched rotifers are usually the first prey for a few days (Dinis et al., 1999; Imsland et al., 2003; Conceição et al., 2007). The larvae undergo an accentuated metamorphosis climax which usually starts at 11 DAH and is completed by 19 DAH (Dinis et al., 1999). This metamorphosis is characterized by a 90º rotation of the body, a migration of the left eye and a reorganization of the internal organs, resulting in a benthonic postlarva (Ribeiro et al., 1999a; Fernández-Díaz et al., 2001).
Senegalese sole has been receiving a lot of attention lately and is a prime candidate to have a role in the diversification of the European aquaculture industry, particularly in Spain and Portugal. It has a high market value and demand due to its flesh quality and decreasing number of wild catches (Imsland et al., 2003; Makridis et al., 2009; Dâmaso-Rodrigues et al., 2010; Morais et al., 2016). Research efforts over the last years led Senegalese sole production to reach commercial success in southern Europe. The expansion signs in the species culture have been so important that it attracted substantial investment to intensify production. Many advances were made in key elements of production, such as temperature regime, photoperiod and stocking
5
densities. It was not long ago that Senegalese sole production was made in salt marshes as an added value product to semi-intensive polycultures of seabream and seabass. These fish would rely on the natural productivity of the ponds and, consequently, production was very variable. Nowadays, culture is made in more intensive systems with much more controlled environments and using commercial feeds. In 2015, Spain was the main producer of Senegalese sole, with 664 tonnes, followed by France, Portugal and Iceland which produced around 330 tonnes, 180 and 100 tonnes, respectively (APROMAR, 2016). Some new farms are now using a recirculation aquaculture system which has been an important technological development to the production of the species. This type of system enables a better control of the environmental conditions which often reflects in increased growths and survival (Morais et al., 2016).
1.4. Senegalese sole weaning
With culture protocols for Senegalese sole juveniles established and relatively standardized, research is mainly focused in the first life stages, since nutritional conditions of larvae may have strong effects on the quality of juveniles (Morais et al., 2016). Live feeds are usually given in the first live stages but they can have disadvantages such as acting as vectors of pathogenic bacteria, having variable nutritional values, as well as, being expensive, labour-intensive and complicated to culture (Ribeiro et al., 2005; Hamre et al., 2013). Consequently, a lot of effort has been employed in the development of microdiets (inert diets with small granulometry) that can fully replace live feeds in fish first developmental stages (Cañavate and Fernández-Díaz, 1999; Ribeiro et al., 2005; Engrola et al., 2008; Pinto et al., 2010).
Weaning, the transition from live feeds to an inert diet, is an extremely important phase in production. The early introduction of inert diets without live feeds may have negative effects on larvae survival and growth (Robin and Vincent, 2003; Fletcher et al., 2007; Parma et al., 2013), which may be caused by low ingestion rates, poor nutrient digestion and absorption (Fletcher et al., 2007). Although diets that can replace live feeds are currently widely used in fish larviculture and promising results have been obtained in weaning experiments in many species (Hamre et al., 2013), little is known about the nutritional requirements of marine fish larvae (Holt, 2011) (see section 1.5). Lately, research efforts led to the development of weaning protocols and to improvements on the formulated microdiets quality. Microdiets are designed focusing
6
on several objectives depending on the weaning strategy, which normally is to partially or completely replace live feeds from first feeding or at a given young age. These microdiets need to have several structural and biochemical characteristics to create a compromise between stability in the water and nutrient digestibility. First, these microdiets need to meet the energetic and nutritional requirements for larval growth and development. Secondly, the feed particles must be stable enough to avoid disintegration after immersion in water and feed formulation must ensure the retention of water soluble micronutrients. Leaching of these micronutrients is common in microdiets due to a high surface/volume ratio. Lastly, the particles need to have the right diameter so the larvae can identify them as feed and ingest them. Also, they have to be digestible by the larval digestive system since most marine fish hatch with an immature digestive system (Hamre et al., 2013). Senegalese sole lacks of a functional stomach at first feeding which implies a high dependence from the pancreatic enzymes, like trypsin, lipase and amylase, for digestion (Ribeiro et al., 1999a). Acid digestion is only achieved when the gastric glands become functional several weeks after first feeding (Ribeiro et al., 1999b). Nevertheless, pancreatic digestive enzyme activity may not be enough for a complete feed hydrolisys. Since dietary protein have a primary relevance, inclusions of low to medium levels of protein hydrolisates, which are pre-digested proteins mostly containing low molecular weight peptides, in fish larvae weaning diets have been shown to improve survival and growth. In European seabasss and cod (Gadus morhua), the inclusion of protein hydrolisates has been shown to improve survival (Cahu et al., 1999; Kvåle et al., 2009) and both survival and growth in common carp (Cyprinus carpio) (Carvalho et al., 2004). It has been proposed that inert diets rich in protein hydrolisates may be used in earlier stages of larvae development, and can have a positive effect on the maturation of the digestive tract of Senegalese sole larvae when used in a co-feeding regime (Engrola et al., 2009a). According to Canada (2016), optimal protein quality seems to change during Senegalese sole larval development: Inclusion of moderately hydrolyzed protein improves growth in early larval stages, while larger peptides and intact protein seem to be more suitable to sole post-larvae and young juveniles. Although not built into protein, taurine is part of the free amino acid (FAA) pool and is used for cell volume regulation and bile salt synthesis, among other functions (Hamre et al., 2013). In Senegalese sole, higher taurine levels lead to increased retention of protein in the larval body and accelerates metamorphosis completion (Pinto et al., 2010).
7
The weaning period in Senegalese sole larvae was historically problematic due to high mortalities and low growth rates and was considered one of the major bottlenecks in the species farming until the late 1990’s (Dinis et al., 1999; Conceição et al., 2007). Although the weaning results are still variable, the developments made in zootechnical conditions and inert microdiets quality allow the larvae to reach the weaning phase in a much better nutritional state and have allowed to progressively reduce the importance of live feeds in Senegalese sole weaning protocols (Pinto et al., 2015).
Currently, two different weaning strategies are used: sudden weaning and co-feeding with Artemia until full weaning. The choice of co-feeding strategy to adopt should be based on post-larvae weight since it is a better indicator of larval nutritional status than age (Engrola et al., 2007). In pelagic or small post-larvae below 1 mg of dry weight, a co-feeding regime with low Artemia replacement seems to present better results and improve post-larval quality (Engrola et al., 2009a; Engrola et al., 2009b). Additionally, co-feeding with live feeds and inert diets may condition the larvae to more readily accept the manufactured diets when live feed is removed a avate and Fern ndez-D az, 1999 . However, in larvae with a dry weight between 5 and 10 mg sudden weaning should be performed (Engrola et al., 2007). Nevertheless, it is paramount the larvae are in very good nutritional condition prior to sudden weaning (Pinto et al., 2015). It is the strategy that further progressed during the last decades, with the age of sudden weaning advancing over the years. In the 1990’s, weaning was done at 60 DAH, while in 2010, weaning at 40 DAH was achieved. Nowadays, it is possible to achieve survivals close to 100% and growth around 10% per day by weaning between 25 and 30 DAH. While until 2010, Senegalese sole reached mean wet weights of 1g at 90 DAH in best case scenarios, nowadays, it is possible to obtain that at 70 DAH (Pinto et al., 2015).
1.5. Larval nutritional requirements and feed intake
The larvae nutritional requirements may differ from those of juveniles or adult fish, since fish undergo extreme morphological and physiological changes during ontogenesis (Hamre et al., 2013). Current knowledge of nutrition in early stages is based on experimental laboratory studies carried out using artificial conditions based on limited prey types and relatively constant abiotic and biotic conditions (Hamre et al., 2013). Nutritional requirement studies are few, mainly due to the lack of appropriate
8
diets that can be used for the purpose. Nutrient concentrations in live feeds may be difficult to control and formulated feeds have technical limitations, such as high leaching rates and low digestibility. Additionally, marine fish larvae are extremely vulnerable in the first stages of development and require specific conditions to survive, develop and grow properly (Hamre et al., 2013). This lack of knowledge in fish larval nutritional requirements is one of the main causes for high mortalities and quality problems commonly observed in marine larviculture (Conceição et al., 2010). Research efforts focused on overcoming this knowledge gap contributed to the appearance of several methods for measuring larval nutrient requirements and have been reviewed in detail by Hamre et al. (2013). Alongside understanding those requirements, knowledge on feeding behavior and the factors that modulate feed detection, acquisition and processing is also extremely important for the development of diets and feeding protocols in larviculture (Rønnestad et al., 2013). Feed intake greatly impacts larval growth and development, as it determines the amount of nutrients the larvae can use for the high structural and energy demands of rapid growth and organogenesis (Hamre et al., 2013). Methods that determine feed intake in fish can be used to infer important aspects regarding diet adequacy, namely, palatability and nutritional value. Nevertheless, most developed methods are essentially used in juvenile fish studies and their application to fish larvae may not be appropriate or even possible due to biological and technical constrains (Conceição et al., 2007; Bonacic et al., 2016). Therefore, the development of a method that would reliably determine feed intake in fish larvae would be an extremely important tool to evaluate the adequacy of ingredient formulations on fish larval diets, which would ultimately aid in the transition from live feeds to inert diets.
1.6. Objectives
This Thesis aims to contribute towards an earlier weaning in Senegalese sole, which may currently be started at larvae 25 DAH with good results. For this purpose, two trials were conducted using different weaning strategies and microdiet formulations, targeting a partial or, if possible, full weaning immediately after larval settling (15 DAH). Commercial weaning diets for Senegalese sole and other species were tested, as well as new prototypes focusing on the improvement of fish performance. Several parameters were analyzed, focusing on larval growth, survival and feeding efficiency. The adequacy of the microdiets for Senegalese sole larvae during
9
settling was assessed using a feed intake method that has been developed by Sparos Lda.
10
2. Trial 1 – Effects of different weaning
microdiets on the performance of newly
settled Senegalese sole larvae
11
2.1. Materials and methods
2.1.1. Dietary treatments
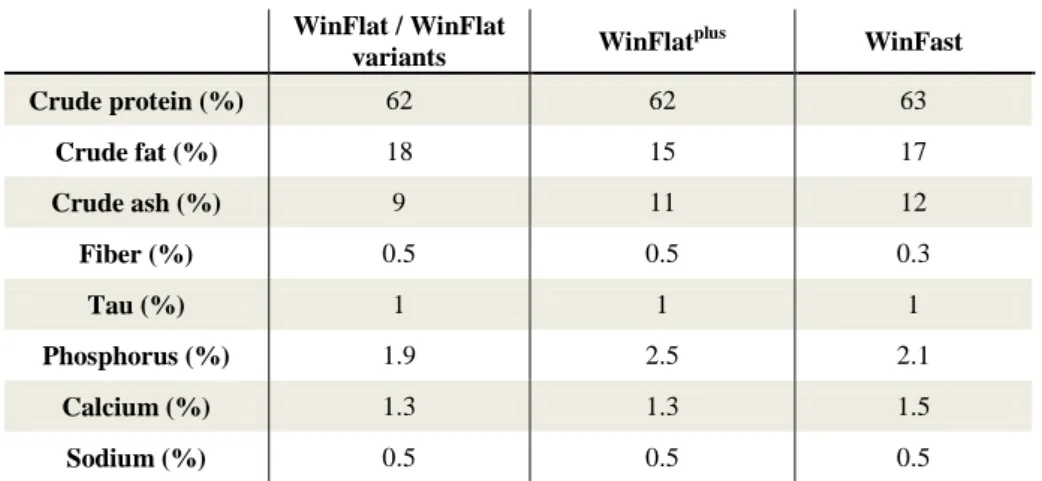
In trial 1 a total of seven different dietary treatments were tested: Control, NCAP, Flat, Plus, Fast, nPea and PH20. These were randomly distributed by the rearing tanks used in triplicates (Control, NCAP, nPea and PH20) and quadruplicates (Flat, Plus and Fast). The inert microdiets used were Sparos Lda commercial diets WinFlat, a cost-effective microdiet for flatfish; WinFlatplus, a premium microdiet for flatfish; WinFast, formulated for fast growing species such as meagre, cobia (Rachycentron canadum Linnaeus, 1766) and the greater amberjack; and three WinFlat experimental variants. The WinFlat variants used differed in the ingredient formulation but had similar proximal compositions to WinFlat (Table 1). In NCAP, a mixture of encapsulated and non-encapsulated taurine was used instead of the microencapsulated version alone used in WinFlat; in nPea, the pea protein concentrate was substituted by other sources of protein of marine and vegetable origin; and in PH20, the amount of protein hydrolisates used was 20%, higher than what is found in WinFlat (10 to 15%).
Table 1 –Proximal nutritional composition of the diets used in Trial 1. WinFlat / WinFlat variants WinFlat plus WinFast Crude protein (%) 62 62 63 Crude fat (%) 18 15 17 Crude ash (%) 9 11 12 Fiber (%) 0.5 0.5 0.3 Tau (%) 1 1 1 Phosphorus (%) 1.9 2.5 2.1 Calcium (%) 1.3 1.3 1.5 Sodium (%) 0.5 0.5 0.5
For each diet, a fluorescent labeled version was also produced to be used for feed intake analysis. In these variants, an hydrophobic fluorescent dye was added at a 1% concentration to the diet composition, following procedures by Pereira (2016). This feed intake method developed by Sparos Lda allowed to evaluate inert microdiet acceptance by calculating the ingestion of each inert microdiet at various developmental stages. All diets were produced at Sparos Lda facilities (Olhão, Portugal) using extrusion at low temperatures as main production process, as follows: powder ingredient mixing according to target formulation using a double helix mixer; grinding
12
in a micropulverizer hammer mill (SH1, Hosokawa-Alpine, Germany); addition of the oil fraction; humidification and agglomeration through low temperature extrusion (Dominioni Group, Italy); drying of resultant pellets in a convection oven(OP 750-UF, LTE Scientifics, United Kingdom) for 4 h at 60ºC, crumbling (Neuero Farm, Germany) and sieving to desired size ranges.
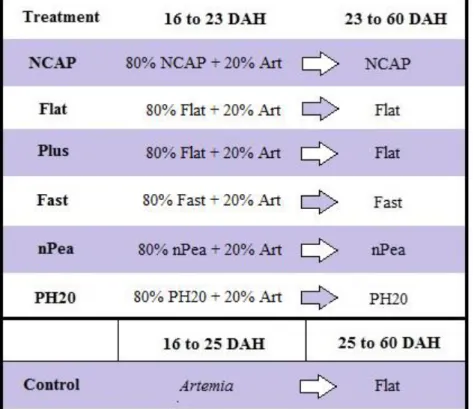
Two different weaning strategies were used: sudden weaning for the control and co-feeding for the remaining treatments. Larvae from the control were fed exclusively frozen enriched Artemia until they were suddenly weaned to inert microdiets at 25 DAH, following the procedures used by Pereira (2016). Larvae from the remaining treatments were initially co-fed frozen enriched Artemia and inert microdiets in a 20% to 80% respective proportion and were fully weaned at 23 DAH. Full weaning was performed as soon as visual inspection of the larval guts confirmed an adaption to the inert microdiet. The inert diets used for each treatment and the period in which they were used are shown in Figure 1. The inert diet granulometry used changed according to fish age as follows: 16 to 24 DAH, 200-400 µm; 25 to 54 DAH, 400-600 µm; 55 to 60 DAH, 600-800 µm.
Figure 1 – Experimental design used in Trial 1. During the co-feeding period (16 to 23 DAH) Art (frozen enriched Artemia) and inert microdiets were supplied in a 20% to 80% proportion. Flat (WinFlat microdiet), Plus (WinFlatplus microdiet) and Fast (WinFast microdiet) – commercial diets by Sparos Lda; NCAP, nPea and PH20 – experimental variants of WinFlat.
13 2.1.2. Fish rearing
Trial 1 was conducted at Sparos Lda research facilities (Olhão, Portugal) and had a duration of 44 days, where Senegalese sole larvae, originated from SEA8’s hatchery Safiestela (Póvoa de Varzim, Portugal), were reared from 16 DAH to 60 DAH. Upon arrival, the larvae were randomly distributed in 24 tanks with 8L each previously prepared with clean seawater and aeration. Larval density was kept in each tank at 2650 larvae/m2. These were kept under a natural daily photoperiod, but light intensity was kept to a minimum to promote feed ingestion (Navarro et al., 2009). The tanks were part of a semi-open recirculating system. The amount of external seawater input in the system was kept at a total of 3.2 system water volume renewals per day. Water renewal in each tank was kept at 4 renewals per hour. The system and tanks water renewals were adjusted when needed according to the amount of nitrogen compounds found in the water, in order to keep them to a minimum. The water parameters were measured and recorded daily using commercial probes. Temperature was maintained at 20.1 ± 0.4ºC, dissolved oxygen concentration at 94.4 ± 3%, salinity at 35g/L and nitrogen compounds ideally below 0.1 mg/L. Tanks were cleaned every day using a sponge to clean the walls and filters and a water siphon to remove waste.
During the co-feeding period (16 to 23 DAH), the daily routines were as presented in Table 2. The distribution of inert microdiets by the tanks was done by hand in this period since the quantities were too small to be able to be efficiently performed by an automatic feeder. The inert microdiets were offered in 4 meals, each consisting of 25% of the total daily amount (Annex 1). The Artemia was also offered in 4 meals but in different proportions in each meal (Table 2). For the control group the routines were the same but the first meal of Artemia was offered at 9.30h and no inert diet was offered. The estimated total daily amounts of Artemia offered to the control in this period can be seen in Annex 1. After weaning, the daily routines were as presented in Table 3. At this point, the amount of microdiets provided (Annex 2) allowed the use of the automatic feeders, which were set to supply 8 meals in a 24 hour period. Meals had a duration of 3 hours, in which the feeder continuously supplied feed for 2 hours and stopped for 1 hour before the next meal. Feeders were checked and cleaned every day to ensure proper functioning. Undischarged feed was quantified and registered. Larvae from all groups were fed ad libitum and it was made sure that feed was always present in the tanks but in amounts that would not deteriorate the water quality. The amounts of
14
microdiet given daily were adjusted according to the amount of feed remnants from the day before.
Table 2 – Daily routines used during the co-feeding period (16 to 23 DAH) in Trial 1.
Hours Daily Routine
9:00h Behavior observation, mortality check and removal of dead fish, registry of feed remnants from day before
9:15h Cleaning of major feed waste 9:30h Feeding – Diet (25 % of total amount) 10:00h Measure of environmental parameters 10:30h Feeding – Artemia (30 % of total amount) 11:00h Filter cleaning
12:00h Feeding – Artemia (10 % of total amount) 14:00h Feeding – Diet (25 % of total amount) 15:00h Feeding – Artemia (10 % of total amount) 15:30h Sump cleaning
16:00h Tank cleaning
17:00h Feeding – Diet (25 % of total amount) 17:15h Weighing of diet for the following day 18:00h Feeding – Artemia (50 % of total amount) 23:00h Feeding – Diet (25 % of total amount)
Table 3 - Daily routines used after weaning was performed (23 to 60 DAH) in Trial 1.
Hours Daily Routine
9:00h Behavior observation, mortality check and removal of dead fish, registry of feed remnants from day before
9:15h Measure of environmental parameters 10:00h Thorough tank cleaning
11:00h Weighing of diet
11:30h Feeder cleaning/quantification of remnants in feeder 12:00h Feeder charging for 24 hours
14:00h Filter cleaning 15:00h Sump cleaning
15 2.1.3. Sampling
2.1.3.1. Growth performance, survival and feeding efficiency
At the start of the experiment (16 DAH) 125 Senegalese sole larvae were sampled from the initial pool of larvae that was distributed to the tanks and at 23, 50 and 60 DAH, 50 larvae were sampled from each tank for dry weight (DW) and total length (TL) determination. To determine TL all larvae were photographed and measured using AxioVision Microscopy software. These were then freeze dried and weighted on a digital scale. Only larvae from the two upper quartiles in each tank were considered for DW, TL and RGR analysis to simulate the sorting process that the larvae typically go through in commercial hatcheries, which eliminates the smallest individuals. Feed conversion ratio (FCR) and relative growth rate (RGR) for each treatment were assessed from 16 DAH to 60 DAH. For the control treatment, FCR was calculated for the period in which inert diets were offered (25 to 60 DAH). Condition factor (K) and survival were determined at the end of the experiment. In all samplings, larvae were harvested randomly to a mesh sieve and then euthanized with Phenoxyethanol. Larvae were then washed in distilled water to remove residual feed and salt, collected into white sheets and stored at -20ºC until analysis. Prior to harvesting, it was made sure that larvae were not feeding for at least 8 hours so at the time of sampling the amount of feed in their digestive tract would be minimal and would not affect weight analysis.
2.1.3.2. Feed intake
Larvae were sampled for feed intake analysis at 19, 25 and 40 DAH. All automatic feeders were removed and all tanks were cleaned, making sure to remove all feed remnants. The equivalent to one meal of unlabeled feed on the automatic feeder was supplied and the larvae were allowed to feed for one hour. After this period, the tank was cleaned and the uneaten feed was removed. Another meal of the respective labeled diet was then supplied and the larvae were allowed to feed for one hour. Afterwards, 20 larvae from each tank were then harvested, euthanized, thoroughly washed and stored at -20ºC as described in section 2.1.3.1. The larvae were photographed and TL measurements were made using AxioVision Microscopy software. These were then freeze dried, weighed and stored in individual eppendorfs.
To determine feed intake, 1 ml of solvent (Ethyl Acetate) was added to each eppendorf. The larvae were homogenized at 20000 rpm using an ultraturrax with a S10N-5G dispersion tool (Ultra Turrax T10, IKA, Staufen, Germany). The homogenate
16
was then centrifuged at 10000 x g for 1 minute at room temperature (ScanSpeed 1236R, Labogene, Denmark). The resultant supernatants were applied to 96 well polypropylene microplates. Stock solutions using the feed used in each treatment were made so calibration curves could be established for each microdiet. These stock solutions were homogenized, centrifuged and their supernatants applied to the plates using the same procedure used for the larvae. The fluorescence of each well was then measured at a specific emission and excitation wavelength, on a wavelength reader Synergy ™ HT (BioTek Instruments, USA). The fluorescence of each larva was then compared to the calibration curve of their respective diet in order to determine the amount of feed ingested.
2.1.4. Data analysis
Feed conversion ratio (FCR) was calculated as: FCR = (Fi / Ww), where Fi corresponds to feed intake (g) and Ww to the mean wet weight gain (g). Relative growth rate (RGR, % day-1) was calculated as: RGR = (eg – 1) x 100, where g = (lnWt – lnW0)
x t –1. Wt and W0 correspond to the final and initial dry weights, respectively, at a chosen period t. Condition factor (K) was calculated as: K = 100 x (W / L3), where W is
the wet weight and L is the total length. Survival was expressed as percentage and calculated as: S = (Lf / Li) x 100, where Li and Lf correspond to the initial and final number of larvae in the tanks, respectively. The amount of sampled larvae was taken in consideration. Differences in growth performance and survival between dietary treatments were evaluated using a One-way ANOVA, followed by a Tukey multiple comparison test. When the one-way ANOVA assumptions were not complied, Krukall-Wallis tests were used, followed by Mann-Whitney tests. Differences in the percentage of larvae that fed on the offered labeled diets between treatments were assessed using chi-square tests. Results were expressed as means ± standard deviation (SD). In results expressed as percentage, an arcsine transformation was performed prior to any statistical test: T = ASIN (SQRT (value / 100)). The significance level considered was p<0.05 for all tests performed. All statistical analyses were performed in IBM SPSS Statistics 24 software. The amount of labeled feed ingested by the larvae in relation to their bodyweight was represented in notched boxplots and differences between treatments were evaluated by visually comparing the notches which display confidence intervals around the medians. Non-overlapping intervals imply a median difference with a significance level of 95% (Chambers et al., 1983).
17
2.2. Results
2.2.1. Growth performance, survival and feeding efficiency
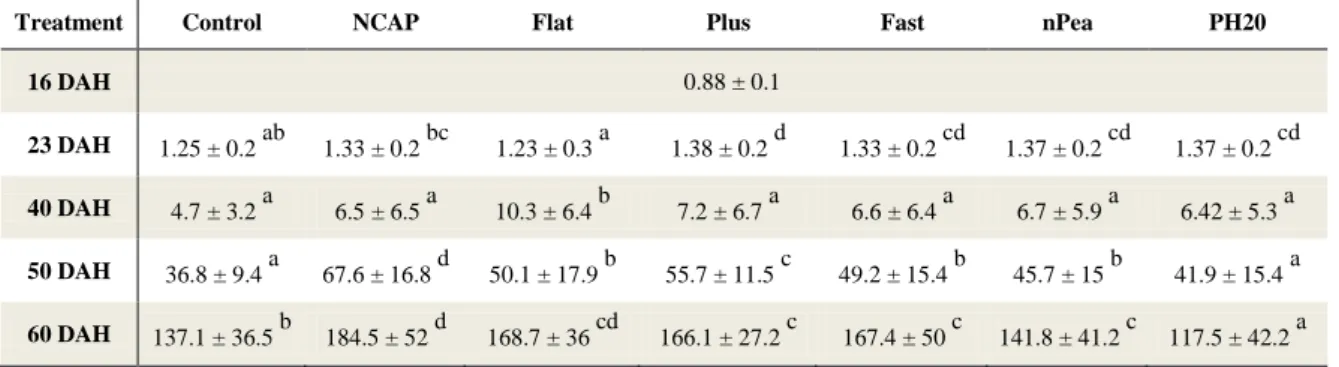
The Senegalese sole larvae DW values obtained throughout Trial 1 are shown in Table 4 and represented in Figure 2. At 23 DAH, with the exception of treatment NCAP and Flat, all other co-fed groups showed significantly higher DW values than the control. At this point, Flat had the lowest values of all co-fed treatments. In contrast, at 40 DAH, it had significantly superior DW values than the remaining treatments, while there were no observed differences between these. At 50 DAH, larvae from all treatments, excluding treatment PH20, showed significantly higher DW values than the control. Larvae from NCAP had significantly higher DW values than all treatments. At the end of the trial (60 DAH), it was possible to verify that NCAP larvae achieved the highest DW values which were significantly higher than the remaining treatments excluding Flat. Larvae from the co-fed treatments weighed significantly more than the control with the exception of PH20 which reached the lowest DW values observed.
Table 4 – Senegalese sole larvae DW (mg) values observed throughout the course of Trial 1.
Treatment Control NCAP Flat Plus Fast nPea PH20
16 DAH 0.88 ± 0.1
23 DAH 1.25 ± 0.2 ab 1.33 ± 0.2 bc 1.23 ± 0.3 a 1.38 ± 0.2 d 1.33 ± 0.2 cd 1.37 ± 0.2 cd 1.37 ± 0.2 cd
40 DAH 4.7 ± 3.2 a 6.5 ± 6.5 a 10.3 ± 6.4 b 7.2 ± 6.7 a 6.6 ± 6.4 a 6.7 ± 5.9 a 6.42 ± 5.3 a
50 DAH 36.8 ± 9.4 a 67.6 ± 16.8 d 50.1 ± 17.9 b 55.7 ± 11.5 c 49.2 ± 15.4 b 45.7 ± 15 b 41.9 ± 15.4 a
60 DAH 137.1 ± 36.5 b 184.5 ± 52 d 168.7 ± 36 cd 166.1 ± 27.2 c 167.4 ± 50 c 141.8 ± 41.2 c 117.5 ± 42.2 a
Values presented as mean ± standard deviation. At 40 DAH, n = 20 and at 23, 50 and 60 DAH, n = 50 observational units. Different superscript letters indicate statistical differences (p<0.05) between larvae from different treatments at the same age. Values refer to the two upper quartiles of weight distribution (excluding 40 DAH values due to the lower number of observational units).
The Senegalese sole larvae TL (mm) values obtained throughout Trial 1 are shown in Table 5. Results obtained followed similar trends to those observed in DW analysis. At the end of the trial (60 DAH), NCAP larvae achieved significantly higher TL values than all other treatments excluding Fast, whereas PH20 larvae achieved significantly lower values than all other treatments.
18
Figure 2 – Dry weight of Senegalese sole larvae reared under different dietary treatments. Values presented as mean ± standard deviation. At 40 DAH, n = 20 and at 23, 50 and 60 DAH, n = 50 observational units. Different superscript letters indicate statistical differences (p<0.05) between larvae from different treatments at the same age. Values refer to the two upper quartiles of weight distribution (excluding 40 DAH values due to the lower number of observational units).
Table 5 – Senegalese sole larvae TL (mm) values observed throughout the course of Trial 1.
Treatment Control NCAP Flat Plus Fast nPea PH20
16 DAH 6.7 ± 0.4
23 DAH 8.5 ± 0.4 a 8.7 ± 0.3 bc 8.6 ± 0.5 ab 8.9 ± 0.4 e 8.8 ± 0.4 cd 8.7 ± 0.5 ab 8.9 ± 0.5 de
40 DAH 13.3 ± 2.7 ab 13.9 ± 4.5 ab 16.6 ± 4.1 c 14.4 ± 4.5 b 13.1 ± 4.4 a 14.7 ± 4.8 b 13.7 ± 4.1 ab
50 DAH 27.3 ± 3.5 a 33.4 ± 2.5 e 29.7 ± 3.4 bc 31.1 ± 2.7 d 30.5 ± 3.6 cd 28.8 ± 3.2 b 27.4 ± 3.2 a
60 DAH 39.2 ± 3.1 bc 43.3 ± 3.6 e 40.7 ± 3 cd 41.1 ± 2.2 d 42.5 ± 3.7 e 39 ± 3.7 b 36.2 ± 4.2 a
Values presented as mean ± standard deviation. At 40 DAH, n = 20 and at 23, 50 and 60 DAH, n = 50 observational units. Different superscript letters indicate statistical differences (p<0.05) between larvae from different treatments at the same age. Values refer to the two upper quartiles of weight distribution (excluding 40 DAH values due to the lower number of observational units).
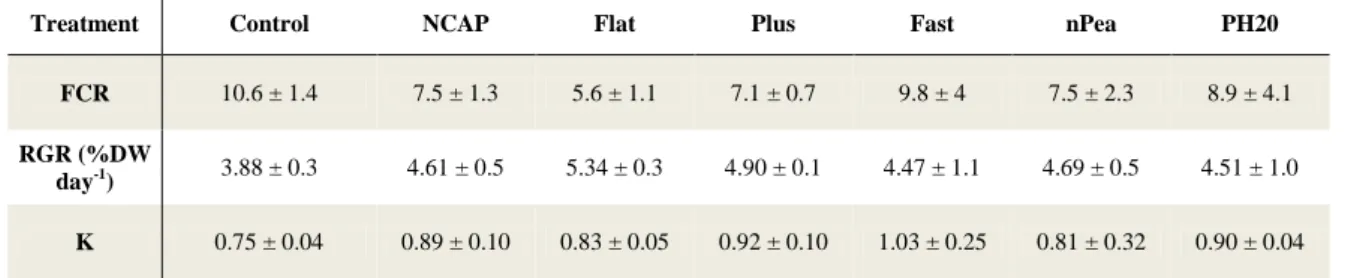
There were no significant differences observed between dietary treatments in FCR, RGR and K at larvae 40 DAH (Table 6). Table 7 shows the values obtained at the end of Trial 1 for FCR, RGR, K and survival. There were no significant differences observed between dietary treatments in FCR, RGR and K. The control exhibited a significantly lower survival than the remaining treatments, excluding treatments Plus and Fast.
19
Table 6 – Senegalese sole larvae FCR, RGR and K values obtained at larvae 40 DAH in Trial 1.
Treatment Control NCAP Flat Plus Fast nPea PH20
FCR 10.6 ± 1.4 7.5 ± 1.3 5.6 ± 1.1 7.1 ± 0.7 9.8 ± 4 7.5 ± 2.3 8.9 ± 4.1
RGR (%DW
day-1) 3.88 ± 0.3 4.61 ± 0.5 5.34 ± 0.3 4.90 ± 0.1 4.47 ± 1.1 4.69 ± 0.5 4.51 ± 1.0
K 0.75 ± 0.04 0.89 ± 0.10 0.83 ± 0.05 0.92 ± 0.10 1.03 ± 0.25 0.81 ± 0.32 0.90 ± 0.04
Results expressed as mean ± standard deviation (n = 20 observational units).
Table 7 – Senegalese sole larvae FCR, RGR, K and survival values obtained at the end of Trial 1.
Treatment Control NCAP Flat Plus Fast nPea PH20
FCR 1.3 ± 0.5 0.94 ± 0.03 0.95 ± 0.2 1.05 ± 0.2 1.09 ± 0.2 1.07 ± 0.3 1.5 ± 0.5
RGR (%DW
day-1) 12.1 ± 0.9 12.9 ± 0.3 12.7 ± 0.5 12.7 ± 0.3 12.6 ± 0.6 12.2 ± 0.5 11.7 ± 0.9
K 0.92 ± 0.07 0.92 ± 0.05 1 ± 0.03 1.01 ± 0.03 0.88 ± 0.07 0.98 ± 0.04 0.98 ± 0.04
Survival (%) 55.7 ± 4 a 73.9 ± 7.6 b 71.7 ± 2.5 b 61.1 ± 12 ab 66.1 ± 6.6 ab 78.7 ± 7.2 b 71.1 ± 4 b
Results expressed as mean ± standard deviation (n = 50 observational units). Different superscript letters indicate statistical differences (p<0.05) between larvae from different treatments. RGR values refer to the two upper quartiles of weight distribution.
2.2.2. Feed intake
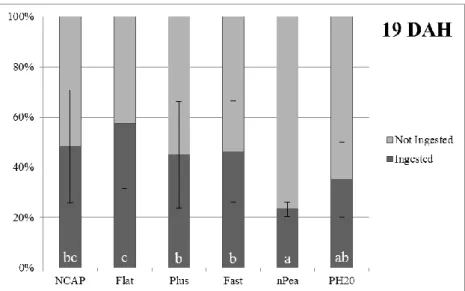
Feed intake analysis results showed that at 19 DAH there were significant differences between treatments in the number of larvae that ingested the offered labeled diets (Figure 3). Flat treatment had close to 60% of larvae feeding on that particular meal which was significantly higher than the remaining treatments, excluding NCAP. In contrast, nPea had only close to 20% of ingestion which was significantly lower than the remaining treatments, excluding PH20. Figure 4 shows that there were no significant differences between treatments on the amounts of labeled microdiet ingested by the larvae that fed on that particular meal.
At 25 DAH, Control larvae did not feed on the offered labeled diet. The percentage of larvae that fed from treatments NCAP, Flat, Plus and PH20 varied between 79 ± 1% to 90 ± 17%, which was significantly higher than Fast and nPea, both close to 60% (Figure 5). Larvae from treatments Flat, Plus and PH20 ingested significantly higher amounts of labeled diet than treatments NCAP, Fast and nPea (Figure 6).
20
Figure 3 – Ingestion or no ingestion. Senegalese sole larvae ingestion pattern of different experimental labeled feeds offered at 19 DAH. Results expressed as treatment mean ± standard deviation (n = 20 observational units). Different superscript letters indicate statistical differences (p<0.05) between treatments.
Figure 4 – Amounts of labeled feed ingested in relation to bodyweight by Senegalese sole larvae fed different experimental microdiets at 19 DAH (n = 20 observational units). Box shows the interquartile range of distribution (IQR) (25 to 75%). Horizontal line crossing the box represents the median. Notches in the box represent 95% confidence intervals around the median. Whiskers represent values outside the IQR, excluding outliers. Cross and open circle symbols represent the mean and outliers, respectively. Different superscript letters indicate non-overlapping intervals which imply a median difference with a 95% significance level.
21
Figure 5 – Ingestion or no ingestion. Senegalese sole larvae ingestion pattern of different experimental labeled feeds offered at 25 DAH. Results expressed as treatment mean ± standard deviation (n = 20 observational units). Different superscript letters indicate statistical differences (p<0.05) between treatments.
Figure 6 – Amounts of labeled feed ingested in relation to bodyweight by Senegalese sole larvae fed different experimental microdiets at 25 DAH (n = 20 observational units). Box shows the interquartile range of distribution (IQR) (25 to 75%). Horizontal line crossing the box represents the median. Notches in the box represent 95% confidence intervals around the median. Whiskers represent values outside the IQR, excluding outliers. Cross and open circle symbols represent the mean and outliers, respectively. Different superscript letters indicate non-overlapping intervals which imply a median difference with a 95% significance level.
22
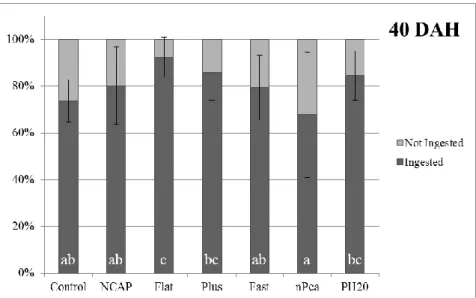
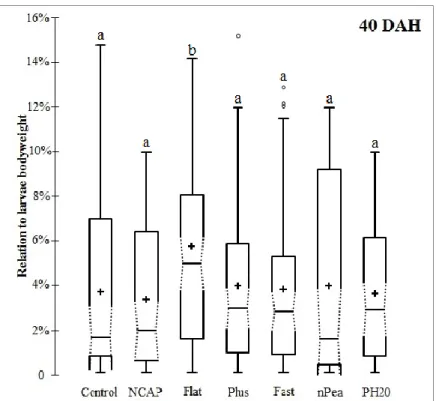
At 40 DAH, Flat treatment had over 90% of larvae feeding on the offered labeled diets, which was significantly higher than treatments Control, NCAP, Fast and nPea but similar to Plus and PH20. Control had the highest increase in the percentage of feeding larvae from 0% at 25 DAH to around 74% at 40DAH, value only significantly lower than Flat (Figure 7). Larvae from Flat also ingested significantly higher amounts of labeled diet than the remaining treatments, whereas no other significant differences were found (Figure 8).
Figure 7 - Ingestion or no ingestion. Senegalese sole larvae ingestion pattern of different experimental labeled feeds offered at 40 DAH. Results expressed as treatment mean ± standard deviation (n = 20 observational units). Different superscript letters indicate statistical differences (p<0.05) between treatments.
23
Figure 8 – Amounts of labeled feed ingested in relation to bodyweight by Senegalese sole larvae fed different experimental microdiets at 40 DAH (n = 20 observational units). Box shows the interquartile range of distribution (IQR) (25 to 75%). Horizontal line crossing the box represents the median. Notches in the box represent 95% confidence intervals around the median. Whiskers represent values outside the IQR, excluding outliers. Cross and open circle symbols represent the mean and outliers, respectively. Different superscript letters indicate non-overlapping intervals which imply a median difference with a 95% significance level.
2.3. Discussion
In this trial, several inert microdiets were tested targeting an early weaning right after settlement in Senegalese sole larvae. The use of an early co-feeding strategy allowed the performance of full weaning at 23 DAH, with good larvae growth performance and survival results. Larvae achieved DW values of 185 ± 52 mg at 60 DAH; RGR values around 12.4%.day-1; FCR values around 1, K values averaging 0.95 and survival varied between 56 to 79%. The growth results obtained are a great improvement to those obtained by other authors on Senegalese sole larvae co-feeding studies such as a avate and Fern ndez-D az 1999 , that obtained DW values of 50.9 mg at 60 DAH; Ribeiro et al. (2005), that obtained DW values of 4.2 mg at 39 DAH; Engrola et al. (2007), that obtained DW values of 50.9 mg at 60 DAH and RGR values of 8%.day-1; Engrola et al. (2009a), that obtained DW values of around 100mg at 68DAH and RGR values of 5.5%.day-1; Lobo et al. (2014), that obtained DW values of around 50 mg at 56 DAH; and Pereira (2016), that obtained DW values 25 mg at 51 DAH and RGR values averaging 11.4%.day-1. These results are also an improvement to
24
those obtained on studies using a sudden weaning strategy such as Engrola et al. (2005), that obtained RGR values of 6.3%.day-1; Dâmaso-Rodrigues et al. (2010), that obtained DW values of around 25 mg at 60 DAH; and Pinto et al. (2016), that obtained RGR values around 4.5%.day-1. Despite performing full weaning at an earlier larval age, the RGR and DW values obtained are amongst the highest values ever reported in Senegalese sole experimental trials. The fact that only larvae from the two upper quartiles of weight distribution were considered for growth analysis had little influence on these conclusions, since RGR values of around 11.7%.day-1 would be achieved if all larvae had been considered, which still are good values. The survivals observed were also higher than those obtained in other studies, such as a avate and Fern ndez-D az (1999) (39%), Engrola et al. (2005) (44% and 70%), Engrola et al. (2007) (39%), Engrola et al. (2009a) (24%) and Pereira (2016) (between 48% and 73%). Engrola et al. (2007), Lobo et al. (2014) and Pinto et al. (2016) registered higher survivals, but the weaning strategy adopted by such authors was also more conservative. The overall good results obtained in the current study may most likely be explained by the improvement that has occurred on the zootechnical conditions during the pelagic phase, the quality of weaning microdiets and the feeding protocols during weaning. These allow the larvae to grow faster in the first developmental stages achieving a faster digestive maturation and a shorter period of adaption to inert microdiets.
The type of microdiet used in the current trial had an effect on the larvae growth performance but not on survival. The overall good growth performance results obtained in this trial confirm the quality of the microdiets used. Nevertheless, improvements can still be made in order to increase its suitability for younger larvae and reduce the cost-benefit relation. NCAP larvae exhibited the best growth performance of all treatments and only Flat larvae achieved similar final weights. The microdiet used for this treatment differed from WinFlat on the inclusion of a mixture of encapsulated and non-encapsulated taurine as opposed to the micronon-encapsulated taurine alone. Since taurine is an hydrosoluble AA (Amino acid), microencapsulation can be performed to decrease leaching (Hamre et al., 2013). However, encapsulation involves the formation of a particle where a complete enclosure of a given nutrient by a binder occurs. This may make it more difficult for the larvae to digest the encapsulated particles where taurine is incorporated, especially at early stages of larval development, when the digestive system is still not completely developed. Still, NCAP larvae did not exhibited superior growth performances during the first stages of development, which does not provide
25
clear information on the digestibility of these particles. The results of this trial did not allow assessing the benefit of using microencapsulated taurine in the WinFlat diet, since similar results were obtained with non-encapsulated taurine. This adds an extra step to the production process, increasing its overall costs. Nevertheless, this WinFlat variant shall be further investigated in Trial 2.
Larvae from treatments Flat, Plus, Fast and nPea showed similar weights at the end of the experiment which were higher than those achieved by the Control larvae. Nevertheless, FCR, RGR and K values were similar to the Control larvae. The premium WinFlat version, WinFlatplus, seems, at least during good husbandry conditions, to be less cost-effective than the normal version since its use did not improve larvae growth or survival. The use of WinFast, a high energy diet for fast growing fish species, did not improve larvae survival and did not increase larvae growth which suggests that Senegalese sole larvae may not have such energy requirements. As for the nPea treatment, the pea protein concentrate used in WinFlat was substituted by other sources of protein of marine and vegetable source and no effects on the survival and on final weight achieved by the larvae were observed, which does not support this replacement. These results suggest that all these microdiets can be used for an early weaning in Senegalese sole but amongst these, WinFlat seems to be the most cost-effective one.
PH20 larvae exhibited the lowest growth performance of all treatments. During the co-feeding these were fed a microdiet with 20% of protein hydrolisates, which is a higher amount than what is used in WinFlat, and fed WinFlat after weaning. In Senegalese sole, the inclusion of moderate levels of protein hydrolisates seems to result in improved growth in early larval stages (Canada, 2016). Inclusions of protein hydrolisates in weaning diets have been shown to improve survival and growth, but the inclusion of high levels has been proven to be detrimental to several species such as the gilthead seabream (Kolkovski & Tandler, 2000), common carp (Carvalho et al., 1997) and European seabass (Cahu et al., 1999). High levels of protein hydrolisates increase the amount of leached compounds which can make the diets less nutritive (Hamre et al., 2013). Additionally, it has been suggested by Cahu et al. (1999) and Carvalho et al. (2004) and discussed in De Vareilles et al. (2012) that the inclusion of high levels of protein hydrolisates can result in an excess of FAA, di and tri-peptides which saturate the peptide and AA intestinal transport mechanisms, which could be responsible for the detrimental effects observed. Furthermore, FAA’s are absorbed faster than protein-bound AA which may lead to AA imbalances and consequent decrease on protein