The role of alternative specimens in toxicological analysis
E. Gallardo and J. A. Queiroz*
CICS, Centro de Investigação em Ciências da Saúde, Universidade da Beira Interior, 6201-001 Covilhã, Portugal
Received 18 January 2008; accepted 22 January 2008
ABSTRACT: The use of alternative specimens in the field of toxicology was first described in 1979, when hair analysis was used to document chronic drug exposure. Since then, the use of these ‘alternative’ samples has gained tremendous importance in foren-sic toxicology, as well as in clinic toxicology, doping control and workplace drug testing. It is not surprising, therefore, that a large number of papers dealing with the determination of several classes of drugs in saliva, sweat, meconium and hair have been published ever since, owing to the fact that chromatographic equipment is becoming more and more sensitive, mass spectrometry (and tandem mass spectrometry) being the most widely used analytical tool, combined with gas or liquid chromatography. ‘Alter-native’ specimens present a number of advantages over the ‘traditional’ samples normally used in toxicology (e.g. blood, urine and tissues), namely the fact that their collection is not invasive, their adulteration is difficult, and they may allow increased windows of detection for certain drugs. The main disadvantage of this kind of samples is that drugs are present in very low concentrations, and therefore high-sensitivity techniques are required to accomplish the analysis. This paper reviews a series of publications on the use of alternative specimens, with special focus on the main analytical and chromatographic problems that these samples present, as well on their advantages and disadvantages over traditional samples in documenting drug exposure. Copyright © 2008 John Wiley & Sons, Ltd.
KEYWORDS: unconventional samples; analytical chromatography; therapeutic drug monitoring; toxicological analysis
*Correspondence to: J. A. Queiroz, CICS, Centro de Investigação em Ciências da Saúde, Universidade da Beira Interior, 6201-001 Covilhã, Portugal.
E-mail: jqueiroz@ubi.pt
INTRODUCTION
In the last decade, alternative or unconventional
matri-ces have becoming more important in the field of
toxicology, owing to the advantages that these
speci-mens present when compared with ‘conventional’
samples used in laboratorial routine analysis. In general
these samples present the advantage that collection
is almost non-invasive and easy to perform. On the
other hand, collection can also be achieved under close
supervision, which prevents sample adulteration or
sub-stitution. Furthermore, some of these samples present
larger detection windows, and therefore their range of
analytical applications can be very wide.
Recent advances in analytical techniques have
en-abled the detection of drugs and metabolites at very low
concentrations that were unthinkable a few years ago.
In fact, LC/MS and LC/MS/MS techniques are
increas-ing in popularity as confirmation techniques because of
high sensitivity and specificity, and the ability to handle
complex matrices. Also, LC/MS techniques do not
require the time-consuming derivatization steps needed
in GC/MS for a large number of compounds;
how-ever, ion suppression or enhancement due to complex
matrices is a frequent analytical complication and
must be addressed during method development and
validation.
In fact, despite the analytical problems that liquid
chromatography-based techniques can present, these
are the state of art concerning analysis of alternative
specimens because of their higher sensitivity, which is
crucial if one takes into account the low amount of
sample usually available in these situations.
Therefore, very low amounts of drugs of abuse or
pre-scription drugs can be detected, for instance in the low
picogram range for carboxy-THC, which is definite proof
of cannabis consumption, using hair analysis, and for
benzodiazepines, a single exposure to which in a
drug-facilitated assault can be detected through hair analysis.
The first unconventional sample used was hair in the
1960s and 1970s to evaluate human exposure to toxic
heavy metals, namely arsenic, lead and mercury
(Ham-mer et al., 1971; Kopito et al., 1967). Since then, nu(Ham-mer-
numer-ous papers dealing with the determination of varinumer-ous
classes of compounds have been published in the
scien-tific literature, normally concerning drugs of abuse and
therapy. Nowadays other alternative samples such as
oral fluid, meconium or sweat are being introduced and
present a wide range of applications, e.g. in therapeutic
drug monitoring, workplace drug testing and prenatal
exposure to drugs of abuse.
This review will deal with the most used
unconven-tional samples, with special focus on their advantages
and disadvantages, collection procedures, classes of
drugs that are analyzed and analytical methods.
ALTERNATIVE SPECIMENS
The most commonly used unconventional samples are
hair, oral fluid, sweat and meconium. The physiological
and analytical properties of these samples, as well of
other (less used) samples, including advantages and
drawbacks of each and the main parameters that can
affect their analysis, will be discussed below, in the light
of existing literature on the topic.
Hair
Hair is a product of differentiated organs in the skin of
mammals. It is constituted by proteins, mainly keratin
(65 –95%), water (15 –35%), lipids (1–9%) and
miner-als (0.25 – 0.95%; Harkley and Henderson, 1989). A rich
capillary system, which provides the growing hair with
the necessary metabolic material, surrounds the hair
follicle (Pragst and Balikova, 2006). It is estimated that
the total number of hair follicles in adults is
approxi-mately 5 million. Hair grows at a rate of 0.6–1.4 cm per
month, depending on the type of hair and anatomical
site (Saitoh et al., 1969).
The hair growth cycle is divided into the anagen (active
growing), catagen (transition) and telogen (resting) stages.
The proportions of anagen/telogen hair vary with
ana-tomical site and this feature, together with variable
growth rate, accounts for the observed differences
in drug concentrations in hair collected from different
regions. In fact, not only scalp hair can be used for
analysis, and pubic hair, arm or leg hair and axillary
hair have been suggested as alternative sources for drug
detection when scalp hair is not available. However,
care should be taken when interpreting the
concentra-tions of drugs in these specimens, since various studies
have found differences between pubic or axillary hair
and scalp hair (Balabanova and Wolf, 1989; Offidani
et al., 1993; Han et al., 2005). Indeed, the latter two
studies have compared methadone and
methamphe-tamine concentrations in hair from different anatomical
sites, concluding that the highest values were found
in axillary hair, followed by pubic hair and scalp hair.
In contrast, in another study the highest morphine
con-centrations were found in pubic hair, followed by head
hair and axillary hair (Mangin and Kintz, 1993). The
significant differences of the drug concentrations in
these studies can be explained not only by the totally
different anagen/telogen ratio or growth rate, but also
by a better blood circulation and a greater number of
apocrine glands (Pragst et al., 1998).
Beard hair is also a suitable specimen for analysis.
This type of hair grows at about 0.27 mm per day, and
therefore can be collected on a daily basis with an
elec-tric shaver.
Hair analysis is only useful if the measured drugs are
a result of ingestion, rather than from other sources.
Therefore, the mechanisms of incorporation of the
drugs into the hair shaft must be addressed. It is
gener-ally accepted that drugs can enter the hair from three
sources: (1) from the bloodstream during hair growth;
(2) following excretion by sweat and sebum bathing the
hair, usually after the hair emerges from the skin, and
(3) from passive exposure from the hair to the drug,
e.g. from smoke or dirty hands, followed by dissolution
of the drug into the drug-free sweat. It is virtually
impossible to distinguish between the presence of drugs
derived from these two latter mechanisms and that
pro-ceeding from actual consumption, which is explained
by the fact that the drugs are in an aqueous moiety,
enhancing their incorporation. This is the reason why
environmental exposure is sometimes called the
‘stum-bling block of hair testing’ (Kidwell and Blank, 1996).
Incorporation of drugs is affected by the melanin
content of the hair and by the substances’ lipophilicity
and basicity. For instance, the effect of melanin content
of the hair on drug incorporation can be studied in
individuals with gray hair, showing that the
concentra-tion of basic drugs in pigmented hair can be about
10-fold higher than in non-pigmented hair (Pragst and
Balikova, 2006). In fact, it has been suggested that
drugs bind to melanin, which explains the higher
con-centrations normally found in darker hair (Rollins
et al., 2003; Mieczkowski and Kruger, 2007).
Hair samples are best collected from the back of the
head, the so-called vertex posterior. In fact, this is the
region where hair grows with more homogeny, and
also where the anagen/telogen ratio is higher, meaning
that the number of hairs in active growth is larger. Hair
should be cut as close as possible to the scalp with the
aid of scissors, and the proximal zone (i.e. the zone
which is closer to the root) should be clearly indicated
if segmental analysis is to be performed. The sample
can then be stored light and moisture protected at room
temperature, for instance wrapped in aluminum foil.
Drugs are usually stable in regularly treated hair
(without using aggressive cosmetic agents, such as
oxi-dant dyes, bleaching or permanent wave), which makes
them detectable for at least one year after intake
(Pragst and Balikova, 2006).
Hair is usually exposed to several agents that may
impair drug testing, such as shampoos, dust, sunlight
and rain. In fact, there are several studies on the effect
of cosmetic treatments on drug stability in hair. For
example, Martins et al. (2007) have found that the
con-centrations of amphetamine-type stimulants decreased
in bleached hair when compared with non-bleached
hair, without influencing their enantiomeric ratios.
Likewise, it has been shown that this treatment affects
the stability and decreases hair concentrations of other
drugs (Pötsch and Skoop, 1996; Yegles et al., 2000).
Cosmetic treatments can also produce analytical
inter-ferences that may hinder the detection of drugs. This is
the detection of cocaine and metabolites (Zucchela
et al., 2007).
As stated above, one of the most important pitfalls
in hair analysis is environmental contamination. Indeed,
if adequate measures are not taken, the risk of
report-ing false positive results increases, which is
unaccept-able, especially if there are legal implications of drug
consumption. Therefore, to minimize this effect it is
strongly recommended that hair analysis procedures
include a washing step. Several decontamination
proce-dures are described in the literature, and these include
organic solvents, aqueous buffers, water, soaps and
combinations of these (Kintz et al., 1995; Eser et al.,
1997; Girod and Staub, 2000; Skender et al., 2002;
Schaffer et al., 2002; Villamor et al., 2005). There is
no general consensus regarding decontamination
pro-cedures, and it is assumed that the total elimination
of deposited drug is not achieved even after laborious
washing procedures. Several researchers propose
crite-ria for differentiation between drug use and
environ-mental contamination, namely the establishment of a
concentration ratio between the last wash and the hair
sample (Schaffer et al., 2005; Tsanaclis and Wicks,
2007a).
Hair decontamination prior to analysis is not the
only way to deal with environmental exposure.
There-fore, the Society of Hair Testing also recommends the
detection of drug metabolites and the use of metabolite
to parent drug ratios to report positive results (Society
of Hair Testing, 2004). In fact, as environmental
con-tamination is not totally removed even using laborious
washing techniques, only the detection of drug
metabo-lites, i.e. proceeding from endogenous metabolism,
guarantees that the drug that is being measured has
been actively consumed. This is of particular
impor-tance in the case of drugs that are likely to be in the
environment because of the way they are consumed,
such as cannabis (THC-COOH should be detected)
and cocaine (where at least one metabolite should be
detected, with a concentration ratio to the parent drug
of higher than 0.05).
The major practical advantage of hair testing
com-pared with urine or blood testing for drugs is that it
has a larger detection window (weeks to months,
depending on the length of the hair shaft, against 2– 4
days for most drugs). However, it is not advisable to
rely only on hair analysis, since there are issues where
it cannot provide adequate results, such as short-term
information on an individual’s drug use, for which blood
and/or urine are better specimens. On the other hand,
long-term histories are only accessible through hair
analysis. Therefore, one can say that these tests
com-plement each other.
The assessment of this ‘chronic exposure’ to drugs is
achieved by segmental hair analysis. In fact, hair grows
associate the drug distribution pattern in the analyzed
segments with a period in the past, taking into account
both variable hair growth rates and intra- and
inter-individual differences. Furthermore, drugs are very stable
within the hair matrix for long periods of time,
provid-ing that specimens are stored light- and
moisture-protected. Another advantage of hair analysis when
compared with blood or urine analysis is the collection
procedure, because: (1) it is non-invasive and easy to
perform; (2) the sample is not easy to adulterate by
diluting with water (as can occur in urinalysis); and (3)
in the case that there is a claim (sample switching,
break in the chain of custody, etc.), it is possible to
get an identical sample from the subject. Obviously,
this latter is of great importance in the field of forensic
toxicology.
However, hair analysis has several drawbacks, which
sometimes are very difficult to handle in manageable
proportions. The main problem in this type of analysis
is the possibility of reporting false positive results
due to environmental contamination of the hair, which
can occur at any level. The fact that a drug is detected
in a hair specimen does not necessarily mean that
it was actively consumed. Therefore, hair specimens
should be decontaminated prior to analysis, and specific
metabolites of the drugs must be searched for. This
may present a problem, because normally the
metabo-lites are more polar drugs, and have less affinity for
hair matrix constituents. This is the case, for example,
for THC-COOH, the metabolite of THC (cannabis
main constituent), which is found in hair in extremely
low concentrations, usually in the low picogram range.
To detect these low concentrations, mass spectrometric
techniques are mandatory, using either gas or liquid
chromatography.
In addition, as hair is quite a ‘dirty’ matrix, its
con-stituents may interfere with chromatographic analysis,
and therefore a sample cleanup step is normally
re-quired. In the development of new methods for drug
detection in hair, special attention should be paid to the
matrix effect, especially using liquid chromatographic
methods, because they are more sensitive to ion
sup-pression/enhancement effects.
Since the first report in the 1970s, hair analysis has
aided toxicologists in several fields, such as in history
and archaeology (Nakahara et al., 1997; Báez et al., 2000),
in assessing consumption profiles of drugs and alcohol
by the general (Jurado et al., 1996; Hartwig et al., 2003;
Tsanaclis and Wicks, 2007b) or student populations
(Kidwell et al., 1997; Quintela et al., 2000), driving
licence renewals (Ricossa et al., 2000), assessing
intra-uterine drug exposure (Chiarotti et al., 1996; Ursitti et al.,
1997; Koren et al., 2002; Garcia-Bournissen et al., 2007),
evaluating of compliance with drug substitution therapy
(Moeller et al., 1993; Kintz et al., 1998; Lucas et al.,
2000; Sabzevari et al., 2004), in the workplace and
pre-employment (Cairns et al., 2004) and in post-mortem
toxicology (Kintz, 2004). Another important application
of hair analysis is in drug-facilitated crimes, in which
the analytes must be detected after a single exposure,
which is achieved due to the high sensitivity of LC/MS/
MS (Negrusz and Gaensslen, 2003; Kintz, 2007).
Several classes of drugs can be detected in hair, such
as biomarkers of alcohol consumption, cocaine and
meta-bolites, opiates, cannabinoids, amphetamines and other
designer drugs, GHB, benzodiazepines and hypnotics,
antipsychotics, antidepressants, steroids, anaesthetics,
antiparkinsonics and alkaloids (Table 1).
Hair analysis usually begins with a general screening
by immunoassays, followed by a confirmation using
chromatographic techniques. Gas chromatography
coupled to mass spectrometry is by far the most widely
used analytical tool for drug determination in hair
specimens. Nevertheless, liquid chromatography–mass
spectrometry (or tandem mass spectrometry) based
methods are becoming more and more important in
this field, owing to their better sensitivity for
termo-labile compounds, yielding lower limits of detection
and quantitation, and the fact that time-consuming
derivatization steps are not necessary to accomplish the
analysis. However, before chromatographic analysis,
the analytes must be (1) extracted from within the
matrix (where they are bound to hair constituents)
and (2) concentrated in a solvent which is compatible
with the analytical instruments. There is no universal
method to extract the analytes from the hair matrix,
and it depends on the nature and chemical stability
of the particular compound. Therefore, opioids and
cocaine are best extracted using mild acidic hydrolysis
(e.g. 0.05 – 0.5
Mhydrochloric acid), to avoid conversion
of heroin or 6-acetylmorphine to morphine and of
cocaine to benzoylecgonine (Girod and Staub, 2000;
Romano et al., 2003; Cognard et al., 2005; Cordero
et al., 2007; Tsanaclis and Wicks, 2007a). On the other
hand, stable compounds like cannabinoids and
amphe-tamines can be extracted using strong alkaline
con-ditions (e.g. 1
Msodium hydroxide; Quintela et al., 2000;
Stanaszek and Piekoszewski, 2004; Villamor et al., 2005;
Martins et al., 2005, 2006; Tsanaclis and Wicks, 2007a).
Other extraction methods include buffer or solvent
extraction (with, or without sonication; Paterson et al.,
2001; Scheidweiler and Huestis, 2004) and enzymatic
hydrolysis (Vincent et al. 1999; Quintela et al., 2000;
Míguez-Framil et al., 2007).
Following this extraction step, which is normally the
most time-consuming step in hair analysis, a sample
cleanup step is often required, to minimize any
interfer-ence caused by endogenous compounds, which is
particu-larly important in the case of liquid
chromatography-based methods because of ion suppression/enhancement
effects. This sample cleanup procedure is usually
per-formed using liquid–liquid extraction (Sachs and Dressler,
2000; Stanaszek and Piekoszewski, 2004; Villamor et al.,
2005; Nakamura et al., 2007) or solid-phase extraction
(Girod and Staub, 2000; Scheidweiler and Huestis,
2004; Cognard et al., 2005; Martins et al., 2006; Moore
et al., 2006a,b; Lachenmeier et al., 2006; Cordero and
Paterson, 2007). However, solid-phase
microextrac-tion (Sporkert and Pragst, 2000; Lucas et al., 2000;
Musshoff et al., 2002; Nadulski and Pragst, 2007),
solid-phase dynamic extraction (Musshoff et al., 2003) and
supercritical fluid extraction (Cirimele et al., 1995;
Allen and Oliver, 2000; Brewer et al., 2001) have also
been described.
Saliva/oral fluid
Saliva is the excretion product originated from three
pairs of major salivary glands (parotid, submandibular
and sublingual), a great number of minor salivary glands,
the oral mucosa and gingival crevices. As this excretion
product is actually a fluid mixture, the term ‘oral fluid’
seems more appropriate to designate it, instead of ‘saliva’
or ‘whole saliva’ (Malamud, 1993). Water (99%) is the
major oral fluid constituent, and other components
such as proteins (mucins and digestion enzymes) and
mineral salts are also present. Its pH is 6.8 in resting
situations, but an increase in the salivary flow turns
it more basic (approaching the plasma’s pH) as a result
of higher osmolarity (Kintz and Samyn, 2000). All these
characteristics are influenced by a variety of factors,
as the circadian rhythm, the type of the salivation
stimu-lus, hormonal changes, stress, and therapeutic drugs
(Aps and Martens, 2005). The total volume of oral fluid
produced by an adult may be 1000 mL/day with typical
flows of 0.05 mL/min while sleeping, 0.5 mL/min while
spitting and 1–3 mL/min or more while chewing (Crouch,
2005).
Different mechanisms of drug transport are thought
to occur, such as passive diffusion through the membrane,
active processes against a concentration gradient,
filtra-tion through pores in the membrane and pinocytosis
(Spihler, 2004). Most of the drugs enter oral fluid by a
mechanism of passive diffusion, which is dependent on
the particular physicochemical properties of the
com-pound or class of comcom-pounds, such as molecular weight
(a molecular weight of less than 500 Da favors
dif-fusion), liposolubility, pH and pK
a, protein binding and
ionization state (Paxton, 1979; Aps and Martens, 2005).
Therefore, the concentrations of drugs in oral fluid
represent the free non-ionized fraction in the blood
plasma. In fact, the fraction of drug bound to saliva and
plasma protein as a function of pK
aand pH can be
pre-dicted by the Henderson–Hasselbach equation (Spihler,
2004).
A variety of methods are available for oral fluid
collection (Navazesh, 1993), including spitting, draining,
Table 1. Hair analysis for several classes of compounds Compound(s) Ethyl glucuronide, cocaethylene (COET) Fatty acid ethyl esters Ethyl glucuronide Ethyl glucuronide Cocaine (COC), anhydroecgonine methylester (AEME), ecgonine methylester (EME), COET COC, COET COC, benzoylecgonine (BE) COC, BE, COET and norcocaine 6-Monoacetylmorphine (MAM) Codeine (COD), morphine (MOR), hydrocodone, hydromorphone, MAM and oxycodone MAM, MOR, COD MAM, MOR, COD Detection mode LC/MS/MS GC/MS GC/MS GC/MS/MS GC/MS/MS GC/MS LC/SACI- MS/MS-SRM LC/SACI- MS3-SRM LC/MS/MS RIA and GC/MS GC/MS GC/MS RIA and LC/MS/MS LOD; LOQ 3pg/mg for ethyl glucuronide 40
pg/mg for COET 0.02 ng/mg; 0.2 ng/mg 2 pg/mg; 4 pg/mg 0.01 ng/mL; 0.02 ng/mL 0.005 ng/mg; 0.05 ng/mg
for COC and COET, 0.025
ng/mg; 0.05 ng/mg for EME 0.050 ng/mg; 0.10 ng/mg for AEME 0.08 ng/mg; 0.4 ng/mg for COC 0.02 ng/mg; 0.4 ng/mg for COET 0.003 ng/mg; 0.01 ng/mg for COC 0.02 ng/mg; 0.04 ng/mg for BE 25 pg/mg; 50 pg/mg 0.2 ng/mg; 0.5 ng/mg used RIA 0.32 ng/mg; 0.03 ng/mg for COD 0.15 ng/mg; 0.01 ng/mg for MOR 0.65 ng/mg; 0.06 ng/mg for hydrocodone 0.15 ng/mg; 0.01 ng/mg for hydromorphone 1.10 ng/mg; 0.1 ng/mg for MAM 0.14 ng/mg; 0.01 ng/mg for oxycodone 2pg/ μ L for MAM 3 pg/ μ
L for MOR and
5 pg/ μ L for COD 0.5 ng/10 mg References Politi et al. (2007) De Giovanni et al. (2007) Appenzeller et al. (2007) Paul et al. (2007) Cognard et al. (2005) Bermejo et al. (2006) Cristoni et al. (2007) Moore et al. (2007a)
Moeller and Mueller (1995) Jones
et al. (2002) Acampora et al. (2003) Hill et al. (2005) Sample preparation 50 mg of hair; no sample cleanup 50 mg of hair; SPE 30 mg of hair;
liquid–liquid extraction procedure followed by HS-SPME 10–30
mg of hair; SPE 10 mg of hair; SPE 50 mg of hair; SPE 50 mg of hair; SPME 2 0 –50 mg of hair; no sample-cleanup 10 mg of hair; SPE 2 0 –30 mg of hair; SPE 1 0 –50 mg of hair; SPE 50 mg of hair; SPE 10 mg of hair; SPE
Table 1. (
Continued
)
Compound(s) Heroin, MAM, MOR, COD, COC, BE and COET MAM, MOR, COD, hydrocodone Opiates, amphetamines, cocaine and metabolites and diazepam and metabolite Buprenorphine, COD, fentanyl, hydromorphone, methadone, MOR, oxycodone, oxymorphone, piritramide, tilidine, tramadol, and their metabolites bisnortilidine (BNTI), nortilidine (NTI), norfentanyl (NFE), and normorphine (NOMO) Δ9-tetrahydrocannabinol (THC), cannabidiol (CBD), cannabinol (CBN) Detection mode ELISA and GC/MS ELISA and GC/MS GC/MS LC/
MS/MS GC/MS LOD; LOQ 0.04 ng/mg; 0.21 ng/mg for heroin, 0.02 ng/mg; 0.15 ng/mg for MAM, 0.03 ng/mg; 0.11 ng/mg for MOR, 0.02 ng/mg; 0.04 ng/mg for COD, 0.01 ng/mg; 0.11 ng/mg for COC, 0.03 ng/mg; 0.26 ng/mg for BE, 0.05 ng/mg; 0.21 ng/mg for COET 50
pg/mg for all analytes
0.1 ng/mg for amphetamines and 0.2 ng/mg for remaining drugs 1.6 pg/mg; 5.6 pg/mg for buprenorphine, 12.7 pg/mg; 50.8 pg/mg for COD, 0.8 pg/mg; 2.6 pg/mg for fentanyl, 2.0 pg/mg; 6.6 pg/mg for hydromorphone, 8.9 pg/mg; 30.0 pg/mg for methadone, 6.1 pg/mg; 29.9 pg/mg for MOR, 12.0 pg/mg; 42.7 pg/mg for oxycodone, 1.2 pg/mg; 4.7 pg/mg for oxymorphone, 2.2 pg/mg; 9.1 pg/mg for piritramide, 2.4 pg/mg; 8.7 pg/mg for tilidine, 15.2 pg/mg; 57.8 pg/mg for tramadol, 17.4 pg/mg; 59.1 pg/mg for BNTI, 9.3 pg/mg; 32.2 pg/mg for NTI, 0.9 pg/mg; 3.5 pg/mg
for NFE, and 3.4
pg/mg; 9.5 pg/mg for NOMO 0.09; 0.44 ng/mg for THC, 0.09; 0.44 ng/mg for CBD, 0.12; 0.44 ng/mg for CBN References Lachenmeier et al. (2006) Moore et al. (2006a)
Cordero and Paterson (2007) Musshoff
et al. (2007) Musshoff et al. (2003) Sample preparation 50 mg of hair; SPE 10 mg of hair; SPE 10 –50 mg of hair; SPE 50 mg of hair; methanol 10 mg of hair; SPDE
Table 1. ( Continued ) Compound(s) 11-nor-Δ 9 -tetrahydrocannabinol-9-carboxylic
acid (THC-COOH), THC, CBN THC, CBD, CBN THC, CBD, CBN, THC-COOH THC-COOH THC-COOH, THC THC, CBD, CBN THC, CBD, CBN THC, CBD, CBN THC-COOH Amphetamine (AP), methamphetamine (MA), 3,4-methylenedioxyamphetamine (MDA), 3,4-methylenedioxymethamphetamine (MDMA), 3,4-methylenedioxyethamphetamine (MDEA) MA, MDMA, AP, MDA MA, AP MDMA, MDA, MA, AP MDMA, MDA MA, MDMA, AP, MDA, MDEA, N-methyl-1-(3,4-methylenedioxyphenyl)- 2-butanamine (MBDB) Detection mode GC/MS/MS; GC/MS; ELISA GC/MS GC/MS GC/MS; ELISA GC/MS GC/MS GC/MS GC/MS/MS GC/MS GC/MS GC/MS HPLC- fluorescence detection GC/MS LC-MS/MS LOD; LOQ 0.1 pg/mg for THC-COOH 0.04 ng/mg for THC and CBN 0.005 ng/mg for CBD, 0.002 ng/mg for CBN 0.006 ng/mg for THC review 0.05 pg/mg 1.0 pg/mg for THC and 0.1 pg/mg for THC-COOH 0.012; 0.037 ng/mg for THC, 0.013; 0.038 ng/mg for CBD, 0.016; 0.048 ng/mg for CBN 0.025 ng/mg; 0.06 ng/mg for CBN and CBD 0.07 ng/mg; 0.12 ng/mg for THC, CBD, CBN 0.02 pg/mg; 0.05 pg/mg 0.045 ng/mg; 0.151 ng/mg for AP, 0.014 ng/mg; 0.048 ng/mg for MA, 0.013 ng/mg; 0.043 ng/mg for MDA, 0.017 ng/mg; 0.057 ng/mg for MDMA, 0.007 ng/mg; 0.023 ng/mg for MDEA 0.125 ng/mg; 0.5 ng/mg 0.02 ng/0.08 mg/vial; 0.05 ng/ 0.08 mg/vial for MA 0.05 ng/0.08 mg/vial; 0.10 ng/0.08 mg/vial for AP 0.25 ng/mg for MDMA, 0.15 ng/mg for MDA, 0.25 ng/mg for MA, 0.19 ng/mg for AP — 1.1 pg/mg; 2.4 pg/mg for MA, 2.1 pg/mg; 4.8 pg/mg for MDMA, 6.1 pg/mg; 14.7 pg/mg for AP, 6.3 pg/mg; 15.7 pg/mg for MDA, 1.4 pg/mg; 3.2 pg/mg for MDEA, 0.3 pg/mg; 0.7 pg/mg for MBDB
References Uhl and Sachs (2004) Kim
et al.
(2005)
Musshoff and Madea (2006) Moore
et al.
(2006b)
Huestis
et al.
(2007)
Nadulski and Pragst (2007) Skopp
et al.
(2007)
Dizioli Rodrigues de Oliveira
et al.
(2007)
Kim and In (2007) Villamor
et al. (2005) Han et al. (2006) Nishida et al. (2006b) Nakamura et al. (2006) Liu et al. (2006) Chèze et al. (2007a) Sample preparation 15 mg of hair; SPE 5 0 –100 mg of hair; methanol 50 mg of hair; LLE 20 mg of hair; SPE 20 mg of hair; SPE 100 mg of hair; HS-SPME 50 mg of hair; LLE 10 mg of hair; HS-SPME 25 mg of hair; LLE 50 mg of hair; LLE 5–19 mg of hair; methanol
1 piece of hair; SPME methanol 50
mg of hair; LLE
20
Table 1. (
Continued
)
Compound(s) MA, MOR, COD, Ketamine MDMA, AP, MDA GHB GHB GHB Diazepam, nordiazepam, oxazepam, alprazolam, OH-alprazolam, nitrazepam, 7-aminonitrazepam, flunitrazepam, 7-aminoflunitrazepam, clonazepam, and 7-aminoclonazepam Bromazepam, clonazepam, 7-aminoclonazepam, hydroxy bromazepam Zopiclone Alprazolam, 7-aminoclonazepam, 7-aminoflunitrazepam, bromazepam, clobazam, diazepam, lorazepam, lormetazepam, midazolam, nordiazepam, oxazepam, temazepam, tetrazepam, triazolam, zaleplon and zolpidem Tetrazepam 26 benzodiazepines and metabolites, zolpidem and zopiclone 7-Aminoflunitrazepam, flunitrazepam, oxazepam, lorazepam, chlordiazepoxide, temazepam, diazepam, nordiazepam, nitrazepam Diazepam and others benzodiazepines Alprazolam
α
-hydroxyalprazolam
Carbamazepine, amitriptyline, doxepin, trihexyphenidyl, chlorpromazine, chlorprothixene, trifluoperazine, clozapine and haloperidol Detection mode CSEI- Sweep-MEKC and LC-MS LC-MS/MS GC/MS and LC/MS GC/MS/MS GC/MS LC-MS/MS LC-MS/MS LC-MS/MS LC-MS/MS LC-MS/MS LC-MS/MS ELISA/ LC/MS/MS MISPE and LC/MS/MS GC/MS GC-MS LOD; LOQ 50
pg/mg for MA
and ketamine, 100
pg/mg
hair for COD and 200
pg/mg hair for MOR
0.1
ng/mg; 0.2
ng/mg for
MDMA, AP, MDA — — 0.1
pg/mg 0.025 – 0.125 ng/mg 1–2 pg/mg; 5 pg/mg for bromazepam, 0.5 pg/mg; 2 pg/mg for clonazepam, 2pg/mg; < 10 pg/mg for 7-aminoclonazepam 0.3 pg/mg 0.5 – 2 pg/mg 1.5 pg/mg; 5 pg/mg 0.5–10 pg/mg 2 ng/mg for ELISA 0.03 – 0.62 ng/30 mg; 0.05–1.02 ng/30 mg for LC/MS/MS 0.09 ng/mg; 0.14 ng/mg for diazepam 0.03 – 0.78 ng/mg; 0.06 –1.32 ng/mg
for others benzodiazepines 7ng/mg; 20
ng/mg 0.1– 0.5 ng/mg References Lin et al. (2007) K lys et al. (2007) Kalasinsky et al. (2001) Goullé et al. (2003) Kintz et al. (2005d) Kronstrand et al. (2002) Chèze et al. (2004) Villain et al. (2004) Villain et al. (2005) Concheiro et al. (2005b) Laloup et al. (2005a) Miller et al. (2006) Ariffin et al. (2007) García-Algar et al. (2007) Shen et al. (2002) Sample preparation 10 mg of hair; LLE 20 mg of hair; methanol 10 mg of hair; buffer
solution and SPE 5mg of hair; LLE 5mg of hair; LLE 10
–30 mg of hair; LLE 20 mg of hair; LLE 20 mg of hair; LLE 20 mg of hair; LLE 20 mg of hair; LLE 20 mg of hair; LLE 30 mg of hair; monobasic phosphate buffer/SPE 30 mg of hair;
MIP/MISPE and SPE 10
mg of hair
10–20
Table 1. (
Continued
)
Compound(s) Clozapine, flupentixol, haloperidol, penfluridol, thioridazine, zuclopenthixol Trimeprazine Clozapine Risperidone, sertraline, paroxetine, trimipramine, mirtazapine, and their metabolites Clozapine Amitriptyline, nortriptyline, dothiepin, doxepin, imipramine, trimipramine, desipramine, mianserin, haloperidol, chlorpromazine, diazepam, flunitrazepam, nitrazepam, oxazepam, temazepam and thioridazine Clomipramine, norclomipramine Methyltestosterone, nandrolone, boldenone, fluoxymesterolone, COC, BE Midazolam, 1-hydroxymidazolam, propofol Fentanyl, alfentanil and sufentanil Fentanyl Selegiline, desmethylselegiline, MA, AP Ibogaine and noribogaine LOD, limit of detection; LOQ, limit of quantitation; CSEI-Sweep-MEKC, cation-selective exhaustive injection and sweeping micell
ar electrokinetic chromatography; ELISA, enzyme-linked
immunosorbent
assay; GC/MS/MS, gas chromatography with tandem mass spectrometry detection; GC/MS, gas chromatography with mass spectrometry d
etection; HS-SPME, headspace solid-phase
microextraction; LC/SACI-MS/MS-SRM, liquid chromatography/surface-activated chemical ionization tandem mass spectrometry single
reaction monitoring; LC//MS/MS, liquid
chromato-g
raphy with tandem mass spectrometric detection; LC/SACI-MS3-SRM, liquid chromatography/surface-activated chemical ionization m
ultiple collisional stage mass spectrometry single reaction
monitoring; LLE, liquid–liquid extraction; MISPE, molecularly imprinted solid-phase extraction; RIA, radioimmunoassay; SPDE, so
lid-phase dynamic extraction; —, no information available.
Detection mode LC/MS/MS LC/MS/MS LC/MS/MS LC/MS/MS LC/MS/MS GC-MS and HPLC-UV LC/MS GC/MS/MS GC/MS and HPLC/DAD GC/MS/MS ELISA and GC/MS LC/MS LC-MS/MS LOD; LOQ 0.017 ng/mg; 0.051 ng/mg for clozapine, 0.011 ng/mg; 0.031 ng/mg for flupentixol, 0.013 ng/mg; 0.039 ng/mg for haloperidol, 0.012 ng/mg; 0.036 ng/mg for penfluridol, 0.014 ng/mg; 0.042 ng/mg for thioridazine, 0.008 ng/mg; 0.024 ng/mg for zuclopenthixol 2pg/mg — — — — 0.5; 0.5 ng/mg for clomipramine, norclomipramine 10 pg/mg for
methyltestosterone, nandrolone, boldenone, fluoxymesterolone 0.1
ng/mg for COC, BE — 1pg/mg 20 pg/mg with ELISA 5 pg/mg with GC/MS 0.01 ng/mg; 0.04 ng/mg
for selegiline, desmethylselegiline and MA. 0.05
ng/mg; 0.2 ng/mg for AP 5 pg/mg; 10 pg/mg for ibogaine 5 pg/mg; 25 pg/mg for noribogaine Sample preparation 50 mg of hair; SPE 20 mg of hair; LLE 50 mg of hair; methanol 100 –200 mg of hair; methanol 5 –15 mg of hair; LLE 2 0 –100 mg of hair; LLE 50 mg of hair; SPE 50 mg of hair; SPE and methanol 50 mg of hair; LLE
(midazolam, 11- hidroxymidazolam), buffer solution (propofol) 50
mg of hair; LLE
10
mg of hair; phosphate
buffer and SPE 5mg of hair; methanol and SPE 50
mg of hair; LLE References Weinmann et al. (2002) Kintz et al. (2006) Thieme et al. (2007) Doherty et al. (2007) Kronstrand et al. (2007)
Couper and McIntyre
(1995) K lys et al. (2005) Gambelunghe et al. (2007) Cirimele et al. (2002) Kintz et al. (2005c) Moore et al. (2007b) Nishida et al. (2006a) Chèze et al. (2007b)
suction and collection on various types of absorbent
swabs.
Several techniques may be used to collect stimulated
saliva. The simplest involves tongue, cheek or lip
move-ments without any external stimulus (Mucklow et al.,
1978). Chewing paraffin wax, Parafilm, teflon, rubber
bands, gum base and chewing gum are usually referred
to as mechanical methods of stimulating saliva
pro-duction. Likewise, a lemon juice drop or citric acid can
be placed in the mouth to provide a gustatory stimulus
for saliva production (Crouch et al., 2004). However, the
stimulation of saliva production may present several
problems which can compromise drug-testing accuracy.
For instance, some drugs and/or metabolites have been
shown to be absorbed by Parafilm, and citric acid
stimulation changes saliva pH and may alter drug
con-centrations. On the other hand, citric acid and cotton
have also been shown to alter immunoassay drug test
results (Crouch, 2005).
A variety of commercial collection devices that
pro-mote easy, quick and reproducible collection are available.
In general, these devices consist of a sorbent material
that becomes saturated in the mouth of the donor, and
after removal the oral fluid is recovered by applying
pressure or by centrifugation. Examples of
commer-cially available devices include Orasure
®(Epitope, Inc.,
Beaverton, OR, USA), Omni-SAL
®(Cozart Biosciences Ltd,
Abington, UK), Salivette
®(Sarstedt AG, Rommelsdorf,
Germany), Drugwipe
®(Securetec, Ottobrunn, Germany),
Intercept
®ORALscreen™ and Quantisal™ (Immunalysis
Corp., Pomona, USA; Spihler, 2004; Samyn et al., 2007).
Care should be taken when using these collection
devices, because deficient recovery of drugs from oral fluid
in the absorbent and adsorption of the drug on device
components are likely to occur (Lenander-Lumikari
et al., 1995; O’Neal et al., 2000; Samyn et al., 2007).
One of the advantages of saliva testing is that the sample
is collected under direct supervision without loss of
pri-vacy. In consequence, the risk of an invalid specimen
being provided or sample adulteration and/or
substitu-tion (which are likely to occur in urine analysis) is reduced.
In addition, monitoring of oral fluid may be especially
advantageous and important when multiple serial samples
are needed or when drug concentrations in children are
required (Kim et al., 2002). Other advantages are that,
in principle, saliva drug concentrations can be related
to plasma free-drug concentrations and to the
pharma-cological effects of drugs.
On the other hand, drugs that are ingested orally as
well as those that can be smoked may be detected
in high concentrations in oral fluid following recent use,
due to residual amounts of drug remaining in the oral
cavity. Therefore, and for these substances, results
may not be accurate because the drug concentration
found in the oral fluid may not reflect the blood-drug
concentration.
Another disadvantage of studying oral fluid is that
people are sometimes unable to produce sufficient
amounts of material for analysis. Moreover, an
impor-tant feature of urine testing is the accuracy of the
on-site tests to detect drugs of abuse in fresh samples.
Unfortunately, this is not the current situation for
oral fluid testing (Grönholm and Lillsunde, 2001; Kintz
et al., 2005a). In addition, oral fluid contains several
macromolecules (mucopolysaccharides and mucoproteins),
which make it less easily pipetted than for instance
urine, and may not be available from all individuals
at all times, since there are drugs that can inhibit
saliva secretion and cause dry mouth. Furthermore,
and because drug concentration on this sample depends
on plasma drug concentrations, drugs that have a short
plasma half-life and are cleared rapidly from the body
are detectable in saliva for a short time only, which
represents a potential disadvantage over hair, sweat or
urine. In fact, saliva and blood have the shortest
detec-tion windows (Spihler, 2004).
Because of the above-mentioned advantages, oral
fluid testing is an analytical tool used in therapeutic
drug monitoring of various drugs (Horning et al. 1977;
Bennett et al., 2003; Quintela et al. 2005; Dams et al.,
2007), pharmacokinetic studies (Schepers et al., 2003;
Huestis and Cone, 2004; Huestis, 2005; Drummer, 2005;
Kauert et al., 2007), and detection of illicit drugs in
impaired driving (Samyn et al., 2002b; Kintz et al.,
2005a; Toennes et al., 2005; Wylie et al., 2005a,b;
Laloup et al., 2006; Concheiro et al., 2007; Drummer
et al., 2007; Pehrsson et al., 2007).
There is no doubt that one of the most impacting
applications of oral fluid testing is in the assessment
of drug-impaired driving, enabled not only by the
development of several on-site collection devices, but
also its easy and non-invasive sample collection
pro-cedure. In addition, the premise of a good correlation
between oral fluid levels and blood levels means that
oral fluid levels may be used to assess the degree of
impairment of a driver.
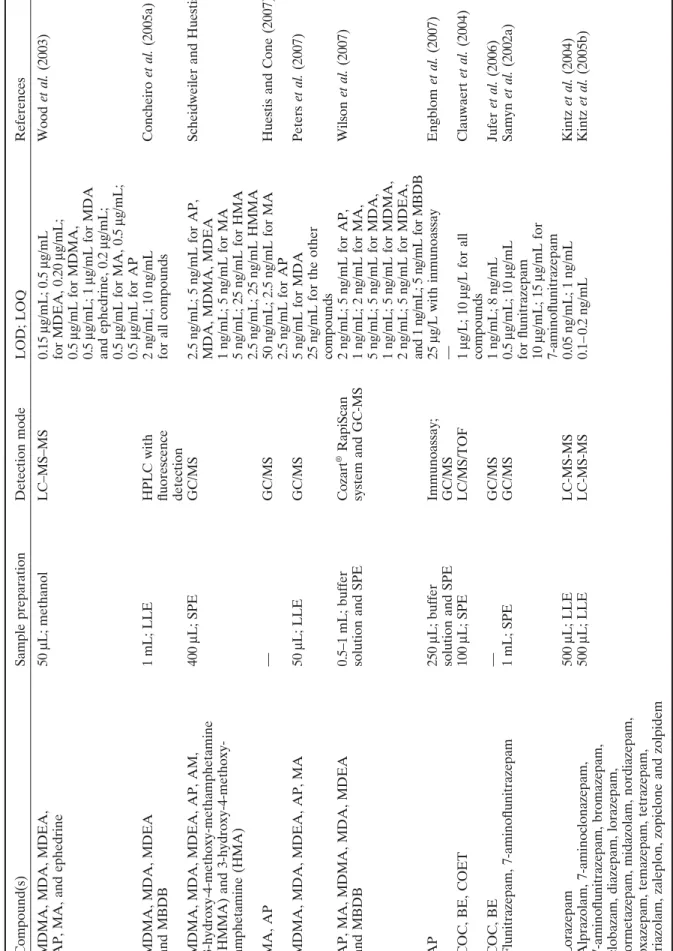
Drugs of abuse are by far the most frequently
detected substances in oral fluid specimens, because
of their implications in workplace medicine and motor
vehicle driving. Therefore, methods are described to
detect opiates, cannabinoids, amphetamines, cocaine,
benzodiazepines and other substances such as ketamine,
GHB, antibiotics, analgesics, cyanides and other tobacco
compounds, and sildenafil (Table 2).
One issue that is gaining popularity within law
en-forcement and traffic regulation agencies is that the
initial testing of oral fluid for drugs can be made in the
field, by means of on-site collecting devices. Several
devices are commercially available for this purpose,
including instruments that provide an electronic readout
(e.g. Dräger DrugTest
®and Orasure Uplink
®, Cozart
Table 2. Classes of compounds detected in oral fluid Compound(s) COD, MOR, MAM, dihydrocodeine and metabolites COC, BE, EME, AEME, MOR, MAM, COD, AP, MDA, MDMA, MDEA, MBDB, ephedrine, THC, CBN, CBD,
11-hydroxy-D
-9-tetrahydrocannabinol
(OH-THC) and THC-COOH COD, MOR, MAM, hydrocodone, hydromorphone, and oxycodone AP, MA, MDA, MDMA, MDEA, MOR, COD, COC, BE MOR, COD, dihydrocodeine, diacetylmorphine and MAM COD, MOR, MAM MOR, COD, MAM, acetylcodeine, and heroin THC THC THC THC-COOH, THC 11-nor-9-carboxytetrahydrocannabinol 2-carboxy-tetrahydrocannabinol, THC, CBN, CBD THC, THC-COOH MDMA, MDEA, AP References Speckl
et al.
(1999)
Samyn and van Haeren (2000) Jones
et al. (2002) Mortier et al. (2002) Cooper et al. (2005a) Campora et al. (2006)
Phillips and Allen (2006) Niedbala
et al. (2001) Concheiro et al. (2004) Laloup et al. (2005b) Moore et al. (2006c) Day et al. (2006) Moore et al. (2006d) Quintela et al. (2007) Samyn et al. (2002c) LOD; LOQ 10 ng/mL — 2ng/mL; 2 ng/mL for
MOR and COD 2ng/mL; 3
ng/mL for MAM,
hydromorphone and oxycodone 3ng/mL; 10
ng/mL for hydrocodone 1.07 ng/mL; 5.5 ng/mL for MDA 0.71 ng/mL; 8.5 ng/mL for MDMA 0.22–1.07 ng/mL; 2 ng/mL
for other compounds 5ng/mL; 5
ng/mL
for all compounds 0.7
ng/mL; 2.3 ng/mL for COD, 2.0 ng/mL; 6.7 ng/mL for MOR, 0.6 ng/mL; 2 ng/mL for MAM 1 μ g/mL; 2 μ g/mL for MAM,
COD and acetylcodeine 2μ
g/mL; 6 μ g/mL for MOR 6 μ g/mL; 10 μ g/mL for heroin 0.37 ng/mL with Inmunoassay 0.2 mL with GC/MS/MS 2 ng/mL; 2 ng/mL 0.5 – 0.1 ng/mL 4 ng/mL for ELISA 2 pg/mL for GC/MS 10 pg/mL; 10 pg/mL 0.5 ng/mL for THC and CBN 1 ng/mL for CBD and 2-carboxy-tetrahydrocannabinol 0.05 ng/mL; 0.1 ng/mL for THC 0.2 ng/mL; 0.5 ng/mL for THC-COOH 1–5 ng/mL
Detection mode GC/MS GC/MS GC/MS LC/MS/MS EIA, GC/MS GC/MS LC–MS–MS Intercept MICRO- PLATE Enzyme Immunoassay and GC–MS–MS LC/MS LC/MS/MS ELISA and GC/MS GC/MS/MS GC/MS LC-MS-TOF LC–MS–MS
Sample preparation 1mL, SPE SPE 0.25–1
mL; SPE 200 μ L; SPE 0.025 – 0.5 mL;
buffer solution and SPE 1mL; LLE 0.5
mL; methanol
and ammonium acetate 25
–200 μ L; LLE 200 μ L; LLE 100 –500 μ L; LLE 1 mL; LLE 100 μ L; SPE 1 mL; SPE 500 μ L; LLE 50 μ L; methanol
Table 2.
(Continued
)
Compound(s) MDMA, MDA, MDEA, AP, MA, and ephedrine MDMA, MDA, MDEA and MBDB MDMA, MDA, MDEA, AP, AM, 3-hydroxy-4-methoxy-methamphetamine (HMMA) and 3-hydroxy-4-methoxy- amphetamine (HMA) MA, AP MDMA, MDA, MDEA, AP, MA AP, MA, MDMA, MDA, MDEA and MBDB AP COC, BE, COET COC, BE Flunitrazepam, 7-aminoflunitrazepam Lorazepam Alprazolam, 7-aminoclonazepam, 7-aminoflunitrazepam, bromazepam, clobazam, diazepam, lorazepam, lormetazepam, midazolam, nordiazepam, oxazepam, temazepam, tetrazepam, triazolam, zaleplon, zopiclone and zolpidem References Wood et al. (2003) Concheiro et al. (2005a)
Scheidweiler and Huestis (2006) Huestis and Cone (2007) Peters
et al. (2007) Wilson et al. (2007) Engblom et al. (2007) Clauwaert et al. (2004) Jufer et al. (2006) Samyn et al. (2002a) Kintz et al. (2004) Kintz et al. (2005b) LOD; LOQ 0.15 μ g/mL; 0.5 μ g/mL for MDEA, 0.20 μ g/mL; 0.5 μ g/mL for MDMA, 0.5 μ g/mL; 1 μ g/mL for MDA and ephedrine, 0.2 μ g/mL; 0.5 μ g/mL for MA, 0.5 μ g/mL; 0.5 μ g/mL for AP 2 ng/mL; 10 ng/mL
for all compounds 2.5
ng/mL; 5
ng/mL for AP,
MDA, MDMA, MDEA 1ng/mL; 5
ng/mL for MA 5 ng/mL; 25 ng/mL for HMA 2.5 ng/mL; 25 ng/mL HMMA 50 ng/mL; 2.5 ng/mL for MA 2.5 ng/mL for AP 5 ng/mL for MDA 25
ng/mL for the other
compounds 2ng/mL; 5 ng/mL for AP, 1 ng/mL; 2 ng/mL for MA, 5 ng/mL; 5 ng/mL for MDA, 1 ng/mL; 5 ng/mL for MDMA, 2 ng/mL; 5 ng/mL for MDEA, and 1 ng/mL; 5 ng/mL for MBDB 25 μ g/L with inmunoassay — 1μ g/L; 10 μ g/L for all compounds 1ng/mL; 8 ng/mL 0.5 μ g/mL; 10 μ g/mL for flunitrazepam 10 μ g/mL; 15 μ g/mL for 7-aminoflunitrazepam 0.05 ng/mL; 1 ng/mL 0.1– 0.2 ng/mL
Detection mode LC–MS–MS HPLC with fluorescence detection GC/MS GC/MS GC/MS Cozart
® RapiScan
system and GC-MS Immunoassay; GC/MS LC/MS/TOF GC/MS GC/MS LC-MS-MS LC-MS-MS
Sample preparation 50 μ L; methanol 1 mL; LLE 400 μ L; SPE — 50 μ L; LLE 0.5–1 mL; buffer
solution and SPE 250
μ
L; buffer
solution and SPE 100
μ L; SPE — 1mL; SPE 500 μ L; LLE 500 μ L; LLE
Table 2.
(Continued
)
Compound(s) Midazolam, bromazepam, tetrazepam, alprazolam, lorazepam, triazolam, flunitrazepam, diazepam and lormetazepam Tetrazepam Oxazepam, temazepam, nordazepam, midazolam, OH-midazolam, alprazolam, OH-alprazolam, OH-Ethylflurazepam, lorazepam, lormetazepam, diazepam, zolpidem, zopiclone, nitrazepam Midazolam, 1
′-hydroxymidazolam
and 4-hydroxymidazolam Temazepam, Oxazepam, Nordiazepam, Tetrazepam, Diazepam Diazepam, oxazepam, temazepam, nordiazepam, lorazepam, chlordiazepoxide, alprazolam, OH-hydroxyalprazolam, desalkylflurazepam, hydroxyethylflurazepam, clonazepam, 7-aminoclonazepam, flunitrazepam, and 7-aminoflunitrazepam. References Quintela et al. (2005) Concheiro et al. (2005b) Smink et al. (2006) Link et al. (2007) Laloup et al. (2007) Ngwa et al. (2007) LOD; LOQ 0.2 ng/mL; 0.5 ng/mL for
alprazolam, lorazepam and bromazepam, 0.1
ng/mL;
0.2
ng/mL for diazepam,
flunitrazepam, lormetazepam, midazolam, tetrazepam and triazolam 0.03
ng/mL; 0.1 ng/mL 10 ng/mL for EMIT 3.9 ng/mL; 13.1 ng/mL for Oxazepam, 2.4 ng/mL; 8.1 ng/mL for temazepam, 2.3 ng/mL; 7.6 ng/mL for nordazepam, 0.7 ng/mL; 2.3 ng/mL for midazolam, 0.3 ng/mL; 1.1 ng/mL for OH-midazolam, 0.3 ng/mL; 1.2 ng/mL alprazolam, 0.2 ng/mL; 0.5 ng/mL OH-alprazolam, 0.8 ng/mL; 2.7 ng/mL for OH-Ethylflurazepam, 0.3 ng/mL; 1.2 ng/mL for lorazepam, 0.4 ng/mL; 1.3 ng/mL for lormetazepam, 2.1 ng/mL; 6.9 ng/mL for diazepam, 3.0 ng/mL; 10.0 ng/mL for zolpidem, 3.9 ng/mL; 13.0 ng/mL for zopiclone, 0.0 ng/mL; 0.1 ng/mL for nitazepam 0.025 ng/mL; 0.05 ng/mL 0.20
ng/mL for temazepam and
tetrazepam, 0.05
ng/mL for
oxazepam, nordiazepam and diazepam 0.02
ng/mL; 0.1
ng/mL for
flunitrazepam and alprazolam 0.05
ng/mL; 0.1
ng/mL for
oxazepam, diazepam, lorazepam, desalkylflurazepam, clonazepam, temazepam, hydroxyethylflurazepam and nordiazepam. 0.5
ng/mL; 1
ng/mL
for 7-aminoclonazepam and chlordiazepoxide 0.2
ng/mL; 0.5 ng/mL for OH-alprazolam 0.1 ng/mL; 0.5 ng/mL for 7-aminoflunitrazepam
Detection mode LC-MS LC-MS-MS EMIT and LC-MS-MS LC-MS LC-MS-MS LC-MS-MS
Sample preparation 500 μ L; LLE 500 μ L; LLE 1.0 – 0.5 mL; LLE 1 mL; LLE 500 μ L; LLE 0.4 mL; SPE
Table 2.
(Continued
)
Compound(s) Ketamine GHB GHB Metronidazole and spiramycin I Propoxyphene Meperidine, tramadol and oxycodone Nicotine and cotinine Nicotine, cotinine, norcotinine, and trans
-3-hydroxycotinine
Cyanide, thiocyanate Sildenafil EIA, Cozart microplate enzyme immunoassay; EMIT, enzyme multiplied immunoassay technique; LC-MS-TOF, liquid chromatography coup
led with quadrupole-time-of-flight mass spectrometry.
References Cheng et al. (2007) Brenneisen et al. (2004) Abanades et al. (2007) Sagan et al. (2005) Rana et al. (2006) Moore et al. (2006c) Toraño et al. (2003) Kim et al. (2005)
Paul and Smith
(2006)
Tracqui and Ludes (2003)
LOD; LOQ 20 ng/mL; 45 ng/mL 0.1 μ g/mL; 0.1 μ g/mL 0.2 μ g/mL 50 ng/mL for metronidazole 15 ng/mL for spiramycin I 40 ng/mL with ELISA 2 ng/mL; 5 ng/mL with GC/MS 25 ng/mL for oxycodone and 50 ng/mL for meperidine
and tramadol with ELISA 10
ng/mL for all
compounds with GC/MS 0.60
ng/mL; 0.011
μ
g/mL
for nicotine and cotinine 5ng/mL; 5
ng/mL 0.026 μ g/mL 0.2 ng/mL; 0.5 ng/mL
Detection mode LC-MS-MS GC-MS LC-MS-MS ELISA; GC/MS ELISA; GC/MS GC/MS GC/MS GC/MS LC/MS
Sample preparation 1mL; SPE 1mL; LLE 100
μ L; LLE 500 μ L; LLE 0.25 mL; SPE 0.25 mL; SPE 2 mL; LLE 0.5 mL; SPE 0.5 mL; LLE 3 mL; LLE
hand-held cartridges that require visual identification,
i.e. providing a visual readout (e.g. DrugWipe
®, iScreen
OFD™, OralScreen
®, Oratect
®, SalivaScreen™). The
main advantage of these devices is that they provide
a preliminary drug result within minutes without the
need for sophisticated laboratory screening equipment.
However, at the moment there is no objective way
to assess its performance, because there is a lack of
consistency in their specifications. For example, for
some of them, cut-off concentrations are used to define
their detectability, whereas for others concentrations
are given when drugs can be detected (Drummer,
2006). The apparent sensitivity is often not defined
in terms of consistency of detection in oral fluid
specimens.
Taking these facts into account, the results provided
by these devices must be confirmed in the laboratory.
Laboratorial techniques include screening procedures
by ELISA-based immunoassays, which in general are
adequate for opioids (Barnes et al., 2003; Kacinko et al.,
2004; Lachenmeier et al., 2006), methadone (Cooper
et al., 2005b), cocaine (Kolbrich et al., 2003; Kim
et al., 2003; Cooper et al., 2004; Lachenmeier et al.,
2006), amphetamines (Kupiec et al., 2002; Laloup et al.,
2005c; Cooper et al., 2006), and buprenorphine (De
Giovanni et al., 2005) and provide a reliable means to
screen oral fluid. Cannabis can be more difficult,
par-ticularly if the immunoassay has little cross-reactivity
to THC. Nevertheless enzyme immunoassay has been
successfully used for this drug (Niedbala et al., 2001;
Moore et al. 2006c). The same applies for
benzodia-zepines despite their low concentrations in oral fluid
(Kemp et al., 2002; Smink et al., 2006).
Concerning sample preparation techniques, analytes
can be extracted by liquid–liquid extraction (Campora
et al., 2006; Quintela et al., 2007; Pujadas et al., 2007),
solid-phase extraction with different types of extraction
cartridges (Mortier et al., 2002; Jones et al., 2002; Wood
et al., 2005; Ngwa et al., 2007), or even solid-phase
microextraction (Pragst, 2007).
The introduction of LC-MS as a routine laboratory
technique has enabled the benefits of high-performance
liquid chromatography (HPLC) separation techniques
to be linked to the high sensitivity and specificity of MS
(Drummer, 2006), which has assisted in the development
of drug testing in oral fluid due to the relatively small
sample volumes that can be obtained. In fact,
concern-ing oral fluid analysis, sample volume may present a
serious problem if several analyses are to be performed.
Mass-spectrometry-based methods have been also
used to screen for a range of drugs (Allen et al., 2005),
some allowing the quantitation of several drugs
(Gunnar et al., 2005; Campora et al., 2006; Scheidweiler
and Huestis, 2006; Peters et al., 2007; Concheiro et al.,
2007; Cone et al., 2007). By the use of GC-MS or
LC-MS including tandem mass spectrometry (LC-MS-LC-MS), low
volumes as low as 0.1 mL.
The main analytical problem in oral fluid testing is
due to the nature of the sampling devices. Indeed,
these systems contain several stabilizers and
preserva-tives that are able to impair precise and accurate
analy-ses. This issue is of particular importance when LC-MS/
MS is used, as ion suppression or enhancement effects
are usually observed. Therefore, care must be taken
when developing new analytical procedures and the
possibility that these effects affect the precision and
accuracy of the assay must be documented. Several
papers addressing this issue have been published (Dams
et al., 2003; Annesley, 2003).
Another point of concern in oral fluid testing is drug
recovery from the collection device, which may have an
undesirable effect on the accuracy of the assay. In fact,
if the analytes are not fully recovered from the device,
the drugs’ concentration on the sample may be
under-estimated, with consequences for their oral fluid to
plasma ratio.
There have been published some recovery studies
using several collection devices, suggesting that
desorp-tion of drugs may limit the usefulness of some
materi-als. For instance, Salivette
®has poor recovery for THC
but is reasonable for codeine, whereas the Cozart
®col-lector has good recovery for THC (Drummer, 2006).
For these reasons, more information on drug recovery
and stability is required, particularly for those drugs that
are likely to be measured in oral fluid.
Sweat
Sweat is a clear, hypotonic solution produced by two
types of glands: eccrine and apocrine located in
epider-mis (Sato et al., 1989). Water (99%) is its main
con-stituent, as well as high concentrations of sodium and
chloride. Low levels of potassium, glucose, lactic and
piruvic acids and urea are also present. The sweat from
apocrine glands also contains proteins and fatty acids.
Sweat acts physiologically by regulating body
tempera-ture, since its evaporation from the skin surface reduces
the excess heat. Sweating is increased by nervousness,
exercise, stress and nausea and decreased by cold. Sweat
excretion is also affected by other factors, such as
ambi-ent temperature, relative humidity, body location (in
general, sweat glands are distributed over the entire
body, except for the lips, nipples and external genital
organs), hormonal imbalances, overactive thyroid gland
and the sympathetic nervous system, and certain foods
and medications.
Between 300 and 700 mL/day of sweat is produced
over the whole body, whereas 2– 4 L/h may be produced
by extensive exercise (Kintz and Samyn, 2000). Several
mechanisms of incorporation of drugs into sweat have
been suggested, including passive diffusion from blood
the skin. Non-ionized basic drugs diffuse into sweat and
become ionized as a result of its lower pH (5.8) as
com-pared with blood (7.4) (Huestis et al., 1999). Generally,
parent drugs are found in sweat, rather than their
polar metabolites, which usually predominate in urine
(Follador et al., 2004). As sweat glands are associated
with hair, it is thought to be a major contributor to
drug appearance in hair, as stated above.
The analysis of drugs in sweat is rarely performed
because it is extremely difficult to estimate sweat
volume and evaluate drug concentrations, and also to
collect adequate quantities. Initially, sweat collection
devices consisted of an occlusive bandage formed by one
to three layers of filter paper or pieces of cotton, gauze
or towel (Kintz and Samyn, 2000). Heat or chemicals
(e.g. pilocarpine) were used to increase sweat
produc-tion. However, this kind of patch was time-consuming
to apply, uncomfortably large, prone to detachment
and yielded a small volume of sweat for analysis. In
addition, it was found to alter the steady-state pH of
the skin, the types of bacteria that colonize the skin and
the transport characteristics of the skin, producing skin
irritation after approximately 24 h (Huestis et al., 1999).
To overcome these difficulties, non-occlusive sweat
collection devices have been developed, consisting of
an adhesive layer on a thin transparent film of surgical
dressing to which a rectangular absorbent pad is
attached. Non-volatile substances from the environment
cannot penetrate the transparent film, which is a
semipermeable membrane over the pad that allows
oxygen, water and carbon dioxide to pass through the
patch, leaving the skin underneath healthy (Kintz and
Samyn, 2000). During wearing of the patch, as sweat
saturates the pad and slowly concentrates it, drugs
present in sweat are retained, while water evaporates
from the patch. Using this non-occlusive design it is not
possible to quantitate the concentrations of analytes
in sweat, since the whole volume of secreted sweat is
not known. Nevertheless, the wear period may be
extended (usually a wear period of seven days is used)
without skin irritation. Therefore, a cumulative record
of drug exposure can be obtained (Huestis et al., 1999).
In addition, the sweat patches have a unique
identifi-cation number, which aids with chain of custody and
identification. On the other hand, the patch’s design
makes sample adulteration difficult, because attempts
to remove it before the end of the collection period
or tamper with it are readily visible to personnel
trained to monitor the sweat patch.
Prior to attaching the patch, skin is cleaned with an
alcohol wipe, both to remove external contamination
from drugs in the environment and to improve patch
adherence. Kidwell and Smith (2001) have shown that
inappropriate cleansing of the skin prior to patch
place-ment can result in contamination of the patch. Careful
preparation of the skin prior to application of a
collec-tion device helps to reduce the possibility of bacterial
growth and previous skin contamination.
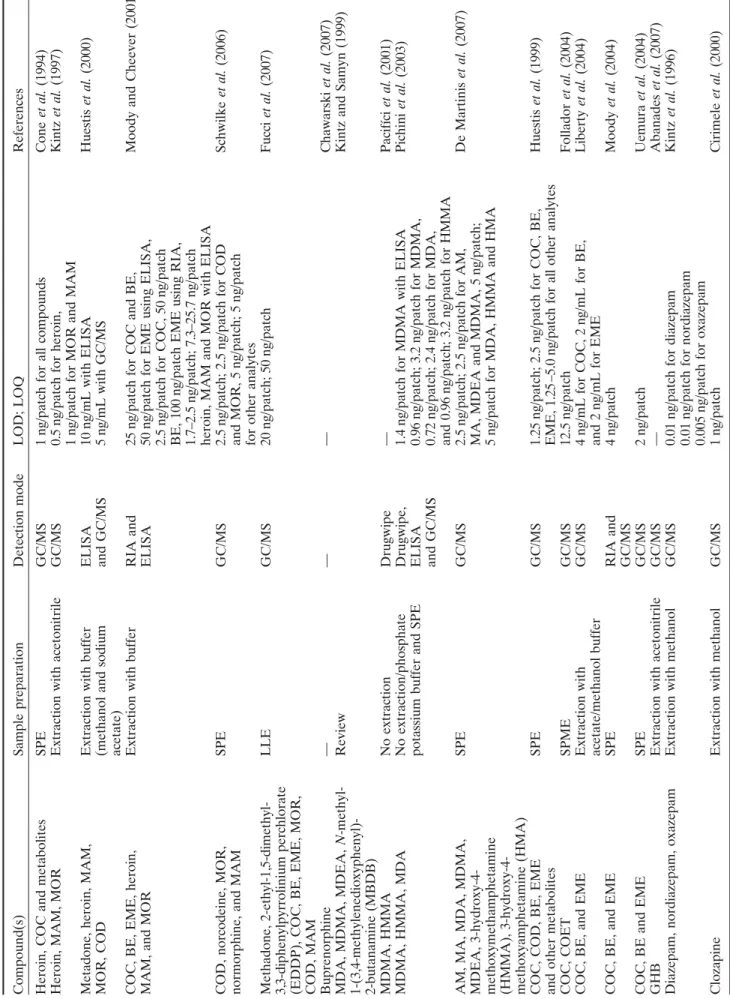
Several papers have been published on sweat testing,
including both chromatographic (using mass
spectro-metry) and immunoassay techniques, particularly for
the determination of drugs of abuse. The main detected
drugs are opiates, buprenorphine, amphetamines and
designer drugs, cocaine and metabolites, and GHB.
Pres-cription drugs, such as benzodiazepines and
antipsycho-tics, have also been detected. A summary of the main
detected drugs can be seen on Table 3.
In general, sweat testing has several advantages over
blood and urine, including non-invasive collection,
reduced opportunity for sample adulteration, and in
some cases, longer detection windows than for plasma
or urine. Since the patches are worn for several days,
sweat analysis provides cumulative measure of drug
exposure, detecting both parent drugs and metabolites.
However, as stated above, there is a lack of information
concerning dose–response relationships, and analytes are
present in low concentrations. In addition, care should
be taken during application and removal of the patch,
because of the risk of contamination. Another
draw-back of sweat analysis is related to the impossibility
of knowing accurately the volume of sample that was
collected. In fact, there is considerably inter-individual
variability, due to large variations in sweat production,
which makes it difficult to quantitate the amount of
sweat that is secreted over a period of time. Therefore,
sweat testing is considered a qualitative monitoring
method.
Meconium
Meconium is the first faecal matter passed by a neonate
and it is identified most commonly by its dark green/
black color and a lack of the odor of regular feces. It is
a highly complex matrix consisting of water,
mucopoly-saccharides, bile salts, bile acids, epithelial cells and
other lipids, as well as the residue of swallowed
amni-otic fluid (Gourley et al., 1990; Ostrea et al., 1994;
Kwong and Ryan, 1997; Moore et al., 1998; Chan et al.,
2004; Gareri et al., 2006).
Despite being variably reported to form from within
the first trimester (Browne et al., 1992) to as late as
five months of gestation (Kintz and Samyn, 2000), it is
generally accepted that meconium begins to form at
approximately 12 weeks of gestation, because it is at
this time that fetal swallowing of amniotic fluid begins
(Gareri et al., 2006). The formation of meconium has
been evidenced at this stage by the presence of cocaine
found in the meconium of early gestational fetuses.
Fetal swallowing is thought to be the mechanism by
which drugs are concentrated in the meconium; as the
fetus releases urine into the amniotic fluid, any excreted
compounds and metabolites are then swallowed and
ultimately deposited into the meconium (Browne et al.,
1992; Ostrea et al., 2006). In addition to this
mecha-nism, fetal exposure is a product of maternal
consump-tion, metabolism and eliminaconsump-tion, placental transfer and
metabolism, and also fetal metabolism (Chan et al.,
2004).
Some authors state that meconium collection from
a newborn is more successful than urine collection
(Maynard et al., 1991), which makes meconium the
specimen of choice for detecting in utero drug exposure.
Furthermore, drug concentrations in meconium
gener-ally are higher than in urine because of its accumulation
over several months of gestation (Ostrea et al., 2001;
Bar-Oz et al., 2003; Eyler et al., 2005). These factors
make meconium an optimal matrix for identifying
in utero exposure as it is considered a preserved record
of the ultimate exposure by the fetus.
Furthermore, it has been suggested that meconium
is a more sensitive matrix to analyze for neurotoxicants
in the environment when compared with other specimens,
because of its wide window of exposure to these
pounds. In fact, there is an ongoing study which
com-pares the analysis of various matrices (maternal blood,
maternal hair, infant hair, cord blood and meconium)
to detect exposure to various pesticides. Preliminary
results among 750 mother/infant dyads shows a
signifi-cantly higher percentage of exposure by meconium
analysis (Ostrea et al., 2006).
One issue that should be taken into account when
analyzing meconium is the possibility of urine
contami-nation, which is likely to occur when a neonate
has been exposed to a drug near-term and evacuates
drug-contained urine into a meconium-soiled diaper,
leading to an increase in the sensitivity of meconium
screening due to the augmentation of drug levels in the
specimen. However, this contamination can interfere
with the development of dose–response relationships
with regard to the level of drugs present in meconium.
Indeed, in this case, the drugs have not been
metabo-lized to the same degree as meconium-deposited drugs,
and therefore the expected relationships between drugs
and metabolites will be different in meconium.
Meconium collection is easy and non-invasive, and
it is achieved by scraping the contents (0.5 g minimum)
of the soiled diaper into a specimen collection container,
for which contributes its thick and viscous nature.
Stud-ies indicate that drugs are stable in this specimen for
up to 2 weeks at room temperature and for at least
1 year if frozen (Kintz and Samyn, 2000).
One major advantage of meconium is a relatively
wide window for sample collection. Indeed, meconium
contents can provide a history of a fetal swallowing and
bile excretion, representing a window of prenatal drug
exposure of about 20 weeks prepartum (Moore et al.,
1998; Kintz and Samyn, 2000). It represents, therefore,
Table 3. Compounds detectable in sweat samples Compound(s) Heroin, COC and metabolites Heroin, MAM, MOR Metadone, heroin, MAM, MOR, COD COC, BE, EME, heroin, MAM, and MOR COD, norcodeine, MOR, normorphine, and MAM Methadone, 2-ethyl-1,5-dimethyl- 3,3-diphenylpyrrolinium perchlorate (EDDP), COC, BE, EME, MOR, COD, MAM Buprenorphine MDA, MDMA, MDEA,
N
-methyl-1-(3,4-methylenedioxyphenyl)- 2-butanamine (MBDB) MDMA, HMMA MDMA, HMMA, MDA AM, MA, MDA, MDMA, MDEA, 3-hydroxy-4- methoxymethamphetamine (HMMA), 3-hydroxy-4- methoxyamphetamine (HMA) COC, COD, BE, EME and other metabolites COC, COET COC, BE, and EME COC, BE, and EME COC, BE and EME GHB Diazepam, nordiazepam, oxazepam Clozapine References Cone et al. (1994) Kintz et al. (1997) Huestis et al. (2000)
Moody and Cheever (2001) Schwilke
et al. (2006) Fucci et al. (2007) Chawarski et al. (2007)
Kintz and Samyn (1999) Pacifíci
et al. (2001) Pichini et al. (2003) De Martinis et al. (2007) Huestis et al. (1999) Follador et al. (2004) Liberty et al. (2004) Moody et al. (2004) Uemura et al. (2004) Abanades et al. (2007) Kintz et al. (1996) Cirimele et al. (2000)
LOD; LOQ 1ng/patch for all compounds 0.5
ng/patch for heroin,
1
ng/patch for MOR and MAM
10
ng/mL with ELISA
5
ng/mL with GC/MS
25
ng/patch for COC and BE,
50
ng/patch for EME using ELISA,
2.5
ng/patch for COC, 50
ng/patch
BE, 100
ng/patch EME using RIA,
1.7–2.5
ng/patch; 7.3–25.7
ng/patch
heroin, MAM and MOR with ELISA 2.5
ng/patch; 2.5
ng/patch for COD
and MOR, 5
ng/patch; 5
ng/patch
for other analytes 20
ng/patch; 50
ng/patch
— — 1.4
ng/patch for MDMA with ELISA
0.96
ng/patch; 3.2
ng/patch for MDMA,
0.72
ng/patch; 2.4
ng/patch for MDA,
and 0.96
ng/patch; 3.2
ng/patch for HMMA
2.5
ng/patch; 2.5
ng/patch for AM,
MA, MDEA and MDMA, 5
ng/patch;
5
ng/patch for MDA, HMMA and HMA
1.25
ng/patch; 2.5
ng/patch for COC, BE,
EME, 1.25
–5.
0
ng/patch for all other
analytes 12.5 ng/patch 4 ng/mL for COC, 2 ng/mL for BE, and 2 ng/mL for EME 4 ng/patch 2 ng/patch — 0.01
ng/patch for diazepam
0.01
ng/patch for nordiazepam
0.005
ng/patch for oxazepam
1
ng/patch
Detection mode GC/MS GC/MS ELISA and GC/MS RIA and ELISA GC/MS GC/MS — Drugwipe Drugwipe, ELISA and GC/MS GC/MS GC/MS GC/MS GC/MS RIA and GC/MS GC/MS GC/MS GC/MS GC/MS