THE QUALITY OF MONITORING DATA IN CIVIL ENGINEERING
WORKS
(Research-in-Progress)
Ana Lucas
Laboratório Nacional de Engenharia Civil, Portugal
ana.lucas@lnec.pt
António Palma-dos-Reis
Instituto Superior de Economia e Gestão, Portugal
apreis@iseg.utl.pt
Mário Caldeira
Instituto Superior de Economia e Gestão, Portugal caldeira@iseg.utl.pt
Abstract: This paper presents the research and discusses the findings concerning the identification and definition of quality dimensions related to the monitoring data obtained in the safety control of major civil engineering works, namely dams and bridges. The analysis of the behavior and the safety evaluation of these works essentially depend on the quality of the data collected by the sensors, named the observation data, besides the quality of the models and, last but not least, the knowledge and experience of the experts involved.
In addition, LNEC1 stores and preserves the observation data concerning major civil engineering works, which represents an important research source for LNEC and Universities and, thus, shapes itself as an e-Science scenario. Differently from other e-Science environment authors, we have not restricted our work to objective dimensions, whose measures can be calculated automatically. It appears, from the experts’ opinions, that some subjective dimensions can largely enrich the quality information about archived data at the expense of some additional work in data curation.
In the development of this research we used an online version of the Delphi method with the Q-Sort technique, complemented with upstream interviews and a downstream meeting with the experts. We found out, and sorted by the importance level assigned by the experts, ten dimensions for the quality of observation data, which are error-of-observation, coherence, relevancy, interpretability, timeliness, completeness, accessibility, appropriate amount of data, access security and preservation.
Key Words: Data Quality Dimensions, Monitoring Systems, Sensors, Civil Engineering Works
I
NTRODUCTION
Monitoring of major civil engineering works plays a key role in the study of the behavior of these works, and it is of major importance for their safety control, for the calibration of the models, and for the
1
identification of topics requiring further study and research. Currently, monitoring is the major source of knowledge concerning the real behavior of those works.
Monitoring activities essentially include: the selection of some variables related to the main actions, the properties of the works, and the direct effects of actions (displacements, strains, etc.); the placement into the works of devices or sensors able for the observation of those variables; and their periodic, manual or automatic, measurement along the lifetime of the works. The data collected from such measurements, complemented by the data observed through visual inspections, after validation, analysis and interpretation, is the basic input of the models used for safety evaluation.
The observation data concerning major civil engineering works must be stored and preserved by the owners along the lifetime of the works, and in some cases by national agencies. It is the case of the records of major Portuguese dams stored by the Laboratório Nacional de Engenharia Civil (LNEC), which represent an important research source for LNEC and universities. This situation shapes itself as an e-Science scenario and we are currently running a research project aimed at integrating the concepts of data quality and digital preservation: firstly we will consider the data preservation as a dimension of its quality, on the other hand the quality indicators will be preserved as metadata in the digital curation process [16].
While defining data quality as fitness for use by data consumers [35], it is necessary to understand what must be measured and how it should be measured. The data quality dimensions are, in this case, the characteristics of data quality that are meaningful for the security experts and researchers of civil engineering works. Although we intuitively associate data quality with intrinsic characteristics, such as accuracy, we easily conclude that by using the above concept, that there are other meaningful characteristics of data quality that are prized by their users, such as interpretability, relevancy, etc.
Data quality in e-Science scenarios has been addressed, for instance, under the Qurator project [17, 20] and by [16], whereas sensor data quality has been addressed by many authors, such as [5, 10, 11, 32]. Like other authors, such as [11, 16, 17, 24], we have used the data quality dimensions available in the literature, selecting those applicable to the area under review and adapting their definitions.
While considering, as it follows from the definition, that data quality depends on their users’ needs, we have decided, like [16], to release the measures of data quality dimensions assigned by their suppliers that, in this, as in many other cases of e-Science environments, are both their first and main users. Thus, other users will have measures assigned by experts, which will allow them to select the data based on their own quality needs. Differently from [16], and because we consider data as a product whose quality is perceived by its users, we have not restricted the dimensions to be selected by the experts to the objective (or impartial [28]) ones, giving them also the opportunity to choose the subjective ones that are applicable, which will be measured through surveys [13] administered to their suppliers and first users. This document presents the work and findings regarding the identification and definition adaptation of the quality dimensions of monitoring data used in safety control of major civil engineering works.
To the best of our knowledge, this work includes the following innovative aspects:
– Identification and definition of quality dimensions of the monitoring data in major civil engineering works;
B
ACKGROUND
This section involves a brief presentation of the fundamentals underlying this work, namely the monitoring of major civil engineering works and data quality dimensions.
The Monitoring of Major Civil Engineering Works
Monitoring of civil works includes:
a broad set of measures which allow a permanent knowledge on the condition of the works, aiming at the detection of events that may endanger the reliability (safety and functionality) of the works and to take the necessary corrective measures to prevent or mitigate possible deteriorations. Beyond this fundamental objective for the reliability control of the works, monitoring also allows obtaining important information for the modeling, design and implementation of future works, as well as to assess the reliability criteria established by the regulations and the professional practice, and to identify the topics that need further studies and research [18].
The project of major civil engineering works, like dams and bridges, should include the observation plan
with the measures to be implemented for the inspection and monitoring of the works, namely with the main control variables and observation devices that will compose the monitoring system. This system is implemented during the construction of the works, and if adequately operated along the work’s lifetime, reduces drastically the probability of an undetected abnormal event.
The data collected through the monitoring system should be adequately validated, analyzed and processed, in order to obtain indicators on the work’s performance and to evaluate their safety by means of models. Finally, the monitoring data should be appropriately stored, in order to enable further studies.
For a better understanding of what is at stake in the monitoring of civil engineering works, some concepts will be defined [18]:
– The observation data are the values obtained directly from the observation devices or sensors, sometimes in the form of electrical quantities or otherwise, related to the variables selected for controlling the behavior of the works, such as displacements, deformations, water flows and pressures, etc;
– The observation results are the values of the variables selected for controlling the works behavior, obtained from transformation of the data through constants specific to each observation device, in accordance with calibration performed at the placement of the device and repeated after a period of time more or less extended;
– The interpretation of the observation results includes the correlation of different observation results, namely those concerning the actions (temperatures, water levels, etc.), the characteristics of the structure (deformability, strength, etc.) and the structural responses (or structural effects) (displacement, deformation, stress, etc.), as well as the possible consequences of these effects (cracking, sliding, overturning, etc.), which is carried out through more or less sophisticated models. These models are usually classified as statistical or deterministic, the latter including a larger extent of physical assumptions (mechanical, thermal, etc..) on the problem under analysis.
Furthermore, it is considered that the analysis and interpretation of the observation results can provide information on the quality of the observation data.
– The data has no quality;
– The assumptions which shaped the model are no more adequate (the model lost quality), owing to significant change in the characteristics of the work.
Data Quality Dimensions
The data quality dimensions presented in the literature refer to both the data in extension, ie, their values, and in intention, ie their definition (schema). During this work only the first part will be addressed, because the raw material for the works’ safety monitoring is the data. The second aspect mainly relates to the relational schema normalization (according to Codd) and was not subject to this study.
Three approaches to dimension identification and definition available in literature were identified in [2], for which the first authors are identified: a) theoretical [33]; b) empirical [35] and c) intuitive [21].
Although there is no consensus among the various proposals, neither in the number of dimensions, nor on their definitions, there are four dimensions, perhaps the most significant ones, although with small differences in definition, that are common to the three proposals: accuracy, timeliness, completeness and consistency.
Concerning the quality of data for safety monitoring of major civil engineering works, the quality requirements that drive our choice of quality dimensions are, as in [24]:
– Has followed a rigorous process for its definition;
– Keeps focus on the values of data, which constitute the raw material for safety monitoring of civil works;
– Consider the data as a product whose production process can be improved to achieve a higher quality.
Given the above and considering the comparative analysis of various proposals made by [24], our choice is, above all, the empirical approach [35].
Despite that, and understanding that data quality dimensions and their relative importance are highly dependent on the specific field of application [11, 16, 17, 24], it will be examined, considering the expert’s opinion, which of the fifteen dimensions proposed by [35] are applicable to observation data, adjust their definitions, and possibly seek other significant dimensions in that area and that have not been proposed.
R
ESEARCH
M
ETHODS
This is a predominantly qualitative research, which sought to interpret the views of a wide range of specialists on civil engineering works monitoring about the observation data quality dimensions and their definitions. For this purpose interviews were used, as well as a series of Delphi questionnaires with Q-Sort, available online and a final meeting to review the results obtained in the Delphi study, select the dimensions to retain and refine their definitions.
The Delphi Method with the Q-Sort Technique
The original Delphi method was developed by Norman Dalkey of the RAND Corporation in the 1950’s for a U.S. sponsored military project. It is an iterative process to combine the opinions of a group of experts in order to reach a consensus.
method that allows for the analysis of qualitative data, that doesn’t use random sampling, using, however, a number of experts. An expert in the context of a Delphi study is a specialist in the field of knowledge within which the study is developed.
A Delphi study consists of a series of questionnaires, each one corresponding to a round. The rounds continue until reaching a consensus or finding that it is not possible.
The Classical Delphi method is characterized by four key features [22] cited by [30]: – Anonymity of Delphi participants;
– Iteration: allows the participants to refine their views in light of the progress of the group’s work from round to round;
– Controlled feedback: informs the participants of the other participant’s perspectives, and provides the opportunity for Delphi participants to clarify or change their views;
– Statistical aggregation of group response: allows for a quantitative analysis and data interpretation.
The first round may start with a set of open questions (in this specific case data quality dimensions) or a set of questions proposed by the researcher after the literature review [8] cited by [38], [30]. Experts may propose, in any round, new issues (in this case, data quality dimensions) relevant from their point of view. The experts selected for the study were specialists and researchers from LNEC, responsible for the monitoring and security control of major civil engineering works, including embankment and concrete dams and bridges. Despite all of them working on the LNEC campus, the number of individuals involved (about 40) and several agenda problems ultimately dictated the use of Delphi, which was supplemented by upstream interviews and a downstream meeting with selected experts, as proposed by [6] and [30]. Delphi techniques are most appropriate under two circumstances [14] cited by [38]:
– "The problem does not lend itself to precise analytical techniques but can benefit from subjective judgments on a collective basis;
– Individuals who need to interact cannot be brought together in a face-to-face exchange because of time or cost constraints".
In this study both the above circumstances applied, so it was decided for the use of that method.
The Q-methodology was developed by [31] cited by [23], and provides grounds for the systematic study of subjectivity. The distinctive feature of the Q-Sort technique, a component of Q-methodology, is that it is required of panel members to order the questions provided under a predefined distribution, usually approximately normal.
The Q-Sort technique is usually preferred to a Likert scale when one wants an order and not just a weighting.
This research has been developed in three complementary steps:
1. Questionnaire preparation: the data quality dimensions proposed by [35] have been evaluated and discussed in a series of interviews with specialists in order to select those that best suit the observation data, adjust their definitions and, possibly, add new dimensions. At this stage it was also submitted an initial version of the questionnaire to three participants, to validate their understanding of the dimensions’ definition;
2. Application of the Delphi questionnaire with Q-Sort to a set of experts in major civil engineering works security monitoring;
D
ATA
C
OLLECTION
,
R
ESULTS AND
D
ISCUSSION
First Stage - Interviews with Experts
At this stage the dimensions and corresponding categories of the quality of observation data for major civil engineering works were pre-selected from the set defined in the empirical approach [35].
In order to select and (re)define the dimensions of observation data for major civil engineering works, to be later assessed by experts using the Delphi method, interviews were held with six senior experts.
As a result of these interviews and by consensus:
– The following dimensions were withdrawn because, according to the experts, they are not applicable or are redundant with respect to others: objectivity, believability, reputation, value-added, ease of understanding, concise representation;
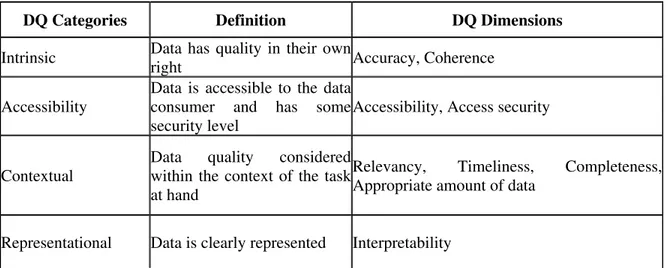
– The representational consistency dimension has been redefined similar to consistency in [21], and moved from the representational category to the intrinsic one. The experts preferred to use the term coherence (see Table 1.);
– The accuracy dimension was defined similar to [21];
– The other dimensions were analyzed and their definitions adapted to the domain under analysis. The following are the results obtained in this first step.
DQ Categories Definition DQ Dimensions
Intrinsic Data has quality in their own
right Accuracy, Coherence
Accessibility
Data is accessible to the data consumer and has some security level
Accessibility, Access security
Contextual
Data quality considered within the context of the task at hand
Relevancy, Timeliness, Completeness, Appropriate amount of data
Representational Data is clearly represented Interpretability
Table 1 - Categories and dimensions of quality of observation data in major civil engineering works, after the first stage. Adapted from [35]
Below are the dimensions and their definitions, which were, where necessary, adjusted to the domain under analysis.
Intrinsic Category Dimensions Definition
1. Accuracy – A function of the distance between v’ (measured value) and v (true value). In the case of observation systems that dimension includes several different aspects, namely:
a. Suitability of the observation and the reading devices2 to measure the required variable (precision, resolution, ...);
b. Proper use of the reading devices by the observers (in manual readings);
c. Quality of data transmission between the computer in the civil work and the server (in automatic readings).
Considering the accuracy normalized between 0 and 1 (where 0 represents the least desirable and 1
2
the most desirable score), it could theoretically be calculated (considering the exponent s a sensitivity parameter) as:
Erro! Era esperado um dígito.
2. Coherence – To what extent the data is compatible with each other and satisfies the rules applicable to it. The evaluation of this dimension may require interpretation and models.
Accessibility Category Dimensions Definition
1. Accessibility – Data are available and easily and quickly retrieved. 2. Access Security – Access to data can be restricted and hence kept secure.
Contextual Category Dimensions Definition
1. Relevancy – To what extent the data is effective for the intended purposes and is efficient in its use. This dimension is materialized in the definition of the observation system.
2. Timeliness – The age of the data available from the information system is appropriate for the task at hand.
According to [1] the timeliness of a raw (or primitive) data item can be calculated as:
1 , 0
Timeliness is thus measured on a continuous scale from 0 to 1, where 0 means that data are unacceptable from the timeliness viewpoint and 1 that data meet the most strict timeliness standard [1]. Currency refers to the age of the data item, volatility to how long the item remains valid and the exponent s is a parameter that allows controlling the sensitivity of timeliness to the currency-volatility ratio.
3. Completeness - To what extent there are no missing readings (due to human failure, reading devices malfunction or communications disabilities) and the data is necessary and sufficient to respond adequately to the problem under analysis.
4. Appropriate amount of data – Thequantity of available data is appropriate.
This dimension is related to the frequency of measurements and the ability to change that frequency according to various needs.
The volume of data should be the minimum that allows an appropriate response to the intended purposes, although it is desirable that there is some redundancy regarding the data with greater relevance.
Representational Category Dimension Definition
1. Interpretability – Data are in appropriate language and units and the data definitions are clear.
The nine selected dimensions and its definitions were placed in an online Delphi questionnaire, with Q-Sort, offered by Universidade do Minho in http://www3.dsi.uminho.pt/gavea/delphi/default.asp
Second Stage – Delphi Study
This section will present the rounds of the Delphi study, as well as the results obtained.
1st Round of the Delphi Study
In the 1st round 36 experts in the monitoring of concrete and embankment dams and bridges were asked, to whom the 9 dimensions shown in Table 1 were presented, with the definitions provided in the previous topic. According to [30] in the case of a homogeneous group, 10 to 15 participants are sufficient, but it is also pointed out that a greater number of participants increase the quality of the decision.
This round was held for two weeks and was answered by 22 experts, representing a rate of 61% which is within the average. Contact with the experts was held by email and phone.
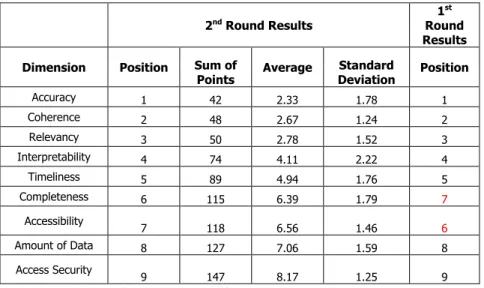
important) was given 1 point, 2 points to the second and so on until the last (least important) to which 9 points were given. The sum of points obtained by each dimension, according to the members’ responses, provides its score. The ranking is obtained by ascending order of the scores, the lowest sum is the most important and the highest sum is the least important. The results are presented in Table 2.
The experts attributed a prominent position to accuracy and coherence, which received the same number of points (60), only differed by the standard deviation.
To assess the level of agreement among panel members, Kendall's W coefficient was used [22, 23, 26], whose value was 0.513, significant at 0.000 level which, according to [26], means moderate agreement. This coefficient ranges from 0 (no agreement) and 1 (perfect consensus). There were no proposals for new dimensions.
2nd Round of the Delphi Study
For the 2nd round 24 experts were invited: the 22 who responded to the 1st one and two national experts in concrete and embankment dams.
This round lasted for two weeks and 18 of the 24 experts responded, representing a response rate of 75%. According to the answers from the 2nd round, a new ordering of the data quality dimensions was obtained by relevance. The results are shown in the following table.
!! " "
!! " "
!!
# $ "
!! %
" "
Table 2 - Ordering of the dimensions from the 1st and 2nd rounds
The Kendall's W coefficient is 0.615, significant at 0.000, which, according to [26] is close to strong agreement (0.7), by which we decided to end the Delphi Study.
The Spearman's rho correlation coefficient [23] concerning the dimensions order between the 1st and 2nd round is 0.967, significant at 0.01 level. Indeed between the 1st and 2nd round the ordering has remained constant with only position exchanges between the 6th dimension (completeness) and the 7th (accessibility). This reflects the theory associated with the Q-Sort which states that the panel members are more confident on the most and least important issues.
By interpreting Table 2 we may deduce, intuitively, the importance that the panel members assigned to the various quality dimensions:
– The most important are accuracy, coherence and relevance. The experts clearly gave the 1st place to accuracy, followed closely by coherence and relevance;
– Interpretability and timeliness come next;
– The least important are completeness, accessibility and amount of data and, ultimately, the access security.
assigned by panel members and its standard deviation.
The following facts must be noted:
– The timeliness dimension is uncommonly considered in 5th position;
– None of the accessibility category dimensions were highly addressed by the experts.
Third Stage – Meeting with Experts
We invited four of the most senior Portuguese experts in civil works monitoring, three of which also participated in the Delphi study, for a final meeting. These specialists surrounded themselves with three other researchers, two of which also responded to the Delphi study.
The meeting had the following agenda:
– Refine the definitions of the quality dimensions for the observation data;
– Understand why the timeliness dimension only occupies the 5th place (intuitively it would be expected that this dimension was closer to the top);
– Choose the dimensions that will remain, in order to evaluate and improve the quality of the observation data, taking into account the ordering of the 2nd round;
– Understand if the relevant dimensions, identified in the preceding paragraph are valid for manual and automatic reading devices. If not, it should be identified which of them apply to each type of device.
Refine the definitions of the quality dimensions for the observation data
The experts decided to add a new dimension, preservation, to the quality dimensions covered in the Delphi study, with the following definition: ensuring that any user or system can access and interpret the data in the context in which they were created. This dimension was consensually placed in the accessibility category.
Without changing the basic concept, the definitions of the following dimensions were refined: accuracy, accessibility, access security, relevance, completeness and amount of data. These have been defined as follows:
– Accuracy - The accuracy dimension has been replaced by the error-of-observation dimension because, according to the experts, it is mostly used in civil works monitoring. Considering v as the true value of the variable under measure and v´ as the measured value, we could theoretically calculate the error of-observation of the value v’(normalized to between 0 and 1, where 0 represents the most desirable and 1 the least desirable score) as:
1, ! "#
The exponent s is a parameter that allows us to control the sensitivity of the error. .
The fact is that we will never know the true value v of the variable, so we must instead calculate the error-of-observation. The experts considered that the error-of-observation depends on multiple factors, the two most significant being the precision of the observation device (po),
defined as the smallest change that the observation device can provide and the resolution of the reading device (rr), defined as the smallest change that the reading device can distinguish [7]:
$ % $&'(, )*
and reading devices at the time of definition of the observation system, and through the frequency of the equipments’ calibration.
– Accessibility - Data is available and retrieved easily and quickly as well as obtained in the proper format. Progressively this access will be available anywhere that has Internet access (cloud computing).
Ex: Finding the results and entering them into a spreadsheet.
– Access Security - Data can only be retrieved, updated or inserted by authorized users.
– Completeness - This dimension is directly related to the operationalization of the observation plan.
To what extent there are no readings missing (due to missing campaigns, human failure, observation or reading devices’ malfunction or communications disabilities) and data is necessary and sufficient to respond adequately to the problem under analysis.
– Appropriate Volume of Data – The quantity of available data is appropriate to the intended purposes.
The volume of data should be the minimum that will allow an appropriate response to the intended purposes, although it is desirable that there is some redundancy regarding the data with greater relevance.
This dimension relates to:
- The frequency of measurements and the ability to change that frequency according to various needs;
- The ability to interpret only the data that meets certain conditions. It must be noted that, as changes or interpolations of data values are not accepted, only filters that do not modify these values can be used.
Understanding the timeliness dimension positioning
To a better understanding of what follows, we recall the timeliness definition in the context of this work: the age of the data available from the information system is appropriate for the task at hand.
The participants explained that they considered "information system" in a strict sense as the application system supported on a relational database where only a subset of the observation data is saved and the interpretation models implemented.
Beyond what was stated, the position of this dimension is, according to the specialists, due to the fact that safety monitoring is usually carried out expeditiously and upstream of the data storage in the information system.
– For all the works with automatic readings, the values of these readings are momentarily analyzed for expeditious security monitoring. Despite this, and currently, data is only stored in the information system to be interpreted by models in certain time intervals or in situations when something abnormal happens;
– In major concrete dams, the regulation requires that there is a person responsible for technical operation in the works, who makes visual inspections on a daily basis and does the reading of main observation devices (in the case of manual readings). In the case of anomaly detection (eg. opening of cracks in a dam) a campaign is immediately made expeditiously (where only the most significant observation devices are read), whose data must be collected immediately on the information system to be interpreted by models, and in this case the timeliness is very important. In the case of manual readings, complete campaigns are routinely carried out, where all observation devices are read and the data is stored in the information system to be interpreted by models.
Despite what was stated we still consider the relative position of the timeliness dimension as an open problem.
Dimensions of Observation Data Quality to Keep
The specialists decided to retain the nine dimensions presented in the Delphi study, to which preservation
must be added.
It was unanimously decided that the ten dimensions are valid for manual and automatic reading devices.
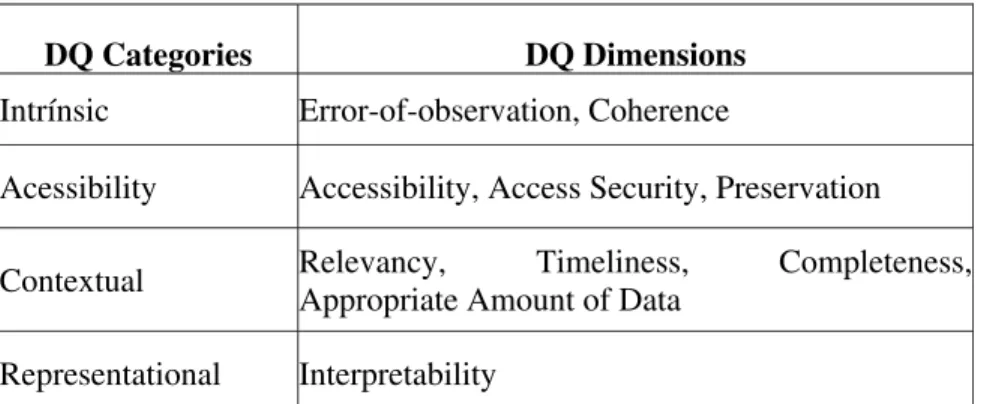
The observation data quality categories and dimensions of major civil engineering works are presented in Table 3.
DQ Categories DQ Dimensions
Intrínsic Error-of-observation, Coherence
Acessibility Accessibility, Access Security, Preservation
Contextual Relevancy, Timeliness, Completeness, Appropriate Amount of Data
Representational Interpretability
Table 3 - Observation data quality categories and dimensions of major civil engineering works
C
ONCLUSIONS
This work was aimed at identifying and defining the relevant quality dimensions of data on the safety monitoring of major civil engineering works.
Through a multi-method approach [30] ten dimensions were identified, defined and nine of them sorted by relevance to their users (except for the preservation dimension). These dimensions are: error-of-observation, coherence, relevancy, interpretability, timeliness, completeness, accessibility, appropriate amount of data, and access security. All of these dimensions were available in the literature, except for preservation.
Differently from other e-Science environments authors [16], we have not restricted our work to objective dimensions (eg error-of-observation), whose measures can be calculated automatically. It appears that some subjective dimensions (eg relevance, interpretability) can largely enrich the quality information about archived data.
These subjective dimensions will be measured through surveys of LNEC experts and in some cases, the representatives of works’ owners (eg. EDP), which are their providers and first users [13].
The analyzed domain addresses the issue of data quality in two areas still poorly explored and highly topical: data collected by sensors and e-Science environments.
We believe that this study’s results will be very useful in the characterization of data quality of civil works, at least those monitored by LNEC.
L
IMITATIONS
As in any Delphi study [26, 27], the participants in this study were not randomly selected. Nevertheless, they are some of the greatest national experts in concrete and embankment dams and bridges monitoring. Furthermore, the Delphi method characteristics lead to factors such as the respondents’ willingness and the understanding of all dimensions, which may have influenced the results.
F
UTURE
W
ORK
As part of this research project the following tasks will include:
1. Identification of assessment units for each dimension, pg. one observation, a pair observation device-reading device, a campaign (set of observations in a given moment in time in some civil work), a civil work or the information system that supports a set of civil works;
2. Although each dimension can be assessed subjectively and objectively [19], it is considered that, in the context of this work, this dual assessment is impracticable. So, the more “objective” dimensions will be evaluated objectively (pg error-of-observation, coherence, timeliness, completeness) and the more “subjective” ones (pg relevancy, interpretability, accessibility) subjectively. Nevertheless, it is understood that some dimensions may need a double assessment (pg access security);
3. Development or adaptation of mathematical models to quantify the objective dimensions, and surveys to quantify the subjective ones;
4. For some objective dimensions, for instance, error-of-observation, timeliness and completeness: development or adaptation of mathematical models for the propagation [1, 11] (also called composition [2]) (pg. aggregation, algebraic and database operations) of the quality indicators, from the collection of observations to the interpretation models. We are thinking about using IP-MAPs [25, 28, 29] to represent the quality propagation on the selected dimensions, using the
Quality Check Blocks for data quality evaluation and propagation within the information manufacturing system.
Under the current project, it was decided to opt for a utilitarian strategy and only improve the quality of the observation data, if the quality of the interpretation results so requires.
Another future research line is to replicate this study in different countries or geographical regions, as previously explained.
Acknowledgments
This work could not be accomplished without the participation of all experts who were available to respond to the Delphi questionnaires, to whom we are grateful for the valuable collaboration. Very special thanks go to Drs Antonio Silva Gomes, António Tavares de Castro, João Marcelino, João Pedro Santos and José Oliveira-Pedro for their availability for interviews, opinions exchange and for the final meeting. Last but not least we would like to thank Universidade do Minho that provided the software and hosting of our online Delphi questionnaire and our anonymous referees for their useful comments on the first version of this paper.
R
EFERENCES
[1] Ballou, D., Wang, R., Pazer, H. and Tayi, G. K. “Modeling Information Manufacturing Systems to Determine Information Product Quality”, Management Science, 44 (4). 1998. pp. 462-484.
[2] Batini, C. and Scannapieco, M. Data Quality: Concepts, Methodologies and Techniques. Springer-Verlag, 2006.
[3] Day, J. e Bobeva, M. “A Generic Toolkit for the Successful Management of Delphi Studies”, The Electronic Journal of Business Research Methodology, 3 (2). 2005. pp. 103-116, Retrieved December 15, 2008 from www.ejbrm.com
[4] Even, A. e Shankaranarayanan, G. “Understanding Impartial versus Utility-Driven Quality Assessments in Large Datasets”, International Conference on Information Quality (ICIQ 2007). 2007.
[6] Gottschalk, P., Christensen, B.H. e Watson, R. T. “Key Issues in Information Systems Management Surveys: Methodological Issues and Choices in a Norwegian Context”, Scandinavian Journal of Information Systems 9( 2). 1997. pp. 57-66.
[7] International Standards Organization, International Vocabulary of Metrology – Basic and general concepts and associated terms (VIM)(ISO/IEC 99:2007). 2008.
[8] Isaac, S. and Michael, W. B., Handbook in research and evaluation. EdITS Publishers. San Diego, CA, 1981. [9] Joint Committee for Guides in Metrology, Evaluation of Measurement Data – Guide to the Expression of
Uncertainty in Measurement (JCGM 100:2008). 2008. Retrieved August 24, 2009, from Bureau International des Poids et Mesures website: http://www.bipm.org/en/publications/guides/gum.html
[10] Klein, A., Do, H.-H., Hackenbroich, G. and Lehner, W. “Representing Data Quality for Streaming and Static Data”, IEEE 23rd International Conference on Data Engineering Workshop. 2007. pp. 3-10.
[11] Klein, A. “Incorporating quality aspects in sensor data streams”, First Ph.D. Workshop in CIKM, PIKM 2007, Sixteenth ACM Conference on Information and Knowledge Management, CIKM 2007. 2007. pp. 77-84. [12] Lee, Y. W., Pipino, L. L., Funk, J. D. and Wang, R. Y., Journey to Data Quality. The MIT Press, 2006. [13] Lee, Y. W., Strong, D. M., Kahn, B. K. and Wang, R. Y. “AIMQ: a methodology for information quality
assessment”, Information & Management 40. 2002. pp. 133–146.
[14] Linstone, H. A. “The Delphi technique”. In J. Fowlers (Ed.), Handbook of future research. Greenwood Press. Westport, CT., 1978. pp. 273-300
[15] Linstone, H. A., and Turoff, M. The Delphi method: Techniques and applications. Addison-Wesley Publishing Company. Reading, Massachusetts, 1975
[16] Martinez, A., Hammer, J. and Ranka, S. “BioDQ: Data Quality Estimation and Management for Genomics Databases”, Fourth International Symposium, ISBRA 2008. 2008. pp. 469-480.
[17] Missier, P., Preece, A., Embury, S., Jin, B., Greenwood, M., Stead, D. and Brown, A. “Managing Information Quality in e-Science: A Case Study in Proteomics”, ER (Workshops). 2005. pp. 423-432.
[18] Oliveira-Pedro, J. Observação de Obras. Laboratório Nacional de Engenharia Civil. Lisboa, 1999.
[19] Pipino, L. L., Lee, Y. W. and Wang, R. Y. “Data Quality Assessment” Communications of the ACM, 45(4ve). 2002. pp. 211 – 218.
[20] Preece, A., Jin, B., Pignotti, E., Missier, P., Embury, S., Stead, D. and Brown, A., “Managing Information Quality in e-Science using Semantic Web Technology”, Proc 3rd European Semantic Web Conference (ESWC 2006). 2006. Volume 4011, pp. 472-486.
[21] Redman, T. C. Data Quality for the Information Age. Artech House. 1996.
[22] Rowe, G. and Wright, G. “The Delphi technique as a forecasting tool: Issues and analysis.” International Journal of Forecasting, 15(4). 1999. pp. 353 – 375.
[23] Santos, L. D., Factores Determinantes do Sucesso de Adopção e Difusão de Serviços de Informação Online em Sistemas de Gestão de Ciência e Tecnologia, PHD thesis, Universidade do Minho. 2004.
[24] Scannapieco, M. and Catarci, T. “Data Quality under the Computer Science Perspective”, Journal of Archivi & Computer, 2. 2002.
[25] Scannapieco, M., Pernici, B. and Pierce, E. M. “IP-UML: A Methodology for Quality Improvement based on IP-MAP and UML”, in R. Y. Wang, E. M. Pierce, S. E. Madnick and C. W. Fisher (Eds), Advances in Management Information Systems, Vladimir Zwass Series Editor, 2005.
[26] Schmidt, R.C., “Managing Delphi Surveys Using Nonparametric Statistical Techniques”, Decision Sciences, 28 (3). 1997. pp. 763-774.
[27] Schmidt, R., Lyytinen, K., Keil, M. e Cule, P., “Identifying Software Project Risks: An International Delphi Study”, Journal of Management Information Systems, 17 (4). 2001. pp. 5-36.
[28] Shankaranarayan, G. and Wang, R. Y., “IPMAP: Current State and Perspectives”, Proc. 12th International Conference on Information Quality (IQ 2007). 2007.
[29] Shankaranarayan, G., Wang, R. Y. and Ziad, M.”Modeling the Manufacture of an Information Product with IP-MAP”, Proc. 5th International Conference on Information Quality (IQ 2000). 2000.
[30] Skulmoski, G. J., Hartman, F. T. and Krahn, J. ”The Delphi Method for Graduate Research”, Journal of Information Technology Education, 6. 2007. pp. 1-21. Retrieved May 18, 2009 from jite.org/documents/Vol6/JITEv6p001-021Skulmoski212.pdf
[31] Stephenson, W. The Study of Behavior: Q-technique and its Methodology. University of Chicago Press. Chicago, 1953.
[33] Wand, Y. e Wang, R. Y. “Anchoring Data Quality Dimensions in Ontological Foundations”, Communications of the ACM 39 (11).1996. pp. 86-95.
[34] Wang, R. W., Lee, Y. W., Pipino, L. L., Strong, D. M. “Manage Your Information as a Product”, Sloan Management Review, 39 (4 ).1998. pp. 95-105.
[35] Wang, R.Y. and Strong, D.M., “Beyond Accuracy: What Data Quality Means to Data Consumers”, Journal of Management Information Systems, 12 (4).1996. pp. 5-34.
[36] Wang, R.Y., “A Product Perspective on Total Data Quality Management”, Communications of the ACM, 41 (2). 1998. pp.58-65.
[37] Yount, R., Developing Scales. 2006. Retrieved May 20, 2009 from www.napce.org/articles/Research%20Design%20Yount/12_scales_4th.pdf