ISSN 0104-6632 Printed in Brazil
www.abeq.org.br/bjche
Vol. 29, No. 04, pp. 725 - 739, October - December, 2012
Brazilian Journal
of Chemical
Engineering
INVESTIGATION OF HYDRODYNAMIC
PARAMETERS IN A NOVEL EXPANDED BED
CONFIGURATION: LOCAL AXIAL DISPERSION
CHARACTERIZATION AND AN EMPIRICAL
CORRELATION STUDY
E. S. Taheri
1,2, M. Jahanshahi
1*, M. T. Hamed Mosavian
3and M. H. Shahavi
11
Nanotechnology Research Institute, Faculty of Chemical Engineering, Phone/Fax: + 98-111-3220342, Babol University of Technology,
Babol, P.O.Box: 484, Babol, Iran. *
E-mail: [email protected]; [email protected] 2
Chemical Engineering Department, Quchan Branch, Islamic Azad University, Iran. 3
Faculty of Chemical Engineering, Ferdowsi University of Mashhad, Mashhad, Iran.
(Submitted: December 30, 2011 ; Revised: March 27, 2012 ; Accepted: April, 6, 2012)
Abstract - Study of liquid behavior in an expanded bed adsorption (EBA) system is important for
understanding, modeling and predicting nanobioproduct/biomolecule adsorption performance in such processes. In this work, in order to analyze the local axial dispersion parameters, simple custom NBG (Nano Biotechnology Group) expanded bed columns with 10 and 26 mm inner diameter were modified by insertion of sampling holes. Based on this configuration, the particles and liquid can be withdrawn directly from various axial positions of the columns. Streamline DEAE particles were used as solid phase in this work. The effects of factors such as liquid velocity, viscosity, settled bed height and column diameter on the hydrodynamic parameters were investigated. Local bed voidages in different axial bed positions were measured by a direct procedure within the column with 26 mm diameter. Increasing trend of voidage with velocity at a certain position of the bed and with bed height at a certain degree of expansion was observed. Residence time distribution (RTD) analysis at various bed points showed approximately uniform hydrodynamic behavior in the column with 10 mm diameter while a decreasing trend of mixing/dispersion along the bed height at a certain degree of expansion was seen in the column with 26 mm diameter. Also lower mixing/dispersion occured in the smaller diameter column. Finally, a combination of two empirical correlations proposed by Richardson-Zaki and Tong-Sun was successfully employed for identification of the bed voidage at various bed heights (RSSE=99.9%). Among the empirical correlations presented in the literatures for variation of the axial dispersion coefficient, the Yun correlation gave good agreement with our experimental data (RSSE=87%) in this column.
Keywords: EBA chromatography; Local hydrodynamic behavior; Local bed voidage; Local axial liquid
dispersion; Empirical correlation.
INTRODUCTION
Expanded bed adsorption (EBA) is an innovative and special chromatography technique for the recovery, separation and purification of target nano/biomolecules directly from complex unclarified
Brazilian Journal of Chemical Engineering
procedures such as decreasing the time of operation and total production costs and increasing product quality and process yield (Pinotti et al., 2009; Ng et al., 2007; da Silva Padilha et al., 2009; Vennapusa et al., 2009; Tong et al., 2002). Analysis of adsorption performance is quite complex because of influential factors, namely fluid hydrodynamics, particle classification, and desired component transfer. It is very important and fundamental to understand the flow hydrodynamic characteristics and interpret the adsorption performance of nano/biomolecules in EBA systems (Moraes et al., 2009; Li et al., 2004). In expanded beds, the adsorbent particles that are employed have a wide size/density distribution. When equilibrium conditions occur, the forces acting on a single particle are in balance and each particle locates at its own axial position without upward and downward movement and particle mixing is weak. Therefore, particles are classified perfectly and variation of the mean particle size and local bed voidage along the bed height are established in an EBA column. This trend lead to inhomogeneous hydrodynamics and adsorption behavior along the bed, while a liquid-solid fluidized bed, particles have a narrow size distribution and each particle can locate at any positions of the bed and cause intensive particle and liquid mixing (Yun et al., 2004). A number of experimental and modeling studies have been performed to determine the variation of the axial distribution characteristics such as mean particle size/density, bed voidage, axial dispersion coefficient and dynamic capacity with bed height within an EBA system. Bruce and Chase (2001) employed in-bed liquid and particle sampling procedures to estimate the variation of liquid hydrodynamic behavior in an expanded bed system within a modified STREAMLINE column for Streamline SP and DEAE adsorbent particles. They found that a classification of the particles occurs and particles with larger size/higher density were located at the bottom regions and smaller size/lower density were near the top regions of the column. In addition, residence time distribution (RTD) analysis was used in different column zones to the determine bed voidage and Bodenstein number along the bed height. Their experimental results showed that the bed voidage and Bodenstein number increase with an increase of column height. On the other hand, axial mixing and dispersion are much lower in the top zones than in the bottom zones (Bruce and Chase, 2001). Yun et al. (2004) measured the mean particle size and bed voidage at different positions of a modified column with a direct method (in-bed sampling) for Streamline SP particles. They also
Investigation of Hydrodynamic Parameters in a Novel Expanded Bed Configuration: Local Axial Dispersion Characterization 727
EXPERIMENTAL
Materials
Streamline DEAE adsorbent was purchased from Amersham Bioscience (Uppsala, Sweden). The particle size distribution was in the range of 100-300 µm and the mean particle size was 200 µm; the particle density was approximately 1200 kg m-3. Acetone and glycerol were supplied by Merck Company.
Modified Column
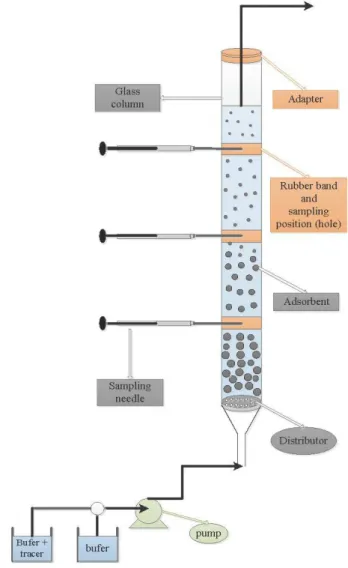
Two modified NBG expanded bed columns were used in the experiments. The first column was 10 mm and the second 26 mm in inner diameter and 30 cm in height. An ordinary custom built NBG column was equipped with a simple sintered glass distributor consisting of a 100 µm mesh. Columns were divided
into 9 zones by eight 2- 2.5 mm sampling holes located every 3 cm along the bed height. A net adapter was placed at the top of the columns and lowered to a position 0.5 ± 0.2 cm above the bed surface to minimize the dead volume of the system during the experiments. Sampling holes were sealed with moveable rubber bands before the experiments were carried out. Figure 1 shows a schematic of the modified NBG column and EBA system set- up. Needles that were used in the experiments were of two types. One was a metal needle with 1.5 mm inner diameter connected to a 1 mL graduated syringe. Samples containing liquid and adsorbent particles were simultaneously withdrawn from each sampling hole by this type of needle. Another type was a metal needle with an inner diameter less than 0.1 mm that withdrew only liquid from each sampling position. Selection of the needle depended on the type of experiment.
Brazilian Journal of Chemical Engineering
Measurements of RTD
The column was filled with the adsorbent particles. The bed was expanded with buffer until stable expansion was established in the system (about 30 min). RTDs in various positions along the bed height were performed by using a negative step signal method (Amersham Biosciences, 1998; Jahanshahi et al., 2002; Palsson et al., 2001). Dilute acetone (1% v/v) was used as the input to the column in the blank systems expanded with buffer alone and tracer concentrations in the bed effluent were measured spectrophotometrically at 280 nm. This procedure was repeated in each of the holes one by one. Experiments were repeated in triplicate at each point to ensure consistency. The experimental conditions are summarized in Table 1. RTD measurements at each position were used to estimate the Bodenstein numbers and axial dispersion coefficients in expanded bed operation. On the other hand, RTDs were studied to determine liquid mixing and dispersion within the column (Amersham Biosciences, 1998, Jahanshahi et al., 2002; Palsson et al., 2001; Levenspiel, 1972). These parameters were obtained by using equations 1 and 2 (Levenspiel,
1972; Najafpour, 2007; Jahanshai et al., 2003;
Biazus et al., 2006).
2
o 2
t B =2 N=2
δ (1)
1 axl
U
D H
2 N
=
ε (2)
where t and ² are the residence time and variance,2
Ul is the superficial liquid velocity, H is the bed
height, is the bed voidage, Bo is the Bodenstein
number, Daxl is the axial dispersion coefficient and N
is the number of theoretical plates.
Sampling of Local Bed Voidage
The column was filled with the adsorbent and expanded to a stable height for 45-60 min with the buffer. The sample needle was inserted into the column center through each selective hole for 30 min and then adsorbent particles and liquid (1 mL) were simultaneously withdrawn (in < 3 s) with a needle connected to a syringe. After the, sample was withdrawn and the needle taken out, the hole was sealed with rubber. The syringe was placed vertically (for about 2.5-3 h) until the particles were perfectly settled. The volumes of particles that settled in the syringe and of the liquid above particles were obtained. The voidage was determined from Eq. (3) (Yun et al., 2004).
o 1
i
o 1
0.4 V V
V V
+ ε =
+ (3)
where i is the local bed voidage in the ith layer of
the bed, Vo is the volume of particles in the sampling
syringe and Vl is the liquid volume above the
particles.
After these steps, samples were returned to the column and the bed was re-expanded for measurement of the voidage in other sampling positions. The experiment was performed at each of the sample ports along the bed one by one and repeated three times at each position. The experimental conditions are illustrated in Table 2.
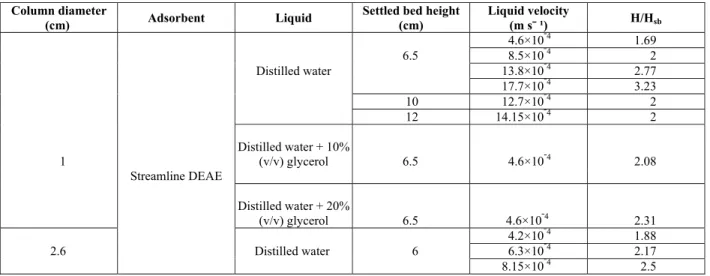
Table 1: Operating conditions in the RTD experiments
Column diameter
(cm) LiquidAdsorbent
Settled bed height (cm)
Liquid velocity
(m s¯ ¹) H/Hsb
1.694.6×10¯4
8.5×106.5 ¯4 2
Distilled water 2.7713.8×10¯4
3.2317.7×10¯4
12.7×10¹⁰ ¯4 2
14.15×10¹² ¯4 2
1
Distilled water + 10%
(v/v) glycerol 6.5 4.6×10¯4
2.08
Streamline DEAE
Distilled water + 20%
(v/v) glycerol 6.5 4.6×10¯4 2.31
1.884.2×10¯4
2.6
6 Distilled water 6.3×10 2.17¯4
Investigation of Hydrodynamic Parameters in a Novel Expanded Bed Configuration: Local Axial Dispersion Characterization 729
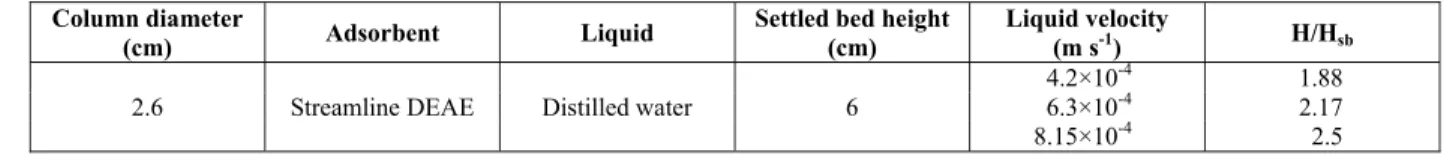
Table 2: Summary of experimental conditions for the bed voidage experiments
Column diameter
(cm) Adsorbent Liquid
Settled bed height (cm)
Liquid velocity
(m s-1) H/Hsb
4.2×10⁻⁴ 1.88
2.6 Streamline DEAE Distilled water 6 6.3×10⁻⁴ 2.17
8.15×10⁻⁴ 2.5
THEORY
Adsorbent Particle Size Distribution
Tong and Sun (2002) presented empirical correlation for the variation of the mean particle size along the bed height in an EBA system for streamline particles with a broad size distribution and relatively uniform density. Their correlation is expressed by Eq. (4) (Tong and Sun, 2002):
pi p
d h
1.21 0.46
d = − H (4)
where (h/H) is the ratio of sampling height to
expanded bed height and (dpi/dp) is the ratio of
measured mean diameter at different axial positions to the mean diameter of the streamline particles in the bulk. Kaczmarski and Bellot (2005) used this correlation (Eq. (4)) in their work to explain the mean particle diameter in each layer of bed. Also Tong et al. (2003) employed this empirical correlation for variation of mean particle size along the bed in order to model the protein adsorption by taking into account the axial particle size distribution in an EBA system. It was assumed that expanded bed conditions dominated in that system; therefore, equation 4 was employed to determine the mean particle diameter along the bed height.
Local Bed Voidage
Richardson and Zaki (1954) explained the correlation between superficial velocity and bed expansion. This correlation has been widely applied in liquid-solid fluidized beds and EBA systems in numerous empirical and semi-empirical studies of average bed expansion. Al-Dibouni and Garside (1979) and Yun et al. (2004) employed this correlation to measure local bed voidage along the bed height in their classified fluidized bed model. Their correlation is expressed as Eq. (5):
n 1
i ti
U
U = ε (5)
where Uti is the particle terminal velocity of the ith
layer and n is the bed expansion index (Richarson- Zaki correlation exponent) that can be determined by Eq. (6) (Anspach et al., 1999; Fenneteau et al., 2003; Jahanshahi et al., 2009):
0.67
5.1 n
0.016Ga
n−− =2.4 (6)
where Ga is the Galileo number obtained from Eq. (7):
3
pi pi
2
d g ( )
Ga= ρ ρ −ρ
μ (7)
where dpi is the particle mean diameter in the ith
layer, ρ is the liquid density, µ is the liquid viscosity,
ρpi is the particle mean density in the ith layer that is
relatively uniform along the bed height for streamline particles. Particle terminal velocity can be estimated from Eq. (8):
2 pi pi ti
d g ( )
U
18
ρ −ρ =
μ (8)
In this work, we used the Richardson-Zaki correlation to investigate local bed voidage at each different position of the bed. The Tong-Sun correlation, Eq. (4), was employed instead of the mean particle size at each position of the bed in these correlations (Eq. (7) and (8)). This method (coupling of two empirical correlations, Richardson-Zaki and Tong-Sun) is discussed for the first time and the results compared with experimental data in the modified NBG column.
Local Axial Dispersion Coefficient
Brazilian Journal of Chemical Engineering
particle-particle interactions and the near-wall non-uniform velocity profile to obtain Eq. (9):
0.65 0.5 axi
pi i ri
D
13.2 (Re ) −
ρ = ε β
μ (9)
where Daxi is the axial dispersion coefficient at each
position of the bed, ρ and µ are liquid properties, βri
is the relative energy dissipation rate in the ith layer, defined as:
(
)
(
)
ri 2 c pi 1 1 i i 32 d 1 U g 32U β =ρ −ρ − ε ε + μ
(10)
where dc is the column inner diameter and Repi is the
particle Reynolds number in the ith zone, expressed as:
pi pi
1
d
Re = U ρ
μ (11)
We used the Yun et al. equation (Eq. (9)) here in order to compare the experimental data and correlate the value of the axial dispersion coefficient. Instead of local bed voidage and mean particle size in each layer, the correlations of Richardson-Zaki and Tong-Sun were utilized. Chung and Wen (1968) and Kikuchi et al. (1984) presented empirical correlations to explain overall flow hydrodynamic behavior in the liquid-solid fluidized bed. Yun et al. (2005) used these correlations for an EBA system to study the flow behavior in each point of bed. We also employed these correlations to determine the variation of the axial dispersion coefficient with bed height in an EBA system and compared experimental data in the customized NBG column with the correlated data.
The Chung-Wen correlation is given by Eq. (12):
pi pi axi mfi 0.48 pi Re D Re
Re 0.2 (0.11 Re )
⎛ ⎞
ρ⎜ ⎟=
⎜ ⎟
μ ⎝ ⎠ + (12)
where Remfi is the onset Reynolds number in the ith
zone, expressed by:
2
mfi i
Re = 33.7 +0.408 Ga −33.7 (13)
The correlation of Kikuchi et al. (1984) is defined by Eq. (14):
0.43 2
axi
oi i
D
500 exp[ 20.5(0.75 ) ]
ρ = β − − ε
μ (14)
where βoi is the energy dissipation rate per unit mass
of liquid in the ith zone.
RESULTS AND DISCUSSIONS
Column with 26 mm Diameter
Local Bed Voidage
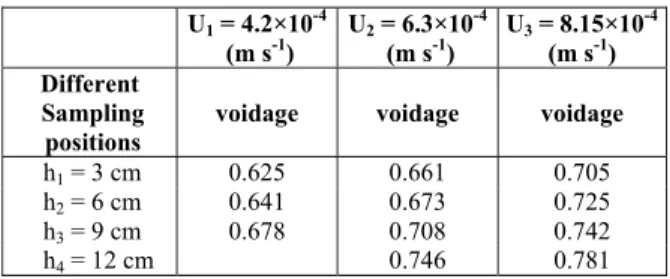
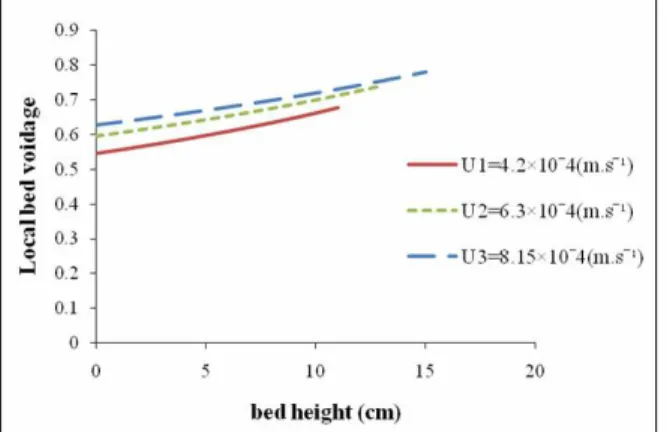
Table 3 shows the axial bed voidage at different column heights under various liquid flow velocities. Experimental results indicate that at a certain degree of expansion, the local bed voidage increases along the bed height. An increasing trend of voidage with the increase of flow velocity at a certain position can also be seen from Table 3. The trends in this simple column are similar to those reported in the literature (Yun et al., 2004; Bruce and Chase, 2001; Willoughby et al., 2000). The agreement between the local bed voidage values measured experimentally herein and those predicted by combining the Tong-Sun and Richardson- Zaki correlations is shown in Figures 2, 3 (a)-(c). In addition, the relative sum of squares of errors (RSSE) was calculated and the results shown in Table 4.
Table 3: Experimental voidage variation at different column heights in the bed of streamline DEAE at various liquid superficial velocities (6 cm settled bed height; 2.6 cm column diameter)
U1 = 4.2×10⁻⁴ (m s-1)
U2 = 6.3×10⁻⁴ (m s-1)
U3 = 8.15×10⁻⁴ (m s-1) Different
Sampling positions
voidage voidage voidage
h1 = 3 cm 0.625 0.661 0.705 h2 = 6 cm 0.641 0.673 0.725 h3 = 9 cm 0.678 0.708 0.742
Investigation of Hydrodynamic Parameters in a Novel Expanded Bed Configuration: Local Axial Dispersion Characterization 731
Figure 2: Predicted axial voidage by the Richardson-Zaki and Tong-Sun correlations at different bed heights under various liquid superficial velocities (streamline DEAE; 6 cm settled bed height; 2.6 cm column diameter).
(a) (b)
(c)
Figure 3 (a)-(c): Comparison of predicted axial voidage with experimental results at different bed heights under various liquid superficial velocities (streamline DEAE 6 cm settled bed height; 2.6 cm column diameter)
Table 4: RSSE for local bed voidage at different flow velocities
Flow velocity U1 = 4.2×10 -4 (m s-1)
U2 = 6.3×10⁻⁴ (m s-1)
U3 = 8.15×10⁻⁴ (m s-1)
Brazilian Journal of Chemical Engineering
The RSSE is described by Eq. (15) (Wright and Glasser, 2001):
n 2 2
i i i
2 i i 1
1 e (e )
RSSE
m e
p
=
− −
=
∑
(15)where ei and pi are the experimental and predicted
values and m is the number of data points, a value of 100% for the RSSE corresponds to perfect agreement.
As shown in Figures 2 and 3 and Table 4, the variation of the voidage with bed height is linear. Excellent agreement between predicted and experi-mental data was observed in most of regions of the bed. Of course there is some deviation between predicted and experimental data in the bottom zones due to the fact that, in this work, we assumed that ideal expanded bed conditions are dominant and particle mixing is low, while the bottom regions of the bed have severe mixing. Therefore, this effect should not be ignored in this region. Another assumption herein was that particles have uniform density. Particle density may only be approximately uniform, which probably lead to slight deviations of the mean particle size from the Tong-Sun correlation. In addition, another reason for these deviations might be the type of sampling procedure
used for voidage determination. The present
correlations for bed voidage are suitable (Table 4 and Figure 3); therefore, we employed them to determine the correlated local axial dispersion coefficient in the next section.
Local Axial Dispersion Coefficient
Experimental values for the Bodenstein number and axial dispersion coefficient at different positions of the bed are shown at Tables 5 and 6. As can be seen from the tables, for a stable condition, mixing and axial dispersion vary at different positions of the bed and decrease with increasing bed height. These results are similar to data reported in the literature (Bruce and Chase, 2001; Yun et al., 2005). Numerous reasons exist for these non-uniform flow behaviors and some of them are discussed herein. A number of factors such as liquid phase properties (velocity, viscosity, etc), solid phase properties (size/density distribution, porosity, etc), bed voidage, and column design (diameter, distributor, settled bed height, etc) affect on flow behavior in an EBA system. According to our results (Table 3 and Figure 3) and other studies, the local bed voidage changes along the bed height. Since the bed voidage is low in the bottom region and particle concentrations are high, interactions
between particles are intense and unwanted falling and rising of particles occurs, which result in higher liquid back mixing and dispersion in this region. In contrast, voidage in the middle and top zones of the column increases and the interstitial velocity then decreases with the bed height and mixing and dispersion becomeweaker in these regions. Another important reason for such behavior is column design. The distributor located at the end of column disperses liquid with a non-uniform flow profile. With increasing distance from the column distributor, this effect become lower and uniform velocity profiles are obtained near the column top zones. Therefore, there is a decreasing trend of local mixing and dispersion with bed height.
Table 5: Axial mixing (Bodenstein number) at different column heights in the bed of streamline DEAE under different liquid superficial velocities (6 cm settled bed height; 2.6 cm column diameter)
U1 = 4.2×10⁻⁴ (m s-1)
U2 = 6.3×10⁻⁴ (m s-1)
U3 = 8.15×10⁻⁴ (m s-1) Different
Sampling positions
Bo Bo Bo
h1 = 3 cm 4.43 3.78 3.71 h2 = 6 cm 7.2 5.93 4.42 h3 = 9 cm 9.5 7.31 6.24 h4 = 12 cm 11.41 9.22 6.7
h5 = 15 cm 10.87
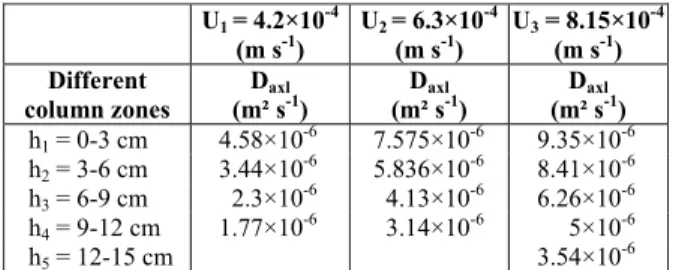
Table 6: Variation of the local effective axial dispersion coefficient in different column zones at different liquid superficial velocities (streamline DEAE particles; 6 cm settled bed height; 2.6 cm column diameter)
U1 = 4.2×10⁻⁴ (m s-1)
U2 = 6.3×10⁻⁴ (m s-1)
U3 = 8.15×10⁻⁴ (m s-1) Different
column zones
Daxl (m² s-1)
Daxl (m² s-1)
Daxl (m² s-1)
h1 = 0-3 cm 4.58×10⁻⁶ 7.575×10⁻⁶ 9.35×10⁻⁶ h2 = 3-6 cm 3.44×10⁻⁶ 5.836×10⁻⁶ 8.41×10⁻⁶ h3 = 6-9 cm 2.3×10⁻⁶ 4.13×10⁻⁶ 6.26×10⁻⁶ h4 = 9-12 cm 1.77×10⁻⁶ 3.14×10⁻⁶ 5×10⁻⁶
h5 = 12-15 cm 3.54×10⁻⁶
Investigation of Hydrodynamic Parameters in a Novel Expanded Bed Configuration: Local Axial Dispersion Characterization 733
axial dispersion coefficient increases. However, at very high flow velocities, axial dispersion variation along the bed height may not be observed. This is due to the fact that, at very high flow velocity. convection is severe and particle movements that lead to higher mixing and dispersion increase in all of the bed zones.
In this work, we considered three empirical equations to determine variations of the local axial dispersion coefficient along the bed height (Eqs. (9), (12) and (14)). Then experimental data obtained in the modified NBG column were compared with these correlations (Figures 4, 5 and Table 7). Both the correlations of Chung-Wen and Kikuchi et al. show (Figure 4 (b)-(c)) an increasing trend of the local axial dispersion coefficient along the bed height, while our experimental studies show the inverse trend. In addition, there is not agreement between our experimental and correlated data. Therefore, these correlations are not valid for the local axial dispersion coefficient at each position of the bed in the EBA system used in this work. On the other hand, they are suitable for estimation of the
overall dispersion in these systems. Figures 4 (a), 5 and Table 7 make a comparison of the local axial dispersion coefficients measured experimentally and calculated by the Yun equation. The decreasing trend of the axial dispersion coefficient with the increase in bed height at a certain velocity and the decrease of velocity at a certain bed position, similar to our experimental results, can be seen in Figure 4 (a). However, Figure 5 and Table 7, which compare the local axial dispersion coefficients in each zone of bed show a discrepancy between experiment and the correlated values in the zones near of distributor. This irregularity was expected in the bottom bed zones, as described before. With increasing distance from the distributor, this agreement becomes much better and the correlation gives excellent predictions. In addition, an increase of velocity leads to a RSSE decrease. Therefore, this correlation (Eq. (9)) predicts our experimental results for the local axial dispersion coefficient at different bed points better than other correlations (Eqs. (12) and (14)) and can describe local hydrodynamic flow behavior well within the EBA system.
(a) (b)
(c)
Brazilian Journal of Chemical Engineering
(a) (b)
(c)
Figure 5 (a)-(c): Comparison of predicted axial dispersion coefficients obtained by the Yun equation with experimental results in different bed zones at various liquid superficial velocities (1: zone between 0-3 cm, 2: zone between 3-6 cm, 3: zone between 6-9 cm, 4: zone between 9-12 cm, 5: zone between 12-15 cm)
Table 7: RSSE for the local axial dispersion coefficient at different flow velocities
Flow velocity U1 = 4.2×10 -4 (m s-1)
U2 = 6.3×10⁻⁴ (m s-1)
U3 = 8.15×10⁻⁴ (m s-1)
RSSE (%) 87 85.85 77.2
Column with l0 mm Diameter
In order to study the influence of column diameter on fluid local hydrodynamic behavior, another modified NBG column with a smaller diameter (10 mm) was prepared in this research. Therefore, the effect of different parameters such as flow velocity, liquid viscosity, and settled bed height on local hydrodynamic performance within the column with l0 mm in diameter were also examined and discussed.
Influence of Flow Velocity on Fluid Hydrodynamics
Tables 8 and 9 illustrate Bodenstein numbers and local effective axial dispersion coefficients at
Investigation of Hydrodynamic Parameters in a Novel Expanded Bed Configuration: Local Axial Dispersion Characterization 735
Table 8: Axial mixing (Bodenstein number) at different column heights in the bed of streamline DEAE at different liquid superficial velocities (settled bed height = 6.5cm; 1 cm column diameter)
U1 = 4.6×10⁻⁴ (m s-1)
U2 = 8.5×10⁻⁴ (m s-1)
U3 = 13.8×10⁻⁴ (m s-1)
U4 = 17.7×10⁻⁴ (m s-1) Different sampling
positions Bo Bo Bo Bo
h1 = 3 cm
4.5 5.576 5.3
h2 = 6 cm
12.2 17.28 9.88 8
h3 = 9 cm
11.92 17.1 9.95 8
h4 = 12 cm
12.22 16.79 10.7 7.61
h5 = 15 cm 7.919.8
h6 = 18 cm 7.29.68
h7 = 21 cm 8
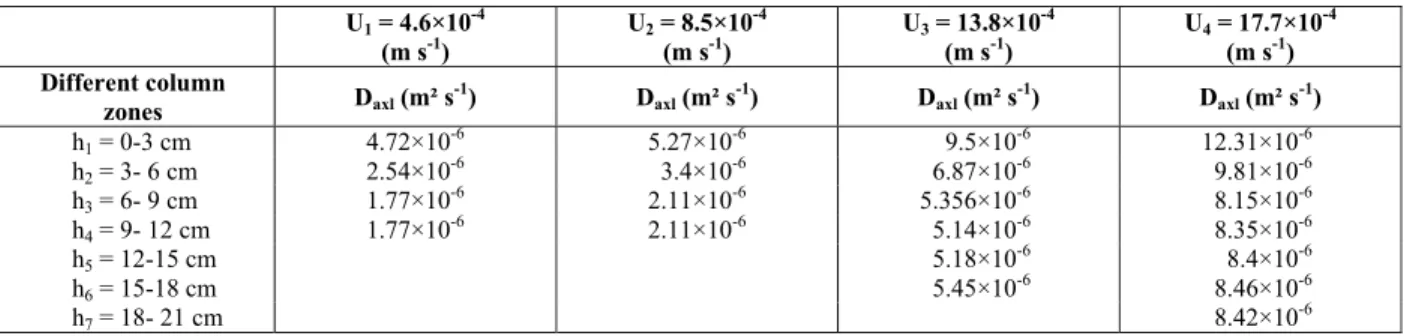
Table 9: Variation of the local effective axial dispersion coefficient in different column zones at different liquid superficial velocities (streamline DEAE particles; 6.5 cm settled bed height; 1cm column diameter)
U1 = 4.6×10⁻⁴ (m s-1)
U2 = 8.5×10⁻⁴ (m s-1)
U3 = 13.8×10⁻⁴ (m s-1)
U4 = 17.7×10⁻⁴ (m s-1) Different column
zones Daxl (m² s-1) Daxl (m² s-1) Daxl (m² s-1) Daxl (m² s-1)
h1 = 0-3 cm
4.72×10 5.27×10⁻⁶ 9.5×10⁻⁶ 12.31×10⁻⁶ -6
h2 = 3- 6 cm
2.54×10⁻⁶ 6.87×10 3.4×10⁻⁶ 9.81×10⁻⁶ -6
h3 = 6- 9 cm
1.77×10 2.11×10⁻⁶ 5.356×10⁻⁶ 8.15×10⁻⁶ -6
h4 = 9- 12 cm
1.77×10 2.11×10⁻⁶ 5.14×10⁻⁶ 8.35×10⁻⁶ -6
h5 = 12-15 cm
8.4×105.18×10-6 -6
h6 = 15-18 cm
8.46×105.45×10-6 -6
h7 = 18- 21 cm 8.42×10⁻⁶
Because of the uniform behavior, the overall bed voidage correlation, Eq. (16) (Li and Chase, 2009; Levenspiel, 1999), was used to calculate the axial dispersion coefficient in this column.
sb o
H
1 (1 )
H
⎛ ⎞
ε = − − ε ⎜⎝ ⎟⎠ (16)
where Hsb is the settled bed height, H is the bed
height, o is the voidage in the fixed bed condition
(settled bed voidage), assumed to be 0.4.
Influence of Liquid Viscosity on Fluid Hydrodynamics
The results of studies of the effect of flow viscosity on liquid behavior are displayed in Tables 10
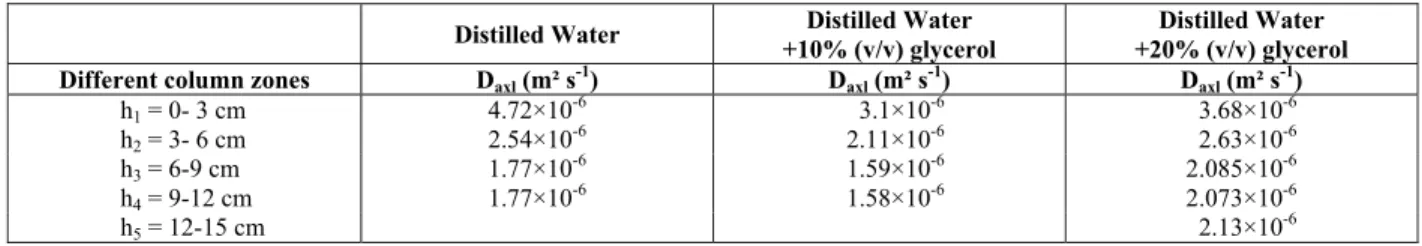
and 11. These tables show that mixing and dispersion decrease with increasing viscosity, altered by addition of 10% (v/v) glycerol to the buffer. This is due to the fact that the degree of bed expansion increases with the increase of liquid viscosity under constant velocity. Therefore, at a certain position, decreasing solid particle interaction and increasing bed voidage are expected. However, with an increase of liquid density or viscosity, convection become calmer, resulting in better liquid behavior. In contrast, an increase of viscosity by addition of 20% (v/v) glycerol to the buffer led to worse liquid behavior. Reduction of the discrepancy between the liquid and solid particle density might result in intense mixing and dispersion. In addition, except in the distributor region, the flow hydrodynamics is approximately uniform in this column at various viscosities, as expected.
Table 10: Axial mixing (Bodenstein number) at different column heights in the bed of streamline DEAE particles at different liquid viscosities (liquid flow velocity is 4.6×10⁻⁴ m s-1; 6.5 cm settled bed height; 1 cm column diameter)
WaterDistilled DistilledWater
+10% (v/v) glycerol Distilled Water
Different sampling positions Bo Bo Bo
h1 = 3 cm
4.5 8.2 5.175
h2 = 6 cm
12.2 12.36 9.34
h3 = 9 cm
11.92 12.6 8.93
h4 = 12 cm
12.22 12.5 9.45
Brazilian Journal of Chemical Engineering
Table 11: Variation of the local effective axial dispersion coefficient in different column zones at different liquid viscosities (streamline DEAE particles; liquid flow velocity is 4.6×10¯4 (m s¯¹); 6.5cm settled bed height; 1 cm column diameter)
Distilled Water Distilled Water
+10% (v/v) glycerol
Distilled Water +20% (v/v) glycerol Different column zones Daxl (m² s-1) Daxl (m² s-1) Daxl (m² s-1)
h1 = 0- 3 cm
4.72×10 3.1×10⁻⁶ 3.68×10⁻⁶ -6
h2 = 3- 6 cm
2.54×10 2.11×10⁻⁶ 2.63×10⁻⁶ -6
h3 = 6-9 cm
1.77×10 1.59×10⁻⁶ 2.085×10⁻⁶ -6
h4 = 9-12 cm
1.77×10 1.58×10⁻⁶ 2.073×10⁻⁶ -6
h5 = 12-15 cm 2.13×10⁻⁶
Influence of Settled Bed Height on Fluid Hydrodynamics
The results are shown in Tables 12 and 13. As can be seen, except in the bottom zones, the flow behaves approximately uniformly in the middle and top region. Therefore, column diameter is one of the important influential parameters on flow hydrody-namic performance. Our results show that flow behaves nearly uniformly within the smaller diameter column (10 mm) and, with the increase of diameter, this behavior becomes non-uniform and inhomoge-neous. Thus, the liquid behavior changes along the bed in column with the larger diameter (26 mm).
Table 12: Axial mixing (Bodenstein number) at different column heights in the bed of streamline DEAE particles at different settled bed heights (streamline DEAE particles; 1 cm column diameter; 0.7 bed voidage)
Hsb = 10 cm Hsb = 12 cm Different sampling
positions Bo Bo
h1 = 6 cm 12.3 14.6
h2 = 12 cm 17.9 18.3
h3 = 18 cm 18.2 19.4
h4 = 21 cm 19.1 18.8
h5 = 24 cm 20.2
Table 13: Variation of the local effective axial dispersion coefficient in different column zones at different settled bed heights (streamline DEAE particles; 1 cm column diameter; 0.7 bed voidage)
Hsb = 10 cm Hsb = 12 cm Different column
zones Daxl (m² s-1) Daxl (m² s-1)
h1 = 0-6 cm 8.87×10⁻⁶ 8.31×10⁻⁶ h2 = 6-12 cm 7.23×10⁻⁶ 7.37×10⁻⁶ h3 = 12-18 cm 6.045×10⁻⁶ 6.43×10⁻⁶ h4 = 18-21 cm 5.9×10⁻⁶ 6.35×10⁻⁶ h5 = 21-24 cm 6.21×10⁻⁶
Another result here is the fluid hydrodynamic performance enhancement in the column with 10 mm diameter. Mixing and dispersion in the column with 10 mm diameter is lower than in the column with 26 mm diameter.
Of course, these studies have been done on clean feedstock. Therefore, for real nano/biological feed-stock, more studies and research should be performed.
CONCLUSION
Investigation of Hydrodynamic Parameters in a Novel Expanded Bed Configuration: Local Axial Dispersion Characterization 737
together to determined the local bed voidage. Calculated data gave quite good agreement with experimental data (RSSE = 99.9%) under the operating conditions of the experiment; hence, the direct procedure is good enough to estimate bed voidage at each point of the bed in the column. Three empirical correlations were extracted from the literature to identify the local axial dispersion coefficient variation. Among them, the Yun equation explained this parameter better than the other correlations and reasonable agreement existed between experimental and correlated values (RSSE = 87%). The local axial dispersion coefficients obtained under our operation condition were between 10-6 and 10-5 (m² s-1) (most of them are about 10-6 m² s-1). These results indicated that stable expansion conditions occurred in our modified NBG column and the flow behavior was of the plug nature (Levenspiel, 1972). Therefore, fluid hydrodynamic performance in this column is good enough for recovery and purification of nano/bioproducts. This flow hydrodynamic study was performed for liquid without crude feedstock. Therefore, determination of real feedstock hydrodynamics within an EBA system, development of empirical correlations and mathematical hydrodynamic models for axial dispersion coefficient variation along the bed height with and without nano/biological feedstock, and presentation of mathematical model for nano/ bioproducts adsorption performance and purification of nano/bioproducts in a NBG chromatography column will be subjects of our further publications.
ACKNOWLEGEMENTS
The authors would like to gratefully acknowledge members of the Nanotechnology Research Institute of Babol University of Technology, Babol, Iran.
NOMENCLATURE
Bo Bodenstein number
Daxl Axial dispersion coefficient m² s¯¹
Daxli Axial dispersion coefficient
at ith layer of the bed
m² s¯¹
dpi Mean particle diameter at ith
layer of the bed
m
dp Mean particle diameter m
dc Column inner diameter m
ei Experimental data
Ga Galileo number
H Total bed height m
h Axial bed height m
Hsb Settled bed height m
m Number of data points
N Number of theoretical plates
n Richardson- Zaki correlation
exponent
pi Simulated data
Repi Particle Reynolds number in
the ith layer
Remfi Onset Reynolds number in
the ith layer
RSSE Relative sum of squares of
errors
t Average residence time s
Ul Superficial liquid velocity m s¯¹
Uti Terminal velocity at the ith
layer of the bed
m s¯¹
Vo Volume of settled particles
in the sampling syringe
m³
Vl Liquid volume above the
particles in the syringe
m³
Greek Letters
βri Relative energy dissipation
rate in the ith layer
m² s¯³
βoi Energy dissipation rate per
unit mass of liquid in the ith layer
m² s¯³
Total bed voidage
i Local bed voidage in the ith
layer of the bed
o Settled bed voidage
μ Liquid viscosity Pa s
ρ Liquid density kg m¯³
ρpi Particles mean density in the
ith layer
kg m¯³
2
Variance s2
REFERENCES
Al-Dibouni, M. R. and Garside, J., Particle mixing and classification in liquid fluidized beds. Trans. Inst. Chem. Eng., 57, 94-103 (1979).
Amersham Biosciences: Expanded Bed Adsorption – Principles and Methods, Pharma Biotech, Uppsala, Sweden (l998).
Anspach, F. B., Curbelo, D., Hartman, R., Garke, G. and Deckwer, W. D., Expanded-bed chromato-graphy in primary protein purification. J. Chromatogr. A, 865, 129-144 (1999).
Brazilian Journal of Chemical Engineering
amylases recovery from maize malt by ion- exchange expanded bed chromatography. Process. Biochem., 41, 1786-1791 (2006).
Bruce, L. J. and Chase, H. A., Hydrodynamics and adsorption behavior within an expanded bed adsorption column studied using in-bed sampling. Chem. Eng. Sci., 56, 3149-3162 (2001).
Chung, S. F. and Wen, C. Y., Longitudinal dispersion of liquid flowing through fixed and fluidized beds. AIChE. J., 14, 857-866 (1968). da Silva Padilha, G., Curvelo-Santana, J. C., Alegre,
R. M. and Tambourgi, E. B., Expanded bed adsorption of an alkaline lipase from Pseudomona cepacia. J. Chromatogr. B, 877, 521-526 (2009). Ebrahimpour, M., Jahanshahi, M. and Hosenian, A.
H., Adsorption strategy of plasmid DNA nanoparticulate: Preparative purification by a simple custom expanded bed column. Chromato-graphia, 72, 383-391 (2010).
Fenneteau, F., Aomari, H., Chahal, P. and Legros, R., Modeling of scale-down effects on the hydrodynamics of expanded bed adsorption columns. Biotechnol. Bioeng., 81, 790-799 (2003). Jahanshahi, M. and Ebrahimpour, M., Expanded bed chromatography as a tool for nanoparticulate separation: Kinetic study and adsorption of protein nanoparticles. Chromatographia, 70, 1553- 1560 (2009).
Jahanshahi, M., Najafpour, G., Ebrahimpour, M., Hajizadeh, S. and Shahavi, M. H., Evaluation of hydrodynamic parameters of fluidized bed adsorption on purification of nano bioproducts. Phys. Status. Solidi. C, 6, (10), 2199-2206 (2009). Jahanshai, M., Pacek, A. W., Nienow, A. W. and
Lyddiatt, A., Fabrication by three-phase emulsification of pellicular adsorbents customised for liquid fluidised bed adsorption of bioproducts. J. Chem. Technol. Biotechnol., 78, 1111-1120 (2003).
Jahanshahi, M., Sun, Y., Santos, E., Pacek, A., Franco, T. T., Nienow, A. and Lyddiatt, A., Operational intensification by direct product sequestration from cell disruptates: Application of a pellicular adsorbent in a mechanically integrated disruption-fluidized bed adsorption process. Biotechnol. Bioeng., 80, 201-212 (2002).
Kaczmarski, K. and Bellot, J. C., Influence of particle diameter distribution on protein recovery in the expanded bed adsorption process. J. Chromatogr. A, 1069, 91-97 (2005).
Kikuchi, K. I., Konno, H., Kakutani, S., Sugawara, T. and Ohashi, H., Axial dispersion of liquid in liquid fluidized beds in the low Reynolds number region. J. Chem. Eng. Jpn, 17, 362-367 (1984).
Levenspiel, O., Chemical Reaction Engineering. 3rd Ed. John Wiley & Sons, New York (1999). Levenspiel, O., Chemical Reaction Engineering.
John Wiley & Sons, New York (l972).
Li, J. and Chase, H. A., Characterization and evaluation of a macroporous adsorbent for possible use in the expanded bed adsorption of flavonoids from Ginkgo biloba L. J. Chromatogr. A., 1216, 8730-8740 (2009).
Li, P., Xiu, G. and Rodrigues, A. E., A3-zone model for protein adsorption kinetics in expanded beds. Chem. Eng. Sci., 59, 3837-3847 (2004).
Moraes, C. C., Mazutti, M. A., Rodrigues, M. I., Filho, F. M. and Kalil, S. J., Mathematical modeling and simulation of inulinase adsorption in expanded bed column. J. Chromatogr. A, 1216, 4395-4401 (2009).
Najafpour, G. D., Biochemical Engineering and Biotechnology. Chapter 17, Elsevier, Amsterdam (2007).
Ng, M. Y. T., Tan, W. S., Abdullah, N., Ling, T. C. and Tey, B. T., Direct purification of recombinant hepatitis B core antigen from two different pre-conditioned unclarified Escherichia coli feed-stocks via expanded bed adsorption chromato-graphy. J. Chromatogr. A, 1172, 47-56 (2007). Palsson, E., Axelsson, A. and Larsson, P. O.,
Theories of chromatographic efficiency applied to expanded beds. J. Chromatogr. A, 912, 235-248 (2001).
Pinotti, L. M., Fonseca, L. P., Prazeres, D. M. F., Rodrigues, D. S., Nucci, E. R. and Giordano, R. L. C., Recovery and partial purification of penicillin G acylase from E. coli homogenate and B. megaterium culture medium using an expanded bed adsorption column. Biochem. Eng. J., 44, 111-118 (2009). Richardson, J. F. and Zaki, W. N., Sedimentation
and fluidization: Part I. Trans. Inst. Chem. Eng., 32, 35-53 (1954).
Shahavi, M. H., Najafpour, G. D. and Jahanshahi, M., Hydrodynamic behaviour and biochemical characterization of a simple custom expanded bed column for protein purification. Afr. J. Biotechnol., 7, (23), 4336-4344 (2008).
Tong, X. D. and Sun, Y., Particle size and density distributions of two dense matrices in an expended bed system. J. Chromatogr. A, 977, 173-183 (2002).
Tong, X. D., Dong, X. Y. and Sun, Y., Lysozyme adsorption and purification by expanded bed chromatography with a small-sized dense adsorbent. Biochem. Eng. J., 12, 117-124 (2002). Tong, X. D., Xue, B. and Sun, Y., Modeling of
Investigation of Hydrodynamic Parameters in a Novel Expanded Bed Configuration: Local Axial Dispersion Characterization 739
account the axial particle size distribution. Biochem. Eng. J., 16, 265-272 (2003).
Vennapusa, R. R., Tari, C., Cabrera, R. and Fernandez-Lahore, M., Surface energetics to assess biomass attachment onto hydrophobic interaction adsorbents in expanded beds. Biochem. Eng. J., 43, 16-26 (2009).
Willoughby, N. A., Hjorth, R. and Titchener-Hooker, N. J., Experimental measurement of particle size distribution and voidage in an expanded bed adsorption system. Biotechnol. Bioeng., 69, 648-653 (2000).
Wright, P. R. and Glasser, B. J., Modeling mass transfer and hydrodynamics in fluidized-bed adsorption of proteins. AIChE J., 47, 474-488 (2001).
Yun, J., Yao, S. J. and Lin, D. Q, Variation of the local effective axial dispersion coefficient with bed height in expanded beds. Chem. Eng. J., 109, 123-131 (2005).