_______________________________
1 Ms., Engenharia Agrícola, Bolsista - CAPES, Doutoranda do PGEAGRI, UNIOESTE, Cascavel- PR, wrublack@hotmail.com. 2 Dr. Engenharia Agrícola, Pesquisador de Produtividade CNPq, Prof. Adjunto do PGEAGRI, UNIOESTE, Cascavel- PR,
erivelto.mercante@unioeste.br.
3 Dr. Agronomia, Pesquisador de Produtividade CNPq, Prof. Associado do PGEAGRI, UNIOESTE, Cascavel- PR,
marcio.vilaboas@unioeste.br.
Recebido pelo Conselho Editorial em: 2-8-2012 Aprovado pelo Conselho Editorial em: 24-4-2013
QUALITY IN THE CITY OF SALTO DO LONTRA-PARANÁ, BRAZIL
SUZANA C. WRUBLACK1, ERIVELTO MERCANTE2, MARCIO A. VILAS BOAS3
ABSTRACT: The objective of this study consisted on mapping the use and soil occupation and evaluation of the quality of irrigation water used in Salto do Lontra, in the state of Paraná, Brazil. Images of the satellite SPOT-5 were used to perform the supervised classification of the Maximum Likelihood algorithm - MAXVER, and the water quality parameters analyzed were pH, EC, HCO3-, Cl-, PO43-, NO3-, turbidity, temperature and thermotolerant coliforms in two distinct rainfall periods.
The water quality data were subjected to statistical analysis by the techniques of PCA and FA, to identify the most relevant variables in assessing the quality of irrigation water. The characterization of soil use and occupation by the classifier MAXVER allowed the identification of the following classes: crops, bare soil/stubble, forests and urban area. The PCA technique applied to irrigation water quality data explained 53.27% of the variation in water quality among the sampled points. Nitrate, thermotolerant coliforms, temperature, electrical conductivity and bicarbonate were the parameters that best explained the spatial variation of water quality.
KEYWORDS: Global Navigation Satellite Systems - GNSS, Geographic Information Systems - GIS, irrigation.
MAPEAMENTO DE USO E OCUPAÇÃO DO SOLO E QUALIDADE DA ÁGUA DE IRRIGAÇÃO NO MUNICÍPIO DE SALTO DO LONTRA-PARANÁ
RESUMO: Os objetivos do trabalho consistiram no mapeamento do uso e ocupação do solo e na avaliação da qualidade da água utilizada para irrigação, no município de Salto do Lontra, Estado do Paraná. Foram utilizadas imagens do satélite SPOT-5 para a realização da classificação supervisionada pelo algoritmo de Máxima Verossimilhança – MAXVER, e para a averiguação da qualidade da água foram analisados os parâmetros pH, CE, HCO3-, Cl-, PO43-, NO3-, turbidez,
temperatura e coliformes termotolerantes, em dois períodos anuais distintos de precipitação. Os dados de qualidade da água foram submetidos às análises estatísticas pelas técnicas de ACP e AF, para a identificação das variáveis mais relevantes na avaliação da qualidade da água de irrigação. A caracterização de uso e ocupação do solo pelo classificador MAXVER permitiu a identificação das classes: culturas agrícolas, solo exposto/resteva, mata e área urbana. A aplicação da técnica ACP dos dados de qualidade da água de irrigação explicou 53,27% da variação na qualidade da água entre os pontos amostrados. Verificou-se que os parâmetros nitrato, coliformes termotolerantes, temperatura, condutividade elétrica e bicarbonato foram os parâmetros que melhor explicaram a variação espacial da qualidade da água.
INTRODUCTION
Agricultural, livestock, industrial activities and urban expansion process generate a number of impacts on the environment. Consequently, the quest for sustainable use of natural resources has attracted increasing interest of researchers for the recognition of the characteristics and environmental realities.
As for agriculture, its effects depend heavily on practices used in each region, as well as the intensive use of pesticides. The contribution represented by agricultural practices refers to the increase in sediment production, from soil erosion, especially when erosion is not properly controlled, can intensify the occurrence of rainfall in rural areas. On the other hand, the permanent preservation areas has as main function the preservation of water resources and biodiversity, avoiding contamination by fertilizers and pesticides, promoting water retention in the soil and subsoil, in order to contain the erosion and silting of rivers (MASCARENHAS et al., 2009).
As a basis for studies on water quality, the techniques of remote sensing and geoprocessing can be applied in mapping the use and occupation of soil, providing support to work with systematic information and tools that provide detailed reconnaissance of the study area (MERCANTE et al., 2009), allowing the processing of a large amount of information through Geographic Information Systems (FERREIRA et al., 2011).
The monitoring of environmental variables can result in the formation of large databases, which interpretation can be complex (FRANÇA, 2009). On the other hand, multivariate statistical methods such as Principal Component Analysis (PCA), allow the ordering of the variables according to their characteristics, usually the environmental ones of these places, supporting the interpretation of chemical, physical and biological parameters of water quality (ALVES et al., 2008).
The objectives of this study were to perform the mapping of the use and occupation of soil, from supervised classification in satellite images and analyze the quality of water used for irrigation applied by means of multivariate statistical techniques.
MATERIAL AND METHODS
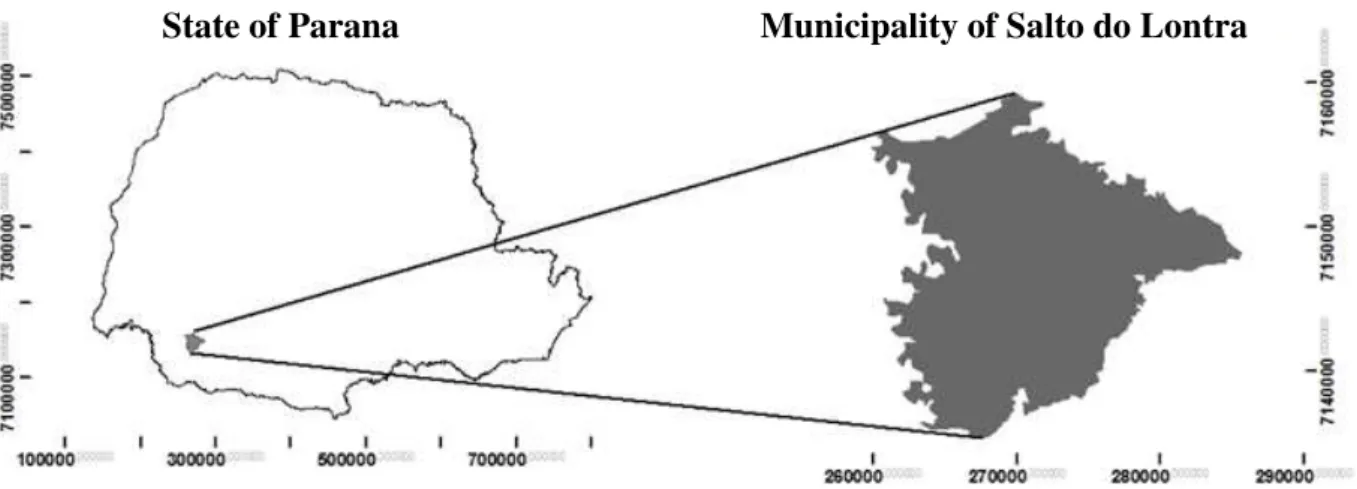
The study area is located in the municipality of Salto do Lontra. Its approximate UTM coordinates are 7,143,050 meters N and 268,163 meters E, WGS 84 datum, Zone 22 S. It is located in the Southwest region of the state of Paraná, PR, with total area of about 312.199 km² and a maximum altitude of 620m. It has an extensive rural area which corresponds to 99% of the total municipal area (IPARDES, 2010). Figure 1 shows the map location of the municipality of Salto do Lontra, in the state of Paraná.
FIGURE 1. Location map of Salto do Lontra municipality in the state of Paraná. WGS 84 Datum, UTM coordinates, Zone 22 S.
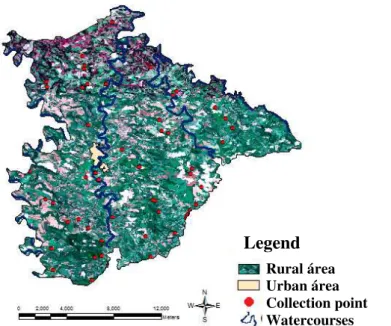
Figure 2 shows the spatial map of the municipality of Salto do Lontra - PR, with the location of urban and rural areas and main rivers in the municipality, as well as the spatial distribution of the 57 sampling points on the farms studied.
FIGURE 2. Spatialization of collection points of irrigation water in farms of Salto do Lontra –PR. Image of Satellite SPOT-5 in RGB composite (bands B3, B2, B1). WGS 84 Datum, UTM coordinates, zone 22 S.
To investigate the quality parameters of the water used for irrigation, the physical, chemical and biological parameters were analysed based on Resolution number 357/05 of CONAMA - National Environment Council ( BRASIL , 2005) and also on FAO - Food and Agriculture Organization of the United Nations (AYERS & WESTCOT, 1991), and certain chemical characteristics of the water through the pH, electrical conductivity (EC), bicarbonate (HCO3-), chloride (Cl-), phosphate (PO43-) and nitrate (NO3-) parameters. For the physical parameters of
water quality, turbidity and temperature were assessed; and regarding the biological parameters of water quality, the presence of thermotolerant coliforms was analyzed. The evaluated parameters followed the recommendations of AYERS & WESTCOT (1991) and experimental procedures were conducted according to the Standard Methods (APHA et al., 1998).
The monitoring of the quality of irrigation water was conducted in two distinct periods of rainfall. The period I was in September/October 2009 and period II in May/June 2010. In period I, characterized as the period of greatest rainfall based on data from the Simepar Technological Institute (2010), the average precipitation (mm) was 260.9mm. In the period II, characterized by lower rainfall, it was registered 126.2mm of average rainfall (mm) between May and June 2010.
The analysis results were tabulated using the statistical software Minitab version 16.0 and served to compose a database, then compared with the proposed resolutions. Thus, the water quality in the sampled points was evaluated through the creation of spatial maps containing those values obtained for each parameter analyzed.
The remote sensing products consisted in images of the satellite SPOT-5 from the Institute of Lands, Mapping and Geosciences (ITCG) provided by the Department of Urban Development/PARANACIDADE through the Mapping Project of the State of Paraná.
The definition of classes for use and occupation of the soil was determined by identifying the different targets present, by recognizing the spectral signature of each class of land use in the imaged area, with subsequent elaboration of the thematic legend of the mapping through classification of digital data. A supervised classification of the image via Maximum Likelihood (MAXVER) was conducted, which allows the classifier to associate a particular pixel to a particular
class or regions of similarity of gray levels. Thus, a set of pixels, representing each soil occupancy target, belongs to the corresponding class if the probability that the class associated with this pixel is greater than the probability that the pixel is associated with any other class. The classifier by Maximum Likelihood (MAXVER) for the identification of spectral variations in the vegetation and in the mapping of use and occupation of soil was applied (WRUBLACK et al., 2012).
From images of the satellite SPOT-5, scenes 703/401, 704/401 and 704/402 of 2005, in the projection system of Universal Transverse Mercator - UTM, WGS 84 datum, zone 22 S, mapping of the soil use was created with the aid of SIG ENVI version 4.5 using the MAXVER algorithm for the following classes: forest, crops, soil/stubble and urban area.
From the classification carried out, the statistical technique of Kappa was applied as a measure of thematic classification accuracy. Rates of overall accuracy (OA) and the Kappa coefficient (K) defined by equations (1) and (2), respectively (CONGALTON & GREEN, 1999) were determined:
(1)
where,
N = total number of points; xii= main diagonal elements;
r = rows in error Matrix, and
i,j = rows and columns of the Matrix, respectively.
(2)
where
K = concordance Kappa coefficient;
N = number of observations (sampled points);
r = number of rows in error Matrix;
xii = observation in the i-th row and i-th column; xi+ = Marginal total of row i;
x+I = Margonal total of column i;
The error matrix was generated by the software ENVI 4.0, in the sample space of the municipality of Salto do Lontra - PR, with the spatial distribution of 100 sample points through random sampling, within the limits of the municipality. From these points, the error matrix regarding the thematic map of the use and occupation of soil, obtained by the MAXVER classifier, were generated.
To check the interference of the use and occupation of soil with the results obtained regarding the physical, chemical and biological parameters of the irrigation water quality, the multivariate statistical analysis by Principal Component Analysis – PCA and Factor Analysis – FA were used. Multivariate analysis was performed by PCA (Principal Component Analysis), and the program STATÍSTICA version 6.0 was used, thus analyzing the descriptive and exploratory statistics of the data obtained.
RESULTS AND DISCUSSION Thematic mapping
The definition of use of soil refers to human activities or economic functions associated with a specific region, while occupation of soil refers to the characteristics present in the soil surface, as areas under crops, forests, rivers, lakes and roads.
Occupation of soil can be interpreted by satellite images, while the activities related to use of soil, often need to be raised locally. In this sense, the conditions of use and occupation may indicate the pressure and impact on the natural elements, constituting an essential element for analysis of pollution sources.
Areas with occupation on small farms (30 hectares) are prevalent in the studied municipality and they are intended for livestock and secondarily to agriculture, characterized primarily by the activities of family farming, in which agricultural production is diverse, characterized by subsistence farming.
Characterization of use and occupation of soil through supervised classification
The use of supervised classification by maximum likelihood - MAXVER allowed the definition of the following classes of occupation of use of soil: forest, crops, soil/stubble and urban area. Table 1 shows the characterization of each class, with the quantification of the area in hectares and percentage of occupancy in the total area in the municipality of Salto do Lontra - PR.
TABLE 1. Characterization of use and occupation of soil in accordance with the supervised classification.
Use of soil Area in km2 Area (hectares) Area (%)
Forest 83.13 8313.0 26.61
Crops 122.70 12270.0 39.28
Soil/Stubble 102.90 10290.0 23.94
Urban área 3.60 360 1.15
Total area classified 312.33 31233.0 100%
The thematic map resulting from supervised classification of images of the satellite SPOT-5 shows areas with forests in the class identified by the blue color. The areas corresponding to crops are identified by the red color, areas with exposed soil or stubble are shown by the green color and the urban area is represented by the beige color, as shown in Figure 3.
FIGURE 3. Image classified by the MAXVER algorithm. WGS 84 datum, UTM coordinates, zone 22 S.
Crops
Exposed soil/stubble Wood
Since the municipality crops are quite diverse, they hinder the interpretation of the images by the classifier, thus the accuracy of the results were evaluated by constructing the confusion matrix from 100 sampling points by the method of random sampling. Based on this matrix, Overall Accuracy and Kappa indexes were calculated, as shown in Table 2.
TABLE 2. Values for Overall Accuracy and Kappa indexes obtained by the the MAXVER Classifier.
Indexes Value found
Overall Accuracy 89.00
Kappa 88.98
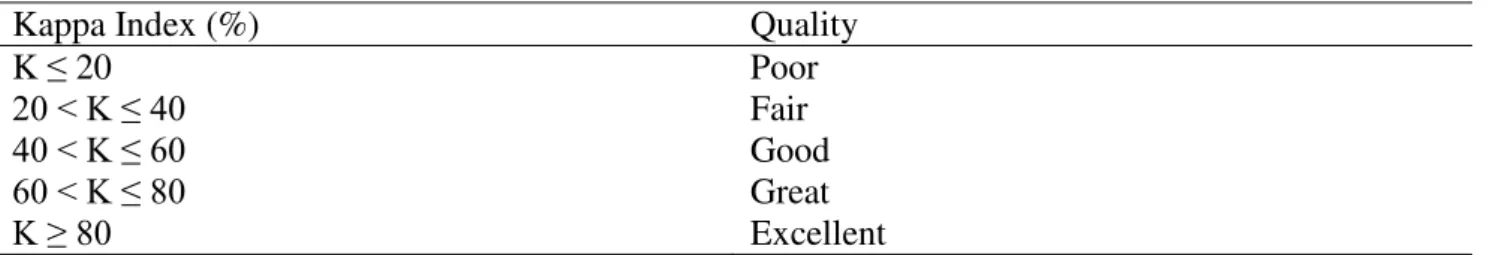
The level of accuracy of the Kappa index used to assess the accuracy of the data provided by LANDIS & KOCH (1977) is shown in Table 3.
TABLE 3. Accuracy levels of a classification according to the Kappa index value.
Kappa Index (%) Quality
K ≤ 20 Poor
20 < K ≤ 40 Fair
40 < K ≤ 60 Good
60 < K ≤ 80 Great
K ≥ 80 Excellent
The overall accuracy and Kappa indexes were higher than 80%, i.e., more than 80% of samples were correctly identified by the classifier. Considering the recommended levels for metrics of overall accuracy and Kappa index greater than 80%, LANDIS & KOCH (1977) suggest the classification as excellent. It is noteworthy that the results obtained in the supervised classification refer to a region characterized by family farms, in which the use and occupation of soil has high heterogeneity, resulting in miscellaneous pixel values, jeopardizing the classification (AMARAL et al., 2009).
Quality of irrigation water
Table 4 shows the distribution of the percentage results of restriction of the use of water used for irrigation, obtained in two different periods of annual rainfall.
TABLE 4. Distribution of percentage results of restriction of the water use in irrigation during the period I (Sept./Oct. – 2009) and period II (May/June – 2010).
Period I Period II
Parameters Thresholds
FAO Studies - Irrigation
and drainage
ResolutionCONAMA 357/05
FAO Studies - Irrigation and drainage
Resolution CONAMA
357/05
pH 6.5-8.4 - - - -
EC 0 - 3.0dS/m - - - -
Bicarbonate 0 – 10meq/L - - - -
Cloride 0 - 30meq/L - - - -
Fosfate 0 - 2mg/L 63.15% - 84.2% -
Nitrate 0 -10mg/L - - - -
Turbidity 100UNT - - - -
Temperature - - - - -
Thermotolerant coliforms
Chemical parameters of quality of irrigation water
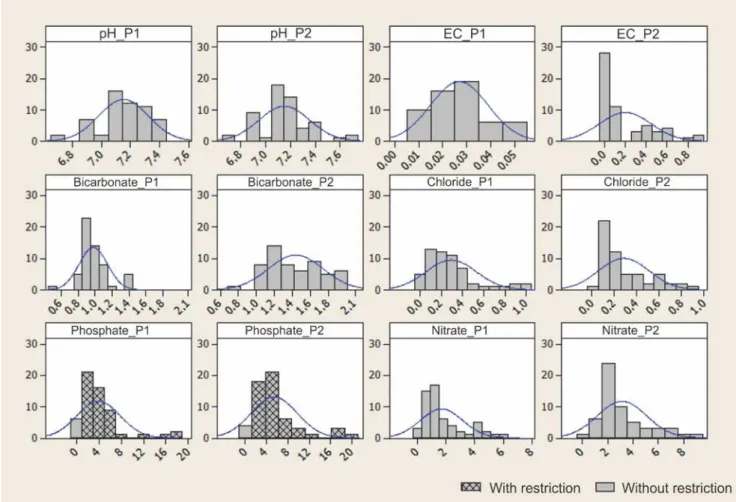
Figure 4 shows the resulting histograms for each chemical parameter analyzed in periods I and II to the frequency of the observations in the 57 irrigation water collection points.
FIGURE 4. Distribution of frequencies of chemical parameters of pH, EC, bicarbonate, chloride, phosphate and nitrate in the 57 irrigation water collection points in periods of high (P1) and low precipitation (P2).
The values obtained for the chemical parameter of pH - –power of hydrogen, were in agreement with the threshold proposed by FAO for using the water for irrigation purposes. The occurrence of pH values between 6.0 and 9.0 are considered compatible in the long-term survival of most aquatic organisms. Changes of these thresholds for long periods of time or strong fluctuations in pH in the short term may interfere with the physical and chemical processes in a water body and may even constitute a limiting factor for biological processes (FRANÇA, 2009).
The results obtained for electrical conductivity met the thresholds defined by FAO for the use of irrigation water. The recognition of electrical conductivity in agricultural areas is critical (SONCELA et al., 2011) since the increase can be explained, in part, due to agricultural practices through improper irrigation management (REZENDE et al., 2011) and the excessive use of fertilizers associated with the misuse of agricultural implements, which contribute to soil compaction, causing drainage problems, resulting in the flow of these ions to water bodies.
The results for chlorine, did not characterize restriction to the use of water for irrigation during the studied period. The investigation of this parameter is essential, since it indicates domestic sewage pollution (PALACIO et al., 2011).
Phosphate concentrations were above the threshold proposed by FAO in 63.15% of the collection points in the period I (high precipitation) and 84.2% in period II (less precipitation). High phosphate concentrations may be associated with anthropogenic factors of domestic and industrial sewage and the runoff in areas under agricultural cultivation (ZANINI et al., 2010) and (FRANÇA, 2009).
Regarding the nitrate parameter, the threshold proposed by FAO was considered, which determines the maximum limit of 10mg/L and did not define the restriction to use for this parameter based on the results obtained in the two periods.
For the rural activities, recognition of the concentrations of nitrogen and phosphorus must be highlighted, since these nutrients can contribute to excessive growth of algae that feed on them (ALVES et al., 2008) and of organisms that feed on these algae, causing phenomena of eutrophication of waters.
Physical parameters of quality of irrigation water
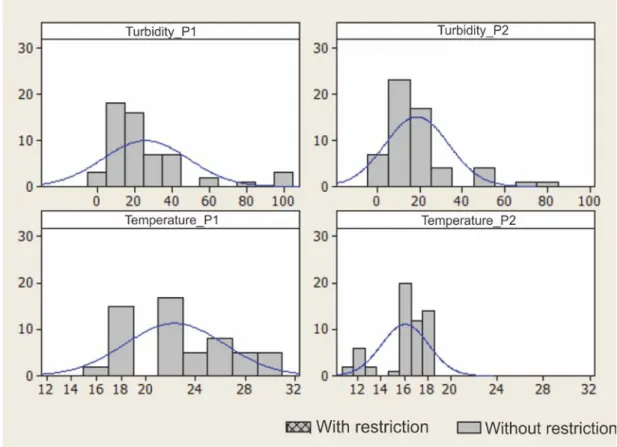
The histograms of Figure 5 represent the physical parameters of quality of irrigation water of the two studied periods with different annual rainfall.
FIGURE 5. Distribution of frequencies of physical parameters of turbidity and temperature in the 57 irrigation water collection points in periods of high (P1) and low precipitation (P2).
The physical parameter of temperature is not set to irrigation water, however, it is referred to the application in certain crops, so that the occurrence of higher temperatures may result in an increased demand for irrigation (ROMITELLI & PATERNIANI, 2007) and (FRAVET & CRUZ, 2007) due to increased evapotranspiration from plants (GONDIM et al., 2011).
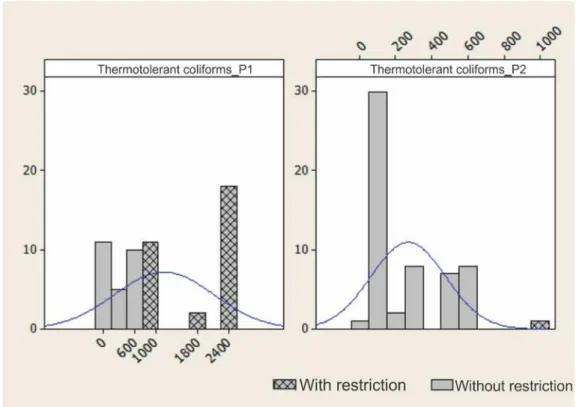
Figure 6 shows the results obtained for the biological parameter of thermotolerant coliforms in the 57 irrigation water collection points during the two distinct periods of annual precipitation.
FIGURE 6. Distribution of frequencies of thermotolerant coliforms in the 57 irrigation water collection points in periods of high (P1) and low precipitation (P2).
For the presence of thermotolerant coliforms in irrigation water, it was found that 54.4% of the collection points of irrigation water had concentrations above the limit established by Resolution 357/05 of CONAMA (1,000MPN/100mL) for usoffing the water in irrigation and for animals during the period I, characterized by higher precipitation. In the period II, of lower precipitation, one collection point presented concentrationsabove the limit established for using the water in irrigation . In the period of higher rainfall, the sediment delivery to watercourses due to the absence of systems for domestic wastewater treatment, solid waste collection and lack of street paving (POLETO, 2011) may have favored an increase in the concentrations of these microorganisms through animal waste or by poor sanitation, of human waste. These factors constitute the main indicator of the presence of fecal contamination in the water body (SILVA et al., 2008); (BONNET et al., 2008).
The occurrence of rainfall associated with the soil surface runoff can be enhanced by soil slope (FRANCO & HERNANDEZ, 2009). These factors together may result in a higher concentration of the chemical and biological parameters, as evidenced by the concentration of thermotolerant coliforms and phosphate levels in this study.
Characteristics of use and occupation of soil and parameters of quality of irrigation water Assuming that the parameters of water quality constitute the dependent variables, which may be influenced by the characteristics of the use and occupation of soil, a multivariate analysis of data, using the technique of PCA, aiming at reducing the number of variables, improving the interpretation and, thereby, identifying which variables or combinations of variables explain most of the total variance, was carried out.
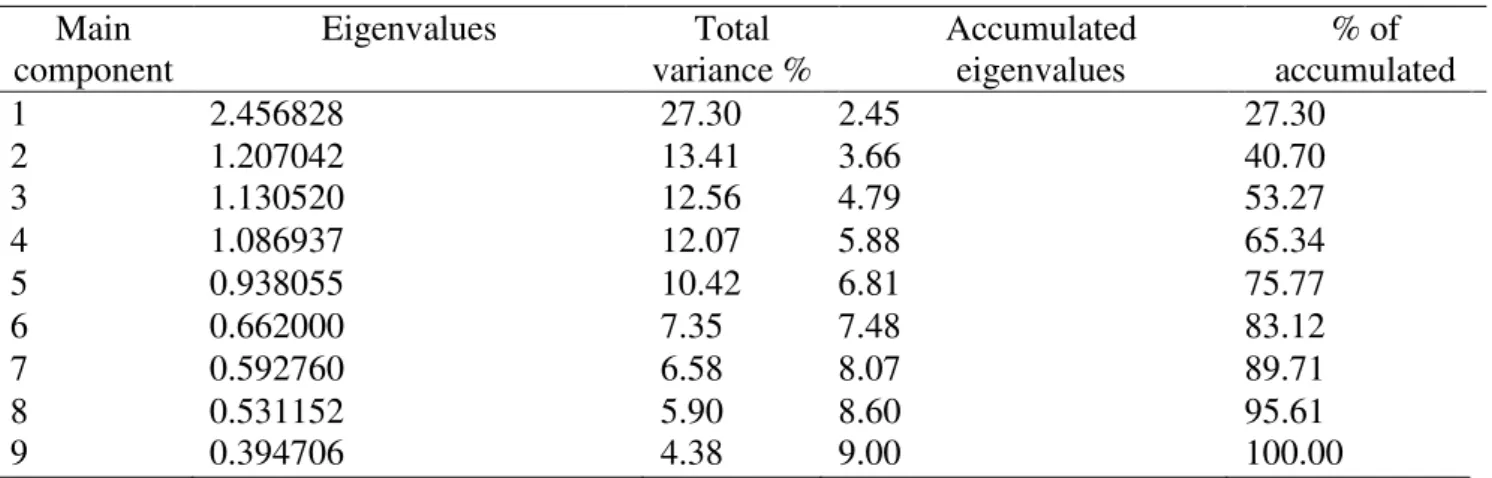
The PCA of the chemical, physical and biological data of water, analyzed in periods I and II, explained 53.27% of the variation in water quality between the properties sampled in the municipality of Salto do Lontra - PR. The factorial values assigned to each component, as well as the percentage of the total variance accounted for by each component, are shown in Table 5.
TABLE 5. Eigenvalues and variance explained by each numerical value. Main
component
Eigenvalues Total
variance %
Accumulated eigenvalues
% of accumulated
1 2.456828 27.30 2.45 27.30
2 1.207042 13.41 3.66 40.70
3 1.130520 12.56 4.79 53.27
4 1.086937 12.07 5.88 65.34
5 0.938055 10.42 6.81 75.77
6 0.662000 7.35 7.48 83.12
7 0.592760 6.58 8.07 89.71
8 0.531152 5.90 8.60 95.61
9 0.394706 4.38 9.00 100.00
It is found that the first three components explain, respectively: 27.30%, 13.41% and 12.56% of the total variance of the data, focusing on three dimensions 53.27% of the information contained in the 9 previous dimensions.
To estimate the factors, the method of principal components was used, ensuring the consistency of the structure of factor analysis by measuring the adequacy of the sample of Kaiser-Meyer-Olkin (KMO) to check the validity of the use of Factor Analysis.
The adequacy measure of the Kaiser-Meyer-Olkin (KMO) sample is represented by an index (MSA) that evaluates the adequacy of factor analysis, calculated by equation 4.
(4)
where,
is the square of the elements of the original correlation matrix (out of diagonal);
is the square of the elements out of diagonal of the anti-image matrix (where is the coefficient of partial correlation between the variables Xj and Xk, correlation elements).
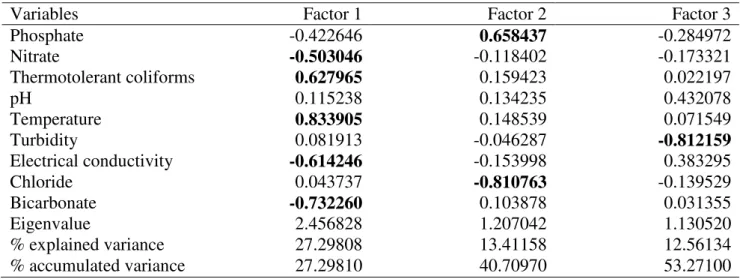
Table 6 shows the values for the factor weights of components 1, 2 and 3. They show the relationship between factors and variables and allow identification of variables with higher interrelationships between each axis.
TABLE 6. Correlation matrix among the original variables and main components.
Variables Factor 1 Factor 2 Factor 3
Phosphate -0.422646 0.658437 -0.284972
Nitrate -0.503046 -0.118402 -0.173321
Thermotolerant coliforms 0.627965 0.159423 0.022197
pH 0.115238 0.134235 0.432078
Temperature 0.833905 0.148539 0.071549
Turbidity 0.081913 -0.046287 -0.812159
Electrical conductivity -0.614246 -0.153998 0.383295
Chloride 0.043737 -0.810763 -0.139529
Bicarbonate -0.732260 0.103878 0.031355
Eigenvalue 2.456828 1.207042 1.130520
% explained variance 27.29808 13.41158 12.56134
% accumulated variance 27.29810 40.70970 53.27100
High values suggest what the most significant variables in each factor are. In factor 1, the variables coliforms, temperature, nitrate, electrical conductivity and bicarbonate showed weight higher than 0.5, indicating that these variables are more significant in defining the quality of the water studied.
Among the parameters analyzed, it was found that nitrate; the thermotolerant coliforms, temperature, electrical conductivity and bicarbonate were the parameters that best explained the spatial variation of water quality, with the highest correlations with the main axis.
In axis 1, the high positive correlation between the physical parameter of the temperature and the biological parameter of thermotolerant coliform is due to the fact that the activity of the coliform group is directly influenced by temperature, indicating that, for biological activity, temperature and thermotolerant coliforms are directly related.
The correlation with the electrical conductivity and the bicarbonate alkalinity was expected, since the electrical conductivity expresses the concentration of ions in solution. Especially in water used for irrigation, the association of bicarbonate to higher values for other ions, such as chloride and sodium (PALACIO et al., 2011); (ARRAES et al., 2009).
On the other hand, the high nitrate levels in water may have its origin in organic fertilizers (LEAL et al., 2009). If they are improperly applied, they can reach water bodies, especially during rainy periods, what is also an indicative of sewage releases far away from water bodies (ALVES et al., 2008).
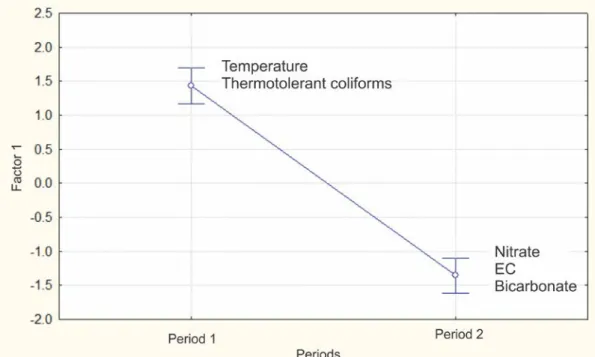
FIGURE 7. Behavior of the variables in two distinct periods of annual precipitation.
In the period I, characterized by a higher precipitation, parameters have different behavior than that found for the same parameters in period II, of lower precipitation. Agricultural activities can cause changes in the aquatic environment, especially during the rainy season, in which the surface runoff promotes entrainment of soil particles to the riverbeds and increases the water level, thus diluting the concentration of some chemical elements of water and subsequent leaching of fertilizer or carrying various materials deposited on the soil (LEAL et al., 2009).
CONCLUSIONS
By mapping the use and occupation of soil, it became clear that the municipality is characterized by an extensive rural area, with a predominance of areas under crops and bare soil/stubble in the scene image used with good percentage of area with woods.
Using the MAXVER classifier, the values obtained for the classification were considered excellent by the rates of Overall Accuracy and Kappa during the mapping of the use and occupation of soil in the municipality of Salto do Lontra - PR.
The multivariate analysis by the Principal Component Analysis and Factor Analysis identified the most significant variables in assessing the quality of irrigation water in the two distinct periods of annual precipitation.
During the period of higher precipitation, parameters of thermotolerant coliforms and temperature were the parameters that best explained the variation in the quality of irrigation water, and in the period of low precipitation, parameters of nitrate, electrical conductivity and bicarbonate were the parameters that best explained the variation in quality of irrigation water.
The parameters phosphate and thermotolerant coliforms presented some restrictions to the use of water for irrigation and were related to the use and occupation of soil, in areas of predominance of agriculture in the municipality.
ACKNOWLEDGEMENTS
REFERENCES
ALVES, E. C.; SILVA, C. F.; COSSICH, E. S.; TAVARES, C. R. G.; SOUZA-FILHO, E. E.; CARNIEL, A. Avaliação da qualidade da água da bacia do rio Pirapó – Maringá, Estado do Paraná, por meio de parâmetros físicos, químicos e microbiológicos. Acta Scientiarum Technology.
Maringá, v. 30, n. 1, p. 39-48, 2008.
AMARAL, M. V.; SOUZA, A. L.; SOARES, V. P.; SOARES, C. P. B.; LEITE, H. G.; MARTINS, S. V.; FERNANDES FILHO, E. I.; LANA, J. M. Avaliação e comparação de métodos de
classificação de imagens de satélites para o mapeamento de estádios de sucessão florestal. Revista Árvore, Viçosa-MG, v. 33, p. 575-582, 2009. Disponível em:
<http://www.scielo.br/scielo.php?pid=S0100-67622009000300019&script=sci_arttext > Acesso em: 23 maio 2012.
APHA; AWWA; WEF. Standard methods for the examination of water and wastewater. 20th ed. Washington: American Public Health Association, 1998. 937 p.
ARRAES, F. D. D; ANDRADE, E. M.; PALÁCIO, H. A. Q.; FROTA, J. I. J.; SANTOS, J. C. N. Identificação dos íons determinantes da condutividade elétrica nas águas superficiais da Bacia do Curu, Ceará. Revista Ciência Agronômica, Fortaleza, v.40, p.346-355, 2009.
AYERS, R. S; WESTCOT, D. W. A qualidade da água na agricultura. Tradução de H. R. Gheyi; J. F. de Medeiros; F. A. V. Damasceno. Campina Grande: UFPB, 1991. 218 p. (Estudos FAO:
Irrigação e Drenagem, n.29, revisado 1).
BONNET, B. R. P.; FERREIRA, L. G.; LOBO, F. C. Relações entre qualidade da água e uso do solo em Goiás: Uma análise à escala da Bacia Hidrográfica. Revista Árvore,Viçosa, v. 32 n. 2, p. 311-322, 2008. Disponível em: http://dx.doi.org/10.1590/S0100-67622008000200014. Aceso em: 12 dez. 2012.
BRASIL. Ministério do Meio Ambiente. CONAMA - Conselho Nacional de Meio Ambiente. Resolução nº 357, de 17 de março de 2005. Dispõe sobre a classificação dos corpos de água e diretrizes ambientais para o seu enquadramento, bem como estabelece as condições e padrões de lançamento de efluentes, e dá outras providências. Diário Oficial da União, Brasília, 18 mar. 2005. CONGALTON, R.G.; GREEN, K. Assessing the accuracy of remotely sensed data: principles and pratices. Washington: Lewis Publishers, 1999. 137 p.
FERREIRA, E.; TOLEDO, J. H.; DANTAS, A. A. A.; PEREIRA, R. M.; Cadastral maps of irrigated áreas by Center pivots in the state of Minas Gerais, using CBERS-2B/CCD satellite imaging. Revista Brasileira de Engenharia Agrícola, Jaboticabal, v. 31, n. 4, p. 771-780, jul./ago. 2011. Disponível em: <http://www.scielo.br/scielo.php?pid=S0100-69162011000400015&sc ript=sci_arttext >. Acesso em: 10 maio 2012.
FERREIRA PINTO, D. B.; SILVA, A. M. MELLO, C. R. COELHO, G. Qualidade da água do Ribeirão Lavrinha na região Alto Rio Grande – MG, Brasil. Ciência e Agrotecnologia, Lavras, v. 33, n. 4, jul./ago. 2009.
FRANCO, R. A. M; HERNANDEZ, F. B. T; Qualidade da água para irrigação na microbacia do Coqueiro do Estado de São Paulo. Revista Brasileira de Engenharia Agrícola e Ambiental, Campina Grande, n.6, p.772-780, 2009.
FRANÇA, M. S. Análise estatística multivariada dos dados de monitoramento de qualidade de água da bacia do Alto Iguaçu: Uma ferramenta para a gestão de recursos hídricos. 2009. 150 f. Dissertação (Mestrado em Engenharia de Recursos Hídricos e Ambiental) - Universidade Federal do Paraná, Curitiba, 2009.
GONDIM, R. S.; CASTRO, M. A. H.; EVANGELISTA, S. R. M.; FUCK-JÚNIOR, S. C. F.; SOUSA, S. A. M. Impacto das mudanças climáticas na evapotranspiração de referência, em nível de Bacia Hidrográfica utilizando um sistema de informações geográfica. Revista Brasileira de Recursos Hídricos, Porto Alegre, v. 16, n. 2, p. 5-12, abr./jun. 2011.
IPARDES. Instituto Paranaense de Desenvolvimento Econômico e Social. Caderno estatístico do município de Salto do Lontra. Dezembro, 2010.
LANDIS, J.; G. KOCH. The measurement of observer agreement for categorical data, Washington, USA. Biometrics, Washington, v. 33, n. 1, p. 159-174, 1977.
LEAL, C. M; ANDRADE-JUNIOR, A. S; SOUZA, V. F. SILVA, E. F. F; BASTOS, E. A. Qualidade da água subterrânea para fins de irrigação na microrregião de Teresina, Piauí. Irriga, Teresina, v. 14, n. 3, p.276-288, 2009.
MASCARENHAS, L. M. A.; FERREIRA, M. E.; FERREIRA, L. G. Sensoriamento remoto como instrumento de controle e proteção ambiental: análise da cobertura vegetal remanescente na bacia do rio Araguaia. Sociedade & Natureza, Uberlândia, v. 21, n. 1, p. 5-18, 2009.
MERCANTE, E.; LAMPARELLI, R. A. C.; URIBE-OPAZO, M. A.; ROCHA, J. V. Características espectrais da soja ao longo do ciclo vegetativo com imagens LANDSAT 5/TM em área agrícola no oeste do Paraná. Revista Brasileira de Engenharia Agrícola e Ambiental, Campina Grande, v. 29, n. 02, p. 328-338, 2009.
PALACIO, H. A. Q.; ARAÚJO NETO, J. R.; MEIRELES, A. C. M.; ANDRADE, E. M.; SANTOS, J. C. N.; CHAVES, L. C. G. Similaridade e fatores determinantes na salinidade das águas superficiais do Ceará, por técnicas multivariadas. Revista Brasileira de Engenharia Agrícola e Ambiental, Campina Grande, v. 25, n. 4, p. 395-402, 2011. Disponível em:
<http://www.scielo.br/pdf/rbeaa/v15n4/v15n04a11.pdf> Acesso em: 13 maio 2012.
POLETO, C. Alterações morfológicas em um canal fluvial urbano no contexto antrópico, social e ambiental: um estudo de caso. Acta Scientiarum. Technology. Maringá, v. 33, n. 4, p. 357-364, 2011.
REZENDE, F. C.; RIBEIRO, V. B.; ÁVILA, L. F.; FARIA, M. A.; MELLO, C. R. Variabilidade espacial da condutividade elétrica EM ÁREA COM CAFEEIRO (Co ea arabica L.) adubado via fertirrigação e sistema tradicional. Coffee Science, Lavras, v. 6, n. 1, p. 55-64, jan./abr. 2011. ROMITELLI, L.; PATERNIANI, J. E. Diagnóstico ambiental de um trecho do Córrego Bonifácio, APA Jundiaí - SP. Engenharia Ambiental, Espírito Santo do Pinhal, v. 4, n. 2, p. 14-25, 2007. SILVA, A. E. P.; ANGELIS, C. F.; MACHADO, L. A. T; WAICHAMAN, A. V. Influência da precipitação na qualidade da água do Rio Purus. Acta Amazônica, Manaus, v. 38, n. 4, p. 733-742, 2008.
SIMEPAR. Sistema Meteorológico do Paraná. Curitiba, 2010.
SONCELA, R.; SAMPAIO, S. C.; VILAS BOAS, M. A.; TAVARES, M. H. F.; SOUZA, C. F.; SONCELA, A. S. Condutividade elétrica do solo irrigado com água residuária da suinocultura estimado pelo domínio do tempo reflectometria. Revista Brasileira de Ciência do Solo, Viçosa-MG, v. 35, jul./ago. 2011.
WRUBLACK, S. C.; MERCANTE, E.; VILAS BOAS, M. A. Utilização de técnicas de geoprocessamento para caracterização de áreas aptas à irrigação por gotejamento
no município de Salto do Lontra – Paraná. Revista deEstudos Ambientais, Blumenau, v. 14, n. 2, p. 6-13, 2012. Número especial.