doi:10.1155/2012/959715
Research Article
Annual and Seasonal Changes in the Structure of Litter-Dwelling
Ant Assemblages (Hymenoptera: Formicidae) in Atlantic
Semideciduous Forests
Fl ´avio Siqueira de Castro,
1, 2Alexandre Bahia Gontijo,
1, 2Paulo de Tarso Amorim Castro,
3and S´ervio Pontes Ribeiro
1, 21Laboratory of Evolutionary Ecology of Canopy Insects and Natural Succession, Department of Biodiversity, Evolution and
Environment, Federal University of Ouro Preto, 35400-000 Ouro Preto, MG, Brazil
2Post-Graduate Program in Ecology of Tropical Biomes, Department of Biodiversity, Evolution and Environment, Federal University of
Ouro Preto, 35400-000 Ouro Preto, MG, Brazil
3Departament of Geology, Federal University of Ouro Preto, EM/ Universidade Federal de Ouro Preto, 35400-000 Ouro Preto,
MG, Brazil
Correspondence should be addressed to Fl´avio Siqueira de Castro,[email protected] S´ervio Pontes Ribeiro,[email protected]
Received 1 June 2011; Revised 12 August 2011; Accepted 13 August 2011
Academic Editor: Jacques H. C. Delabie
Copyright © 2012 Fl´avio Siqueira de Castro et al. This is an open access article distributed under the Creative Commons Attribution License, which permits unrestricted use, distribution, and reproduction in any medium, provided the original work is properly cited.
We surveyed ant fauna in the leaf litter in an Atlantic Semideciduous forest in the State Park of Rio Doce (PERD). The work aimed to produce basic information about habitat effects on diversity, as well as about how the ant fauna in a such buffered forest habitat, as the litter layer, could respond the climate variation in a short and long term. We sampled two years in two distinct forest physiognomies, which respond to different geomorphologic backgrounds, in dry and rainy seasons. Species composition, richness and abundance of these forests were distinct. However, both forests hosted similar numbers of rare and specialized, habitat demanding species, thus suggesting both are similarly well preserved, despite distinct physiognomies. However, the lower and more open forest was, more susceptible to dry season effects, showing a steeper decline in species numbers in such season, but similar numbers in the wet seasons. The pattern varied between years, which corroborates the hypothesis of a strongly variable community in response to subtle climatic variation among years. The present results are baselines for future long term monitoring projects, and could support protocols for early warnings of global climatic changes effects on biodiversity.
1. Introduction
Species richness and composition respond to different habi-tat variables and abiotic factors that influence climate, sea-sonality, humidity, topography, and lithology [1–4]. The construction of the concept of “habitat components” is based on the interactions between abiotic and biotic variables, which result in the parameters on which the niches of species evolve [5]. One habitat component which is hardly studied is its temporal variance, due to the fact that it is highly unpre-dictable [6].
Forest litter is a crucial habitat compartment for mineral cycling, humidity retention, and, greatly, to biodiversity
maintenance [7,8]. Conversely, the insect fauna that domi-nates the litter is a fundamental factor for its transformation. In a whole tropical forest, ants and termites are the most important animals in relation to biomass and relative abundance. Ants are found in virtually all strata of forests, playing a key role in structuring ecological communities in tropical ecosystems [9]. They are responsible for processes of soil mineralization due to its extensive bioturbation activity [10], promoting changes in physical environments [7], and, consequently, a vast movement of nutrients [8,
are also responsible for important predation rates on tropical forests (e.g., army ants) [11].
For ant assemblages, the negative effects of low temper-ature [18], intense rainfalls (daily and cumulative), plus the positive effects of high relative humidity of the understorey and forest ground, influence directly the foraging and nesting [19]. The effect of intense rainfall may occur due to inter-ference in the communication process between individuals, by literally washing down the worker’s chemical trails, or by flooding areas with soils less susceptible to drainage [20]. Thus, these factors affect many phenological activities in the colonies [20,21] and are crucial parameters in structuring ground-dwelling ant assemblages in tropical forests [18–20]. Additionally, it may have confounding positive effects with the rainfall, such as increasing humidity or increasing the litter volume [22], thus resulting in a difficulty to evaluate the real effects on the ants assemblages.
Therefore, the way how seasons and years (namely general weather conditions) should affect ant species param-eters along time must be highly variable and unpredictable. Campos et al. [23] have shown that arboreal ant assemblage in an Atlantic semideciduous forest, in the State Park of Rio Doce, responded as strongly to host trees as to time passing, and more significantly than to seasonality. Further, the authors observed that changes in ant fauna was not affected by the host plant habitat specificities, such as being in a forest artificial border, within the forest, or in a natural lake ashore. In other words, ant species composition and relative density may respond to more subtle components of the environment.
In the present study, we aimed to evaluate the effects of habitats and temporal variation on the litter-dwelling ant species richness, abundance, and composition in this same semideciduous Atlantic forest. In order to investigate the hypothesis that temporal variation may have stronger effect than habitat specificities, we sampled in two contrasting forest physiognomies, in two different geomorphologic back-grounds.
2. Materials and Methods
2.1. Study Sites. Samples were taken in the State Park of Rio
Doce (PERD-IEF), Marli´eria, Minas Gerais. This is approx-imately 36,000 ha of protected forests and lakes, compris-ing part of the municipalities of Tim ´oteo, Marli´eria, and Dion´ısio—between the parallels 19◦48′18′′–19◦29′24′′S and
meridians 42◦38′30′′–42◦28′18′′W. The park is bound in
the East by the Doce River and Piracicaba River to the North [24]. The vegetation is characterized as lower montane Atlantic semideciduous forest, with a percentage of decid-uous trees between 20 and 50% [25,26]. The forest varies greatly in physiognomy and soil conditions from north to south. Also, the park preserves the largest natural lake system in the Atlantic rainforest domain (10% of its area) that resulted from geological movements around the old Doce river and affluents during the Pleistocene [27].
The climate is tropical humid mesothermal [28]. The wet season occurs from October to March and the dry
PERD area
Study sites
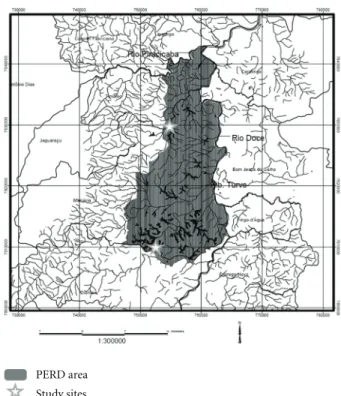
Figure1: Map showing the location of the PERD and the study
sites in relation to the surrounding region. Star at the north showing the location of Macuco’s IMA (TM) and at the south showing the Gambazinho’s IMA (LG) (Source: [22].)
season from April to September [29]. Samples were taken in August (dry season) and November (rainy season) in the years of 2005 and 2006, in two different areas: the Lagoa do Gambazinho’s IMA (Integrated Monitoring Array) (here-after LG) (southern PERD) and the Trilha Macuco ou Juquita’s IMA (hereafter TM) (northern PERD) (Figure 1).
The LG is composed by a secondary, edaphically con-strained low forest vegetation (10–15 m high) [30] in an area with irregular topography, varying from hills to lowlands, with permanent and temporary swamps [31]. In the TM, there is a predominance of high and medium forest in the lowlands and medium forests in the slopes and crests, with little topographic variation, but the presence of alternating hills and lowlands. The whole area of the TM is in an old alluvial terrace, the paleochannel of the Belem River (tribu-tary of Doce River), while LG has a distinct geological unit, and this entire area lies on a unit called litostatigragphic Mantiqueira Complex [31].
2.2. Sampling Design. The study areas are two permanent
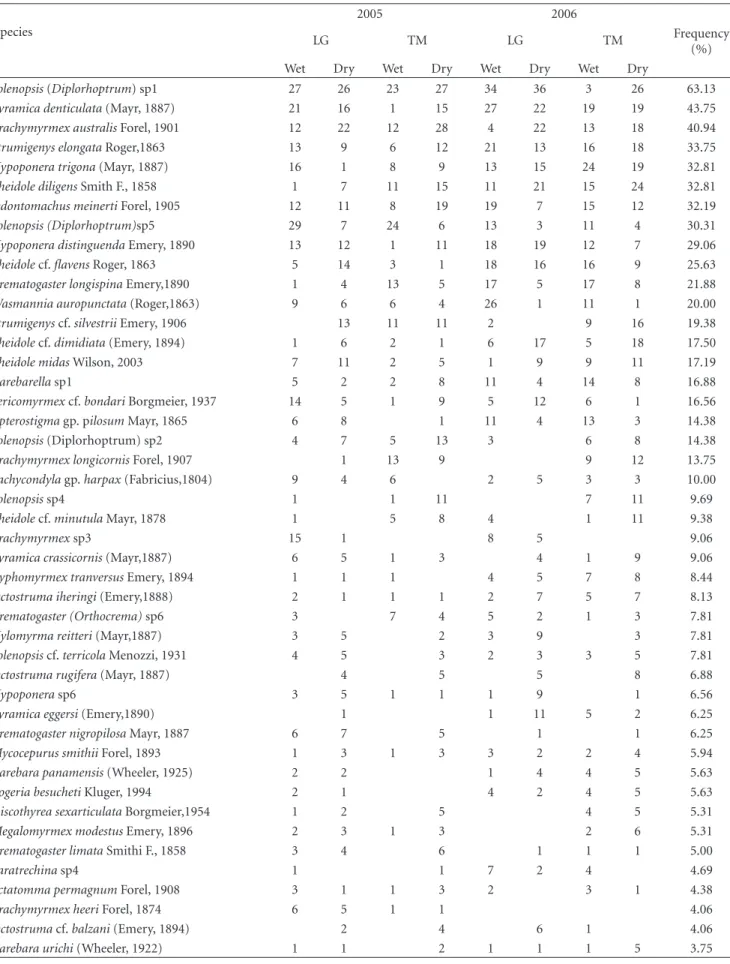
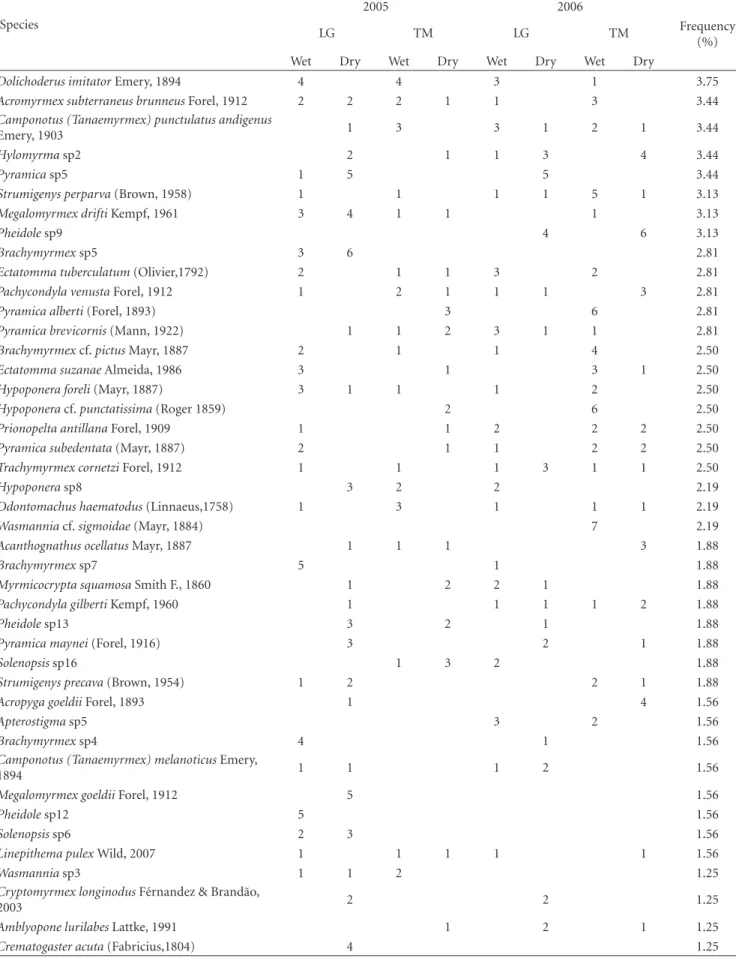
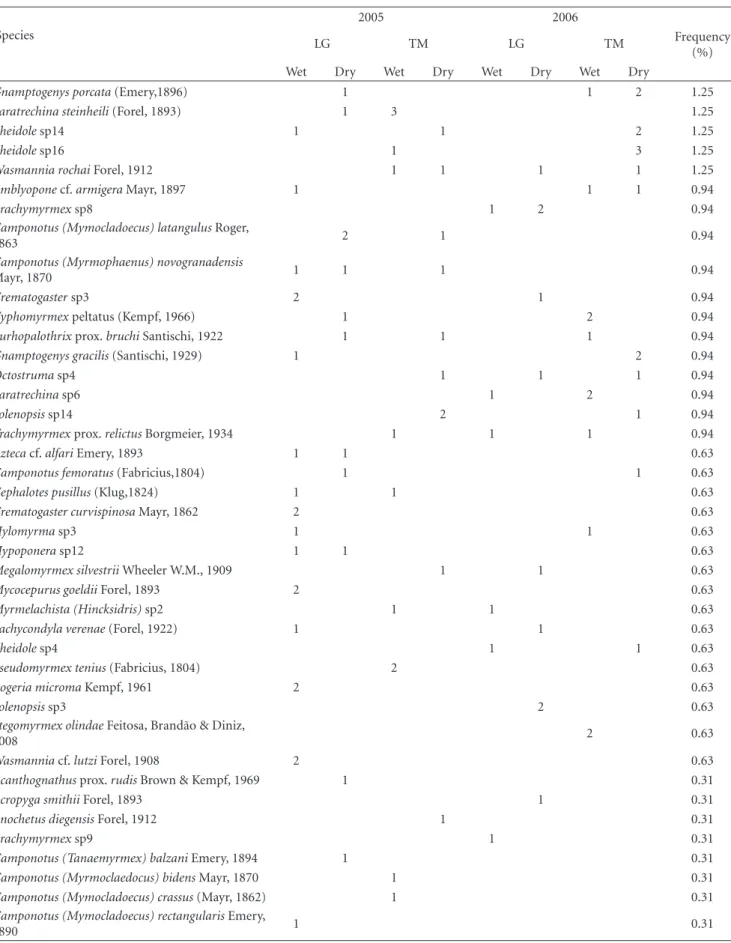
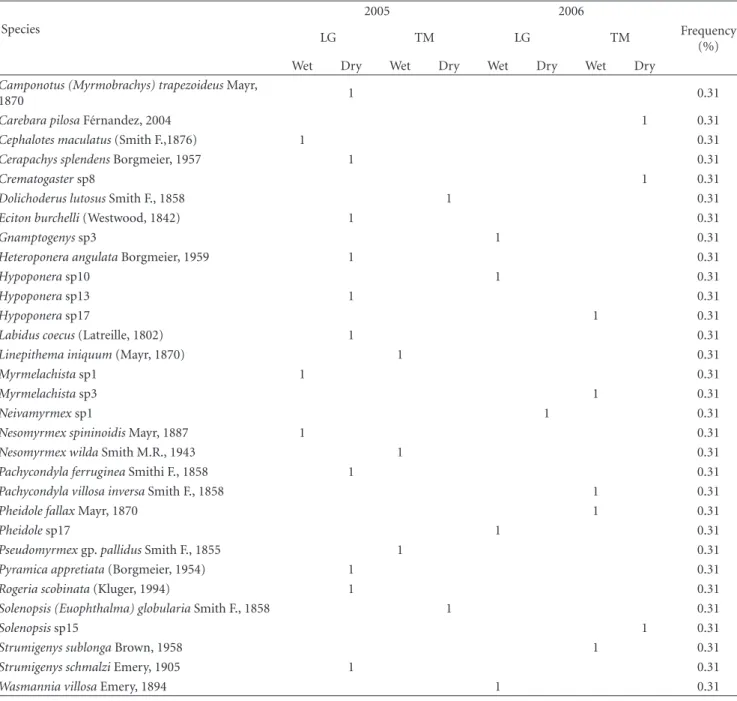
Table1: Number of hits (records) and overall frequency (%) of ant species per IMA, LG, and TM.
Species
2005 2006
LG TM LG TM Frequency
(%) Wet Dry Wet Dry Wet Dry Wet Dry
Solenopsis(Diplorhoptrum) sp1 27 26 23 27 34 36 3 26 63.13
Pyramica denticulata(Mayr, 1887) 21 16 1 15 27 22 19 19 43.75
Brachymyrmex australisForel, 1901 12 22 12 28 4 22 13 18 40.94
Strumigenys elongataRoger,1863 13 9 6 12 21 13 16 18 33.75
Hypoponera trigona(Mayr, 1887) 16 1 8 9 13 15 24 19 32.81
Pheidole diligensSmith F., 1858 1 7 11 15 11 21 15 24 32.81
Odontomachus meinertiForel, 1905 12 11 8 19 19 7 15 12 32.19
Solenopsis (Diplorhoptrum)sp5 29 7 24 6 13 3 11 4 30.31
Hypoponera distinguendaEmery, 1890 13 12 1 11 18 19 12 7 29.06
Pheidolecf.flavensRoger, 1863 5 14 3 1 18 16 16 9 25.63
Crematogaster longispinaEmery,1890 1 4 13 5 17 5 17 8 21.88
Wasmannia auropunctata(Roger,1863) 9 6 6 4 26 1 11 1 20.00
Strumigenyscf.silvestriiEmery, 1906 13 11 11 2 9 16 19.38
Pheidolecf.dimidiata(Emery, 1894) 1 6 2 1 6 17 5 18 17.50
Pheidole midasWilson, 2003 7 11 2 5 1 9 9 11 17.19
Carebarellasp1 5 2 2 8 11 4 14 8 16.88
Sericomyrmexcf.bondariBorgmeier, 1937 14 5 1 9 5 12 6 1 16.56
Apterostigmagp. pilosumMayr, 1865 6 8 1 11 4 13 3 14.38
Solenopsis(Diplorhoptrum) sp2 4 7 5 13 3 6 8 14.38
Brachymyrmex longicornisForel, 1907 1 13 9 9 12 13.75
Pachycondylagp.harpax(Fabricius,1804) 9 4 6 2 5 3 3 10.00
Solenopsissp4 1 1 11 7 11 9.69
Pheidolecf.minutulaMayr, 1878 1 5 8 4 1 11 9.38
Brachymyrmexsp3 15 1 8 5 9.06
Pyramica crassicornis(Mayr,1887) 6 5 1 3 4 1 9 9.06
Cyphomyrmex tranversusEmery, 1894 1 1 1 4 5 7 8 8.44
Octostruma iheringi(Emery,1888) 2 1 1 1 2 7 5 7 8.13
Crematogaster (Orthocrema)sp6 3 7 4 5 2 1 3 7.81
Hylomyrma reitteri(Mayr,1887) 3 5 2 3 9 3 7.81
Solenopsiscf.terricolaMenozzi, 1931 4 5 3 2 3 3 5 7.81
Octostruma rugifera(Mayr, 1887) 4 5 5 8 6.88
Hypoponerasp6 3 5 1 1 1 9 1 6.56
Pyramica eggersi(Emery,1890) 1 1 11 5 2 6.25
Crematogaster nigropilosaMayr, 1887 6 7 5 1 1 6.25
Mycocepurus smithiiForel, 1893 1 3 1 3 3 2 2 4 5.94
Carebara panamensis(Wheeler, 1925) 2 2 1 4 4 5 5.63
Rogeria besuchetiKluger, 1994 2 1 4 2 4 5 5.63
Discothyrea sexarticulataBorgmeier,1954 1 2 5 4 5 5.31
Megalomyrmex modestusEmery, 1896 2 3 1 3 2 6 5.31
Crematogaster limataSmithi F., 1858 3 4 6 1 1 1 5.00
Paratrechinasp4 1 1 7 2 4 4.69
Ectatomma permagnumForel, 1908 3 1 1 3 2 3 1 4.38
Brachymyrmex heeriForel, 1874 6 5 1 1 4.06
Octostrumacf.balzani(Emery, 1894) 2 4 6 1 4.06
Table1: Continued.
Species
2005 2006
LG TM LG TM Frequency
(%) Wet Dry Wet Dry Wet Dry Wet Dry
Dolichoderus imitatorEmery, 1894 4 4 3 1 3.75
Acromyrmex subterraneus brunneusForel, 1912 2 2 2 1 1 3 3.44
Camponotus (Tanaemyrmex) punctulatus andigenus
Emery, 1903 1 3 3 1 2 1 3.44
Hylomyrmasp2 2 1 1 3 4 3.44
Pyramicasp5 1 5 5 3.44
Strumigenys perparva(Brown, 1958) 1 1 1 1 5 1 3.13
Megalomyrmex driftiKempf, 1961 3 4 1 1 1 3.13
Pheidolesp9 4 6 3.13
Brachymyrmexsp5 3 6 2.81
Ectatomma tuberculatum(Olivier,1792) 2 1 1 3 2 2.81
Pachycondyla venustaForel, 1912 1 2 1 1 1 3 2.81
Pyramica alberti(Forel, 1893) 3 6 2.81
Pyramica brevicornis(Mann, 1922) 1 1 2 3 1 1 2.81
Brachymyrmexcf.pictusMayr, 1887 2 1 1 4 2.50
Ectatomma suzanaeAlmeida, 1986 3 1 3 1 2.50
Hypoponera foreli(Mayr, 1887) 3 1 1 1 2 2.50
Hypoponeracf.punctatissima(Roger 1859) 2 6 2.50
Prionopelta antillanaForel, 1909 1 1 2 2 2 2.50
Pyramica subedentata(Mayr, 1887) 2 1 1 2 2 2.50
Trachymyrmex cornetziForel, 1912 1 1 1 3 1 1 2.50
Hypoponerasp8 3 2 2 2.19
Odontomachus haematodus(Linnaeus,1758) 1 3 1 1 1 2.19
Wasmanniacf.sigmoidae(Mayr, 1884) 7 2.19
Acanthognathus ocellatusMayr, 1887 1 1 1 3 1.88
Brachymyrmexsp7 5 1 1.88
Myrmicocrypta squamosaSmith F., 1860 1 2 2 1 1.88
Pachycondyla gilbertiKempf, 1960 1 1 1 1 2 1.88
Pheidolesp13 3 2 1 1.88
Pyramica maynei(Forel, 1916) 3 2 1 1.88
Solenopsissp16 1 3 2 1.88
Strumigenys precava(Brown, 1954) 1 2 2 1 1.88
Acropyga goeldiiForel, 1893 1 4 1.56
Apterostigmasp5 3 2 1.56
Brachymyrmexsp4 4 1 1.56
Camponotus (Tanaemyrmex) melanoticusEmery,
1894 1 1 1 2 1.56
Megalomyrmex goeldiiForel, 1912 5 1.56
Pheidolesp12 5 1.56
Solenopsissp6 2 3 1.56
Linepithema pulexWild, 2007 1 1 1 1 1 1.56
Wasmanniasp3 1 1 2 1.25
Cryptomyrmex longinodusF´ernandez & Brand˜ao,
2003 2 2 1.25
Amblyopone lurilabesLattke, 1991 1 2 1 1.25
Table1: Continued.
Species
2005 2006
LG TM LG TM Frequency
(%) Wet Dry Wet Dry Wet Dry Wet Dry
Gnamptogenys porcata(Emery,1896) 1 1 2 1.25
Paratrechina steinheili(Forel, 1893) 1 3 1.25
Pheidolesp14 1 1 2 1.25
Pheidolesp16 1 3 1.25
Wasmannia rochaiForel, 1912 1 1 1 1 1.25
Amblyoponecf.armigeraMayr, 1897 1 1 1 0.94
Brachymyrmexsp8 1 2 0.94
Camponotus (Mymocladoecus) latangulusRoger,
1863 2 1 0.94
Camponotus (Myrmophaenus) novogranadensis
Mayr, 1870 1 1 1 0.94
Crematogastersp3 2 1 0.94
Cyphomyrmexpeltatus (Kempf, 1966) 1 2 0.94
Eurhopalothrixprox.bruchiSantischi, 1922 1 1 1 0.94
Gnamptogenys gracilis(Santischi, 1929) 1 2 0.94
Octostrumasp4 1 1 1 0.94
Paratrechinasp6 1 2 0.94
Solenopsissp14 2 1 0.94
Trachymyrmexprox.relictusBorgmeier, 1934 1 1 1 0.94
Aztecacf.alfariEmery, 1893 1 1 0.63
Camponotus femoratus(Fabricius,1804) 1 1 0.63
Cephalotes pusillus(Klug,1824) 1 1 0.63
Crematogaster curvispinosaMayr, 1862 2 0.63
Hylomyrmasp3 1 1 0.63
Hypoponerasp12 1 1 0.63
Megalomyrmex silvestriiWheeler W.M., 1909 1 1 0.63
Mycocepurus goeldiiForel, 1893 2 0.63
Myrmelachista (Hincksidris)sp2 1 1 0.63
Pachycondyla verenae(Forel, 1922) 1 1 0.63
Pheidolesp4 1 1 0.63
Pseudomyrmex tenius(Fabricius, 1804) 2 0.63
Rogeria micromaKempf, 1961 2 0.63
Solenopsissp3 2 0.63
Stegomyrmex olindaeFeitosa, Brand˜ao & Diniz,
2008 2 0.63
Wasmanniacf.lutziForel, 1908 2 0.63
Acanthognathusprox.rudisBrown & Kempf, 1969 1 0.31
Acropyga smithiiForel, 1893 1 0.31
Anochetus diegensisForel, 1912 1 0.31
Brachymyrmexsp9 1 0.31
Camponotus (Tanaemyrmex) balzaniEmery, 1894 1 0.31
Camponotus (Myrmoclaedocus) bidensMayr, 1870 1 0.31
Camponotus (Mymocladoecus) crassus(Mayr, 1862) 1 0.31
Camponotus (Mymocladoecus) rectangularisEmery,
Table1: Continued.
Species
2005 2006
LG TM LG TM Frequency
(%) Wet Dry Wet Dry Wet Dry Wet Dry
Camponotus (Myrmobrachys) trapezoideusMayr,
1870 1 0.31
Carebara pilosaF´ernandez, 2004 1 0.31
Cephalotes maculatus(Smith F.,1876) 1 0.31
Cerapachys splendensBorgmeier, 1957 1 0.31
Crematogastersp8 1 0.31
Dolichoderus lutosusSmith F., 1858 1 0.31
Eciton burchelli(Westwood, 1842) 1 0.31
Gnamptogenyssp3 1 0.31
Heteroponera angulataBorgmeier, 1959 1 0.31
Hypoponerasp10 1 0.31
Hypoponerasp13 1 0.31
Hypoponerasp17 1 0.31
Labidus coecus(Latreille, 1802) 1 0.31
Linepithema iniquum(Mayr, 1870) 1 0.31
Myrmelachistasp1 1 0.31
Myrmelachistasp3 1 0.31
Neivamyrmexsp1 1 0.31
Nesomyrmex spininoidisMayr, 1887 1 0.31
Nesomyrmex wildaSmith M.R., 1943 1 0.31
Pachycondyla ferrugineaSmithi F., 1858 1 0.31
Pachycondyla villosa inversaSmith F., 1858 1 0.31
Pheidole fallaxMayr, 1870 1 0.31
Pheidolesp17 1 0.31
Pseudomyrmexgp.pallidusSmith F., 1855 1 0.31
Pyramica appretiata(Borgmeier, 1954) 1 0.31
Rogeria scobinata(Kluger, 1994) 1 0.31
Solenopsis (Euophthalma) globulariaSmith F., 1858 1 0.31
Solenopsissp15 1 0.31
Strumigenys sublongaBrown, 1958 1 0.31
Strumigenys schmalziEmery, 1905 1 0.31
Wasmannia villosaEmery, 1894 1 0.31
thus 16 per year, with 10 samples of 1 m2litter per transect,
using the apparatus of Mini-Winkler [34], equidistant 10 m one from another, summing up 320 samples on two years. Each transect had its exact position previously sorted using random numbers and a plotted map of the transect, thus assuring a fully random sampling design.
Ants were taken to the lab, sorted, and identified to genera. Species confirmations were achieved in collaboration with the Myrmecological laboratory of CEPLAC, Bahia. The collection is saved in both CEPLAC and in the collection of the Laboratory of Evolutionary Ecology of Canopy Insects, in DEBIO/ICEB/UFOP.
2.3. Data Analysis. In order to evaluate the effect of
accumu-lation of species in each sampling unit and for all observed
data, we made species accumulation curves (Coleman method), which devise the expected richness for random subsamples of the data set grouped [35,36]. Calculations were made using the computer program EstimateS version 8 [35]. The Coleman curve is essentially the same to a rare-faction curve and more efficient computationally [37,38]. The Abundance-based Coverage Estimator (ACE) was used as estimator of species richness [35,39], because the coeffi -cient of variation (CV) was larger (CV=0.519) than
abun-dance distribution. When the CV was larger than CV>0.5,
Chao [39] and Colwell [35] recommend Chao 1 and ACE as the best estimates for abundance-based richness.
out for the data on species presence and absence in each plot, using the Jaccard index. We used analysis of similarities (ANOSIM) [40] to test for differences in species composition between areas. In order to investigate patterns of similarity between the ant communities in both areas, we used the relative differences between R-value of the ANOSIM test [41]. These analyses were performed using the software PAST [42].
Factorial analysis of variance (ANOVA) models [43], with Poisson distribution of data (which is automatically log-transformed in the model in order to best fit the distribu-tion) [44], were used to analyse the results. The statistical package GLZ-Generalized Linear/Nonlinear Models (Statsoft Statistica 7.0 software) was used when generating analyses of the frequency of occurrence of ants (number of records) and the total number of species for each sample (transect) in different areas, seasons, and between years. Wald’s test was used to verify the true parameter value based on the sample estimate, assuming that the value ofP < 0.05 is significant.
The measures of relative abundance (frequency of species per transect) were based on the number of occurrences of species per point (each 1 m2of the transect), summing up 10
possible occurrences of each species per transect, or 40 per season/IMA.
3. Results
In total 2851 individuals, 48 genera and 160 morphospecies were identified and recorded, belonging to 11 subfamilies: Amblyoponinae, Cerapachyinae, Dolichoderinae, Ecitoni-nae, EctatommiEcitoni-nae, FormiciEcitoni-nae, HeteroponeriEcitoni-nae, Myr-micinae, Ponerinae, Proceratiinae, and Pseudomyrmicinae. Most of species and genera found belong to the subfamily Myrmicinae, followed by Formicinae and Ponerinae. Only four of the 11 subfamilies of ants were not common to the two areas: Cerapachyinae, Ecitoninae, and Heteroponerinae were found only in the TM, while Pseudomyrmicinae was found only in LG.
The number of genera occurrences was very similar bet-ween the two sites. LG showed 40 genera, being four habitat-specific genera: Cephalotes, Myrmelachista, Pseudomyrmex,
andStegomyrmex. TM had 44 genera, eight habitat-specific
genera: Acropyga, Anochetus, Cerapachys, Cryptomyrmex,
Eciton,Heteroponera,Labidus,andNeivamyrmex(Table 1).
In both areas, we found typical litter-forest genera ( Stegomyr-mex in LG,CerapachysandCryptomyrmexin TM), typical forest species or species only recently described, for example,
Wasmannia villosaandStegomyrmex olindaein LG, and the
typical soil ant Cerapachys splendens and Cryptomyrmex
longinodusin TM. New species for science, being in process
of description, were also found, as Hylomyrma sp2
(MZUSP).
Species richness did not reach stabilized at the end of the
sampling, even after combining all samples (n = 32;
Figure 2). The total species richness of the ant
commu-nity per transect (1 ha) was estimated to be around 200 species, and rare-faction curve was reached to be around 160 species (Coleman’s method) (Figure 2). For both IMA,
0 50 100 150 200 250
1 6 11 16 21 26 31
C
u
m
ulati
ve
species
n
u
mber
Cumulative number of transects
ACE All observed
Trilha Macuco Lagoa Gambazinho
Figure 2: Accumulation curve of species richness (obtained by
Coleman’s method) for all sampling (solid black line), for Lagoa Gambazinho (dashed grey line), and for Trilha Macuco (thin black line). The overall species richness for both IMAs was estimated with Chao 2.
0.06 0.03 0
−0.03
−0.06
−0.09
−0.12
−0.15
−0.18
0 0.12 0.24 0.36 0.48 0.6 0.72 0.84 0.96
Axis 1
Ax
is
2
Stress: 0.35
Lagoa Gambazinho Trilha Macuco
Figure 3: NonMetric Dimensional Scale (NMDS) ordination of
species composition of the ant community in both IMA as sampled by Mini-Winkler.
species richness was similar (rarefied species richness for
122 occurrences Coleman method = 4.22 ± 1.63 for LG
and 4.27±1.53 for TM,Figure 2). However, differences in
species composition were detected among areas, as revealed by NMDS (ANOSIM,R=0.23,P < 0.001;Figure 3).
Regardless seasonal and yearly variations, species rich-ness was very similar between both areas (Factorial ANOVA, Wald X2(1)
=1.06, P = 0.30). The LG had 126 species,
LG TM
Total
Total Dry
Both
Both
Wet
16
6
18
10 79
14 7
42
95
23 2
8
36 89 35 160
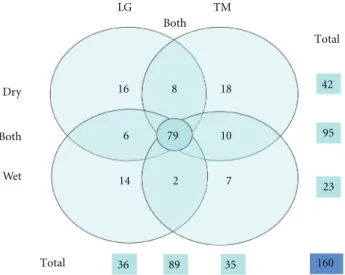
Figure4: Diagram representing the number and distribution of ant
species in both IMA (Lagoa Gambazinho and Trilha Macuco) and in two seasons (dry and wet). Separation criteria were unique to each of the IMA and weather stations (large circles), collected in both IMA (intersections of top and bottom), collected in two seasons (intersections of left and right), and collected in two IMA and in two seasons or in at least one weather station (central circle).
Table 1). However, the species richness found were quite
different between the dry period (42 species) and the rainy season (24 species), and this difference was due to a strong reduction of species in LG, the low and more open forest, during the dry periods (Figure 5(a)). It is worth to notice that there were more species in common between the areas during the dry season than in rainy season. Species such
Aztecacf.alfari,Brachymyrmexcfpictus,B. sp5,Camponotus
(Tanaemyrmex)balzani,Paratrechina steinheili,Hypoponera
sp12, Solenopsissp5, andWasmanniasp3 were found only in the dry season, while Brachymyrmex sp8 and Pheidole
sp4 were found only in wet season (Figure 4andTable 1). Species richness declined in the LG in the dry season, when compared to TM or to itself in the rainy season, but only for 2006 (Factorial ANOVA, Climatic Season∗Year, Wald
X2(1)
=6.81,P = 0.009;Figure 5(a)). The inconsistency of
this decline in 2005 resulted in a lack of significant differences in species richness between areas (Factorial ANOVA, Wald
X2(1)
=0.46,P = 0.50; Factorial ANOVA, IMA∗Climatic
Season∗Year, Wald X2(1)=0.50,P = 0.48) (Figure 5(a)).
A similar interaction effect between area and year effects (Factorial ANOVA, IMA∗Year, Wald X2(1) = 7.34, P =
0.006) and the effects of season and year (Factorial ANOVA, Climatic Season∗Year, WaldX2(1)
=17.70, P = 0.00003)
defined the variance in ant abundance between the areas. Likewise species richness, the ant abundance declined strongly in the dry season of 2006 and only. In the present case, the strength of this interaction was perceptible in the three levels, thus reflecting in the mean numbers of ants between areas, greater in the TM, the tallest forest (Factorial
10 15 20 25 30 35 40 45 50 55 60 65
Dry season Wet season Dry season Wet season
Log
o
f
sp
ecies
ric
hness
2005 2006
(a)
Dry season Wet season Dry season Wet season
0 20 40 60 80 100 120 140 160
Lo
g
abu
nd
an
ce
2005 2006
Lagoa Gambazinho
Trilha Macuco
(b)
Figure5: Species richness (a) and relative abundance (b) (number
of occurrences on transects) of ant species in both IMA, in two seasons (dry and wet), and in two years (2005 and 2006).
ANOVA, IMA∗Climatic Season∗Year Wald,X2(1) = 5.02,
P=0.02;Figure 5(b)).
The overall mean abundance was also very similar bet-ween areas (Factorial ANOVA, Wald X2(1)
= 1.46, P =
0.23). The 10 most abundant species throughout the
sam-pling wereSolenopsissp1, followed byPyramica denticulata,
elongata,Pheidole diligens,Odontomachus meinerti,H.
dis-tinguenda, S. sp5, and P. cf. flavens. However, at LG,
the speciesB. australis andP. diligens, were not among the most abundant species. In this area, besides the other eight previously mentioned, we found Crematogaster longispina
andWasmannia auropunctataamongst the most abundant.
In the TM,Solenopsissp5 was not as abundant as the others, whileP.cf.dimidiatawas found among the most abundant. Regarding rare species, the LG presented 36 species, 20 of these were habitat-specific species, while in TM were 33 rare species, and also 20 habitat-specific species (Table 1).
As observed for relative abundance, there was an increase in species richness in the wet season in both areas. However, despite low species richness in the dry season, species composition varied smoothly between years in both areas. The data of the rainy season in LG, for example, showed that the total number of species increased from 67 to 72 in a year to another, and the number of rare species (singletons) decreased from 26 to 21 species (38.8% to 29.2% of species). Values of relative abundance (number of occurrences per sampling event, or 4 transects and 40 points for either season/IMA) of intermediate species (species that were neither among the 10 most abundant or among singletons) varied greatly between years (Table 1), which was related to the variation in numbers of predatory ants species richness and abundance.
4. Discussion
The global ground-dwelling ant diversity in Rio Doce was remarkably high, as well as composed of rare and habitat-demanding species and genera (see below). The ant species richness in the forest litter was substantially higher than ants or general arthropods species in the canopy of these same forests [23,45,46]. In addition, it was comparably as high as in other tropical forests and sometimes comparable to the species richness found and wetter and closer equatorial forests [13,19,36,38].
In spite of differences in physiognomy and geomor-phology found in both areas, the overall mean values of species richness and abundance were not statistically different between these forest types, although there were substantial differences in relation to species composition. However, one could expect to sample more species, especially rare predators and cryptic specialists species in TM than in the LG, due to the tree heights, a better structured understorey, apparent constancy of conditions in the former compared to the latter. These conditions should allow high availability of resources and quality of sites for feeding and nesting areas [47,48]. The TM pristine semideciduous forest was denser in trees, which also had larger basal area than the open, apparently secondary LG [31]. Among many other ecological implications, these traits imply in greater litter biomass in TM compared to LG.
In a close wet and tall forest, there might have less var-iation in abiotic conditions, such as local atmospheric humi-dity and temperature [19], and, sometimes, as is the case of
PERD, this may be further buffered by a smooth and con-tinuous topography [31]. On the other hand, ecological vari-ables such as increased litter production in association with the high heterogeneity of the vegetation may also happen in association to close and tall forests [49], which results in high spatial complexity, allowing diversification of conditions, thus sheltering a large number of species of ants and other invertebrates in the litter and soil [31,45,48,50–52]. Other studies in tropical forests have corroborated that differences of litter ants species diversity and distribution respond to habitats with low and high structural heterogeneity [53–55]. Hence, TM should have the best conditions for more habitat-demanding ant species than LG, unless the habitat conditions in the latter are rather natural too. The region around LG has indeed a more open canopy and lower tree heights than TM, but the cause for its physiognomic pattern is subject of debate. Although the area was impacted by a fire in 1967, there would have been time enough for full recover. Soares [31] and Ribeiro et al. [46] have discussed that a great deal of the observed differences in vegetation are natural rather than result of human past disturbance. Data suggest that physiognomic differences between the two studied areas are evolutionary rather than ecological, and both may sustain equivalent levels of heterogeneity. Indeed, the geomorphologic origins of both forests ought to have stronger effect on their productivity and then on their canopy traits that relate to understorey microclimate and hetero-geneity. Hence, despite apparent vulnerability of LGs and its low resistance to the dry season extreme desiccation, both forests are equivalently rich and populated with ecologically demanding species. Such pattern only could happen if both places had long enough favourable conditions for species evolution.
The occurrence of rare species of ants in the LG, for example,Stegomyrmex olindae, so far found only in humid and mature forests [56], Cryptomyrmex longinodus (first occurrence in the southeastern Brazil; Fern´andez, personal communication),Strumigenys sublonga(cryptic species col-lected by first time in tropical semideciduous forest in Minas Gerais, Castro unpublished data), Eurhopalothrix
prox.bruchi,andOctostrumaspecies, support that this forest, whatever the human impacts suffered in the past, has several ant species typical of environments with greater habitat structural complexity and a well-preserved long evolutionary history. It is quite likely that edaphic-evolving condition found in the LG forest is the best explanation for the fact. This also may explain the fact that there is not any widely distributed tall and closed forest in southern PERD as a whole.
changes in rainfall regimen, unlike 2005, even though we sampled exactly in the same time of the year. For instance, it rained practically every day in August 2006 (a usually very dry month), while in 2005 rainfall was recorded in only four days during the same month. In the rainy season, in relation to data of temperature and humidity, there was no significant dispatch from the expected and the understorey reached values at or near 100% relative humidity in both years. However, in November 2005, the accumulated rainfall index ranged from 312.5 to 330.61 mm (daily rain 89 ±4 mm),
while in 2006, it ranged from 48.43 to 29.99 mm (daily rain 17±5 mm) [57].
These data suggest that in 2006, the rainy season started abnormally earlier (in August). In tropical forests, the cycle of ants colonies is synchronized with the seasonal rainfall and temperature [21], and, although the mechanism is not well known, in the more humid and hot (above 30◦C and
50% of relative humidity), the faster is the development of ant colonies [20]. Nevertheless, the unpredictable start of rains may have a very negative effect in some habitats, by taking the colony not prepared for the change. On the other hand, a badly defined dry season in 2006, with subsequent early onset of the rainy season, may have provided a better partition of resources available for ant assemblage in both areas, especially preys, which could reflect the fast recovery and increasing abundance of predators in the wet season. Indeed, in 2005, some specialist predatory ants were rare or absent, as some species of the genus Strumigenys and
Pyramica, known as specialist predators of Collembola,
Dis-cothyrea sexarticulata, a predator of spider eggs, and the
gen-eralist large predators as Ectatomma and Pachycondyla
species, predators of insects and invertebrates with similar body size or also larger [58].
In conclusion, our results showed that contrasting forest types may have similar total ant species richness, as well as a similar amount of rare and ecologically specialized species. These similarities between these forests suggest that litter-dwelling species may have high resilience, related to the litter habitat conditions, to changes and disturbances in both ecological and evolutionary times.
Acknowledgments
The authors thank the staffof Project TEAM Rio Doce/CI TEAM Initiative, the financial and logistical support, the IEF-MG field structure in PERD, and their respective staff for their assistance in the field to carry out the assessments. By the comments and suggestions, Prof. Dr. Ricardo I. Campos, UFV. By identifying the material: Laboratory of Myrme-cology CEPEC/CEPLAC, Professor Dr. Jacques Delabie and Wesley Duarte da Rocha, and MZUSP, Professor Dr. Carlos Roberto Brand˜ao, Rodrigo Feitosa and Fl´avia Esteves. By the aid of collection and sorting of material to trainees of the Laboratory of Ecology and Biological Sciences course of UFOP, scholars and volunteers, and our lab technician Jaci. They are also grateful to FAPEMIG for scholarships for master’s granted. S. P. Riberiross is granted by CNPq.
References
[1] R. J. Huggett,Geoecology—An Evolutionary approach, Rout-ledge, London, UK, 1995.
[2] J. L. S. Ross, Geomorfologia—Ambiente e Planejamento, Edi-tora Contexto, 5th edition, 2000.
[3] P. D. Raven, R. F. Evert, and S. E. Eichhorn,Biologia Vegetal, Editora Guanabara Koogan, Rio de Janeiro, Brazil, 6th edition, 2001.
[4] H. J. Schenk, C. Holzapfel, J. G. Hamilton, and B. E. Mahall, “Spatial ecology of a small desert shrub on adjacent geological substrates,”Journal of Ecology, vol. 91, no. 3, pp. 383–395, 2003.
[5] M. Begon, C. R. Townsend, and J. L. Harper, Ecologia: De Indiv´ıduos a Ecossistemas, Editora Artmed, S˜ao Paulo, Brazil, 4th edition, 2007.
[6] T. J. Valone, J. H. Brown, and E. J. Heske, “Interactions between rodents and ants in the Chihuahuan Desert: an update,”Ecology, vol. 75, no. 1, pp. 252–255, 1994.
[7] P. J. Folgarait, “Ant biodiversity and its relationship to ecosys-tem functioning: a review,”Biodiversity and Conservation, vol. 7, no. 9, pp. 1221–1244, 1998.
[8] P. Lavelle and A. V. Spain, Soil Ecology, Kluwer Academic, Dodrecht, The Netherlands, 2001.
[9] C. A. Br¨uhl, G. Gunsalam, and K. E. Linsenmair, “Stratifi-cation of ants (Hymenoptera, Formicidae) in a primary rain forest in Sabah, Borneo,”Journal of Tropical Ecology, vol. 14, no. 3, pp. 285–297, 1998.
[10] B. Gunadi and H. A. Verhoef, “The flow of nutrients in a Pinus merkusii forest plantation in central Java; the contribution of soil animals,”European Journal of Soil Biology, vol. 29, no. 3-4, pp. 133–139, 1993.
[11] B. H¨olldobler and E. O. Wilson,The Ants, Belknap Press of Harvard University Press, Cambridge, Mass, USA, 1990. [12] H. G. Fowler, “Provas de melhoria ambiental,”Ciˆencia Hoje,
vol. 24, pp. 69–71, 1998.
[13] H. L. Vasconcelos, M. F. Leite, J. M. S. Vilhena, A. P. Lima, and W. E. Magnusson, “Ant diversity in an Amazonian savanna: relationship with vegetation structure, disturbance by fire, and dominant ants,”Austral Ecology, vol. 33, no. 2, pp. 221–231, 2008.
[14] C. B. Costa, S. P. Ribeiro, and P. T. A. Castro, “Ants as bioindicators of natural succession in Savanna and Riparian Vegetation impacted by dredging in the Jequitinhonha River Basin, Brazil,”Restoration Ecology, vol. 18, no. 1, pp. 148–157, 2010.
[15] M. A. Pizo and P. S. Oliveira, “The use of fruits and seeds by ants in the Atlantic forest of Southeast Brazil,”Biotropica, vol. 32, no. 4 B, pp. 851–861, 2001.
[16] P. R. Guimar˜aes Jr., R. Cogni, M. Galetti, and M. A. Pizo, “Parceria surpreendente,”Ciˆencia Hoje, vol. 187, no. 32, pp. 68–70, 2002.
[17] K. A. B. Kalif, P. R. S. Moutinho, C. Azevedo-Ramos, and S. A. O. Malcher, “Formigas em florestas alteradas,”Ciˆencia Hoje, vol. 187, no. 32, pp. 70–72, 2002.
[18] A. N. Andersen, “Global ecology of rainforest ants. Functional groups in relation to environment stress and disturbance,” in Ants Standard Methods for Measuring and Monitoring Biodiversity, D. Agosti, J. D. Majer, L. E. Alonso, and T. R. Schultz, Eds., pp. 25–34, Smithsonian Institute Press, London, UK, 2000.
[20] M. Kaspari, “Primer on ant ecology,” inAnts Standard Methods for Measuring and Monitoring Biodiversity, D. Agosti, J. D. Majer, L. E. Alonso, and T. R. Schultz, Eds., pp. 9–24, Smith-sonian Institute Press, London, UK, 2000.
[21] M. Kaspari, J. Pickering, J. T. Longino, and D. Windsor, “The phenology of a Neotropical ant assemblage: evidence for continuous and overlapping reproduction,”Behavioral Ecology and Sociobiology, vol. 50, no. 4, pp. 382–390, 2001.
[22] H. H¨ofer, C. Martius, and L. Beck, “Decomposition in an Amazonian rain forest after experimental litter addition in small plots,”Pedobiologia, vol. 40, no. 6, pp. 570–576, 1996. [23] R. I. Campos, J. P. Scares, R. P. Martins, and S. P. Ribeiro,
“Effect of habitat structure on ant assemblages associated to two pioneer tree species (Hymenoptera: Formicidae),” Socio-biology, vol. 47, pp. 722–723, 2006.
[24] “IEF—Instituto Estadual de Florestas,” 2009, http://www.ief .mg.gov.br/component/content/306?task=view.
[25] W. P. Lopes,Flor´ıstica e fitossociologia de um trecho de vegetac¸˜ao arb´orea no Parque Estadual do Rio Doce, Minas Gerais, Vic¸osa, M.S. thesis, Universidade Federal de Vic¸osa, Minas Gerais, Brazil, 1998.
[26] H. P. Veloso, A. L. R. Rangel Filho, and J. C. A. Lima, Classi-ficac¸˜ao da vegetac¸˜ao brasileira, adaptada a um sistema universal, IBGE, Rio de Janeiro, Brazil, 1991.
[27] M. R. M. Meis and J. G. Tundisi, “Geomorphologycal and limnological processes as a basis for lake typology. The middle Rio Doce lake system,” in Limnological Studies on the Rio Doce Valley Lakes, J. G. Tundisi and Y. Saijo, Eds., pp. 25–48, Brasilian Academy of Sciences, Rio de Janeiro, Brazil, 1997. [28] F. Z. Antunes, “Caracterizac¸˜ao clim´atica do Estado de Minas
Gerais,”Informe Agropecu´ario, vol. 12, pp. 1–13, 1986. [29] J. P. Gilhuis,Vegetation survey of the Parque Florestal Estadual
do Rio Doce, MG, Vic¸osa, M.S. thesis, Universidade Federal de Vic¸osa, Minas Gerais, Brazil, 1986.
[30] M. F. Goulart, S. P. Ribeiro, and M. B. Lovato, “Genetic, morphological and spatial characterization of two populations ofMabea fistuliferamart. (Euphorbiaceae), in different succes-sional stages,”Brazilian Archives of Biology and Technology, vol. 48, no. 2, pp. 275–284, 2005.
[31] J. P. Soares,Estudo da Relac¸˜ao entre as Caracter´ısticas Abi´oticas e Bi´oticas na Compartimentac¸˜ao de Comunidades Ecol´ogicas no Parque Estadual do Rio Doce/MG com Base na Geomorfologia e na Interac¸˜ao Inseto-Planta, M.S. thesis, Universidade Federal de Ouro Preto, Ouro Preto, Brazil, 2006.
[32] “TEAM initiative—web site,” 2011,http://www.teamnetwork .org/pt-br.
[33] P. Batra, “TEAM—ant protocol,” 2006, http://www. teamnetwork.org/portal/server.pt/gateway/PTARGS 0 124600 95397 0 0 18/TEAMAnt-PT-EN-2.1.pdf.
[34] B. T. Bestelmeyer, D. Agosti, L. E. Alonso et al., “Field techniques for the study of ground-dwelling ant: an overview, description, and evaluation,” in Ants Standard Methods for Measuring and Monitoring Biodiversity, D. Agosti, J. D. Majer, L. E. Alonso, and T. R. Schultz, Eds., pp. 122–144, Smithsonian Institute Press, London, UK, 2000.
[35] R. K. Colwell, “Estimates: Statistical estimation of species richness and shared five species from samples,” version 8, 2006
http://purl.oclc.org/estimates.
[36] J. H. C. Delabie, B. Jahyny, I. C. Do Nascimento et al., “Con-tribution of cocoa plantations to the conservation of native ants (Insecta: Hymenoptera: Formicidae) with a special emphasis on the Atlantic Forest fauna of southern Bahia, Brazil,”Biodiversity and Conservation, vol. 16, no. 8, pp. 2359– 2384, 2007.
[37] R. K. Colwell and J. A. Coddington, “Estimating terrestrial biodiversity through extrapolation,”Philosophical transactions of the Royal Society, vol. 345, no. 1311, pp. 101–118, 1994. [38] H. L. Vasconcelos, A. C. C. Macedo, and J. M. S. Vilhena,
“Influence of topography on the distribution of ground-dwell-ing ants in an Amazonian forest,”Studies on Neotropical Fauna and Environment, vol. 38, no. 2, pp. 115–124, 2003.
[39] A. Chao, “Species richness estimation,” inEncyclopedia of Sta-tistical Sciences, N. Balakrishnan, C. B. Read, and B. Vidakovic, Eds., pp. 7909–7916, Wiley, New York, NY, USA, 2005. [40] K. R. Clarke, “Non-parametric multivariate analyses of
chang-es in community structure,”Australian Journal of Ecology, vol. 18, no. 1, pp. 117–143, 1993.
[41] F. S. Neves, V. H. F. Oliveira, M. M. Esp´ırito-Santo et al., “Successional and seasonal changes in a community of dung beetles (Coleoptera: Scarabaeinae) in a Brazilian Tropical Dry Forest,”Natureza & Conservac¸˜ao, vol. 8, no. 2, pp. 160–164, 2010.
[42] Ø. Hammer, D. A. T. Harper, and P. D. Ryan, “Past: pale-ontological statistics software package for education and data analysis,”Palaeontologia Electronica, vol. 4, no. 1, pp. XIX–XX, 2001.
[43] R. R. Sokal and F. J. Rohlf,Biometry, W.H. Freeman and Co., New York, NY, USA, 3rd edition, 1995.
[44] L. L. Sørensen, J. A. Coddington, and N. Scharff, “Inventory-ing and estimat“Inventory-ing subcanopy spider diversity us“Inventory-ing semi-quantitative sampling methods in an afromontane forest,”
Environmental Entomology, vol. 31, no. 2, pp. 319–330, 2002. [45] R. I. Campos, H. L. Vasconcelos, S. P. Ribeiro, F. S. Neves, and
J. P. Soares, “Relationship between tree size and insect assem-blages associated withAnadenanthera macrocarpa,”Ecography, vol. 29, no. 3, pp. 442–450, 2006.
[46] S. P. Ribeiro, J. P. Soares, R. I. Campos, and R. P. Martins, “Insect herbivores species associated to pioneer tree species: contrasting within forest and ecotone canopy habitats,”
Revista Brasileira de Zoociˆencias, vol. 10, pp. 141–152, 2008. [47] R. R. Silva, R. S. Machado Feitosa, and F. Eberhardt, “Reduced
ant diversity along a habitat regeneration gradient in the southern Brazilian Atlantic Forest,”Forest Ecology and Man-agement, vol. 240, no. 1–3, pp. 61–69, 2007.
[48] R. Pacheco, R. R. Silva, M. S. C. Morini, and C. R. F. Brand˜ao, “A comparison of the leaf-litter ant fauna in a secondary atlantic forest with an adjacent pine plantation in southeastern Brazil,”Neotropical Entomology, vol. 38, no. 1, pp. 55–65, 2009. [49] S. I. Do Carmo Pinto, S. V. Martins, N. F. De Barros, and H. C. T. Dias, “Litter production in two successional stages of a tropical semideciduous forest in the mata do para´ıso forest reserve in Vic¸osa, MG,”Revista Arvore, vol. 32, no. 3, pp. 545– 556, 2008.
[50] R. K. Didham, J. Ghazoul, N. E. Stork, and A. J. Davis, “Insects in fragmented forests: a functional approach,”Trends in Eco-logy and Evolution, vol. 11, no. 6, pp. 255–260, 1996.
[51] R. K. Didham and N. D. Springate, “Determinants of temporal variation in community structure,” inArthropods of Tropical Forests: Spatio-Temporal Dynamics and Resource Use in the Canopy, Y. Basset, V. Novotny, S. Miller, and R. Kitching, Eds., vol. 1, pp. 28–39, Cambridge University Press, Cambridge, UK, 1 edition, 2003.
[52] C. R. Ribas, J. H. Schoereder, M. Pic, and S. M. Soares, “Tree heterogeneity, resource availability, and larger scale processes regulating arboreal ant species richness,”Austral Ecology, vol. 28, no. 3, pp. 305–314, 2003.
[54] S. A. Lassau and D. F. Hochuli, “Effects of habitat complexity on ant assemblages,”Ecography, vol. 27, no. 2, pp. 157–164, 2004.
[55] S. A. Lassau, G. Cassis, P. K. J. Flemons, L. Wilkie, and D. F. Hochuli, “Using high-resolution multi-spectral imagery to estimate habitat complexity in open-canopy forests: can we predict ant community patterns?”Ecography, vol. 28, no. 4, pp. 495–504, 2005.
[56] R. M. Feitosa, C. R. F. Brand˜ao, and J. L. M. Diniz, “Revi-sionary studies on the enigmatic neotropical ant genus Stego-myrmex emery, 1912 (Hymenoptera: Formicidae: Myrmici-nae), with the description of two new species,”Journal of Hym-enoptera Research, vol. 17, no. 1, pp. 64–82, 2008.
[57] CPTEC-INPE, BDC—Banco de Dados Clim´aticos, Portal de Tecnologia da Informac¸˜ao para Meteorologia, 2009, http:// bancodedados.cptec.inpe.br/climatologia/Controller. [58] R. R. Silva, C. R. F. Brand˜ao, and J. H. C. Delabie, “Formigas
Submit your manuscripts at
http://www.hindawi.com
Hindawi Publishing Corporation
http://www.hindawi.com Volume 2014
Anatomy
Research International
Hindawi Publishing Corporation
http://www.hindawi.com Volume 2014
Hindawi Publishing Corporation http://www.hindawi.com
International Journal of
Volume 2014
Zoology
Hindawi Publishing Corporation
http://www.hindawi.com Volume 2014 Molecular Biology International
Genomics
International Journal of
Hindawi Publishing Corporation
http://www.hindawi.com Volume 2014
The Scientific
World Journal
Hindawi Publishing Corporation
http://www.hindawi.com Volume 2014
Hindawi Publishing Corporation
http://www.hindawi.com Volume 2014
Bioinformatics
Advances inMarine Biology
Journal ofHindawi Publishing Corporation
http://www.hindawi.com Volume 2014 Hindawi Publishing Corporation
http://www.hindawi.com Volume 2014
Signal Transduction
Journal ofHindawi Publishing Corporation
http://www.hindawi.com Volume 2014 BioMed
Research International
Evolutionary Biology
International Journal of
Hindawi Publishing Corporation
http://www.hindawi.com Volume 2014
Hindawi Publishing Corporation
http://www.hindawi.com Volume 2014
Biochemistry Research International
Archaea
Hindawi Publishing Corporationhttp://www.hindawi.com Volume 2014
Hindawi Publishing Corporation
http://www.hindawi.com Volume 2014
Genetics
Research International
Hindawi Publishing Corporation
http://www.hindawi.com Volume 2014
Advances in
Virology
Hindawi Publishing Corporation http://www.hindawi.com
Nucleic Acids
Journal ofVolume 2014
Stem Cells
International
Hindawi Publishing Corporation
http://www.hindawi.com Volume 2014
Hindawi Publishing Corporation
http://www.hindawi.com Volume 2014
Enzyme
Research
Hindawi Publishing Corporation
http://www.hindawi.com Volume 2014