ACPD
15, 10389–10424, 2015Source attribution and process analysis
for atmospheric Hg
J. Zhu et al.
Title Page
Abstract Introduction
Conclusions References
Tables Figures
◭ ◮
◭ ◮
Back Close
Full Screen / Esc
Printer-friendly Version Interactive Discussion
Discussion
P
a
per
|
Discussion
P
a
per
|
Discussion
P
a
per
|
Discussion
P
a
per
|
Atmos. Chem. Phys. Discuss., 15, 10389–10424, 2015 www.atmos-chem-phys-discuss.net/15/10389/2015/ doi:10.5194/acpd-15-10389-2015
© Author(s) 2015. CC Attribution 3.0 License.
This discussion paper is/has been under review for the journal Atmospheric Chemistry and Physics (ACP). Please refer to the corresponding final paper in ACP if available.
Source attribution and process analysis
for atmospheric mercury in East China
simulated by CMAQ-Hg
J. Zhu1, T. Wang1, J. Bieser2,3, and V. Matthias2
1
School of Atmospheric Sciences, Nanjing University, Nanjing 210093, China
2
Institute of Coastal Research, Helmholtz-Zentrum Geesthacht, Max-Planck-Str. 1, 21502, Geesthacht, Germany
3
National aeronautics and space research center (DRL), Oberpfaffenhofen, 82234, Weßling, Germany
Received: 19 February 2015 – Accepted: 23 March 2015 – Published: 9 April 2015
Correspondence to: T. Wang ([email protected])
ACPD
15, 10389–10424, 2015Source attribution and process analysis
for atmospheric Hg
J. Zhu et al.
Title Page
Abstract Introduction
Conclusions References
Tables Figures
◭ ◮
◭ ◮
Back Close
Full Screen / Esc
Printer-friendly Version Interactive Discussion
Discussion
P
a
per
|
Discussion
P
a
per
|
Discussion
P
a
per
|
Discussion
P
a
per
|
Abstract
The contribution from different emission sources and atmospheric processes to gaseous elemental mercury (GEM), gaseous oxidized mercury (GOM), particulate bound mercury (PBM) and mercury deposition in East China were quantified using the Community Multi-scale Air Quality (CMAQ-Hg) modeling system run with nested
5
grid resolution of 27 km. Natural source (NAT) and six categories of anthropogenic mercury sources (ANTH) including cement production (CEM), domestic life (DOM), in-dustrial boilers (IND), metal production (MET), coal-fired power plants (PP) and traffic (TRA) were considered for source apportionment. NAT was responsible for 36.6 % of annual averaged GEM concentration which was regard as the most important source
10
for GEM in spite of obvious seasonal variation. Among ANTH, the influence of MET and PP on GEM were most evident especially in winter. ANTH dominated the vari-ations of GOM and PBM concentration with a contribution of 86.7 and 79.1 % re-spectively. Among ANTH, IND was the largest contributor for GOM (57.5 %) and PBM (34.4 %) so that most mercury deposition came from IND. The effect of mercury
emit-15
ted from out of China was indicated by>30 % contribution to GEM concentration and wet deposition. The contribution from nine processes consisting of emissions (EMIS), gas-phase chemical production/loss (CHEM), horizontal advection (HADV), vertical ad-vection (ZADV), horizontal adad-vection (HDIF), vertical diffusion (VDIF), dry deposition (DDEP), cloud processes (CLDS) and aerosol processes (AERO) were calculated for
20
processes analysis with their comparison in urban and non-urban regions of Yangtze River Delta (YRD). EMIS and VDIF affected surface GEM and PBM concentration most and tended to compensate each other all the time in both urban and non-urban ar-eas. However, DDEP was the most important removal process for GOM with 7.3 and 2.9 ng m−3reduced in the surface of urban and non-urban areas respectively in a whole
25
an-ACPD
15, 10389–10424, 2015Source attribution and process analysis
for atmospheric Hg
J. Zhu et al.
Title Page
Abstract Introduction
Conclusions References
Tables Figures
◭ ◮
◭ ◮
Back Close
Full Screen / Esc
Printer-friendly Version Interactive Discussion
Discussion
P
a
per
|
Discussion
P
a
per
|
Discussion
P
a
per
|
Discussion
P
a
per
|
thropogenic mercury transported and diffused away from urban area by HADV and VDIF and made gain of mercury in non-urban areas by HADV. Natural emissions only influenced CHEM and AERO more significantly than anthropogenic. Local emission in the YRD contributed 8.5 % more to GEM and∼30 % more to GOM and PBM in urban areas compared to non-urban areas.
5
1 Introduction
Mercury (Hg) pollution in the atmosphere attracts increasing concern globally in view of its neurotoxicity and bioaccumulation in along the food chain posing risks to hu-man health (Schroeder and Munthe, 1998; Rolfhus et al., 2003). According to various physical and chemical properties, atmospheric mercury is divided into three species:
10
gaseous elemental mercury (GEM), gaseous oxidized mercury (GOM) and particulate bound mercury (PBM). GEM is the predominant form (>95 %) in atmosphere which is very stable and well-mixed hemispherically with a long lifetime of 0.5–2 years (Selin et al., 2007). In contrast, GOM and PBM will deposit more rapidly downwind of their emission sources via wet or dry deposition since GOM and PBM have significantly
15
higher reactivity, deposition velocities, and water solubility (Lin and Pehkonen, 1999; Lindberg et al., 2002; Keeler et al., 2005). Accordingly, mercury is a multi-scale pollu-tant able to be transported at local, regional and long scale distances from the sources and mercury emission speciation has a great impact on processes and spatial distri-bution of mercury in the atmosphere (Bieser et al., 2014; Quan et al., 2009; Voudouri
20
and Kallos, 2007; Pai et al., 1999).
Mercury is released into the atmosphere from both natural processes and anthro-pogenic activities. Natural processes such as evasion from soils, water bodies and vegetation just emit GEM with evident seasonal variation (Shetty et al., 2008). The natural sources will also include re-emission of anthropogenic mercury deposited into
25
ACPD
15, 10389–10424, 2015Source attribution and process analysis
for atmospheric Hg
J. Zhu et al.
Title Page
Abstract Introduction
Conclusions References
Tables Figures
◭ ◮
◭ ◮
Back Close
Full Screen / Esc
Printer-friendly Version Interactive Discussion
Discussion
P
a
per
|
Discussion
P
a
per
|
Discussion
P
a
per
|
Discussion
P
a
per
|
mining (Streets et al., 2009). Anthropogenic mercury emissions in Asia are the high-est in the world, accounting for about half of the global total (Pacyna et al., 2010). Especially, China is considered as one of the largest and growing source regions due to its rapid economic and industrial growth along with a coal-dominated energy struc-ture (Wu et al., 2006; Wang et al., 2014). Particularly high emissions of mercury in
5
China result in more elevated mercury concentration and larger mercury deposition than background levels in the world even in remote areas such as the Mt. Gongga area (Fu et al., 2008) and Mt. Changbai (Wan et al., 2009). Much more serious atmospheric mercury pollution was detected in Chinese urban sites where total gaseous mercury (TGM) concentrations were a factor of 3–5 higher than those observed in rural areas
10
(Zhu et al., 2012; Chen et al., 2013; Feng et al., 2004). Therefore, improving the un-derstanding of the source-receptor relationships for mercury and providing valuable information on mercury transport, deposition and chemistry within China are urgently needed. Detailed quantitative assessments of the contribution of mercury sources help to determine effective mercury emission control strategies.
15
Previous publications provided contribution estimates from selected emission sources mostly in the United States (Seigneur et al., 2004; Selin and Jacob, 2008; Lin et al., 2012) and the Great Lakes (Cohen et al., 2004; Holloway et al., 2012) us-ing global and regional chemical transport models. Many studies for Asia focus on the mercury mass outflow caused by the total emission in Asia and its contribution to long
20
range transport (Pan et al., 2010; Lin et al., 2010). Limited source apportionment of mercury pollution in China has been studied by Wang et al. (2014) distinguishing four emission sectors using a global model (GEOS-Chem) in coarse spatial resolution. In addition, few studies focus on diagnostic and process analysis for atmospheric mercury pollution formation and identification of the dominant atmospheric processes for
mer-25
simu-ACPD
15, 10389–10424, 2015Source attribution and process analysis
for atmospheric Hg
J. Zhu et al.
Title Page
Abstract Introduction
Conclusions References
Tables Figures
◭ ◮
◭ ◮
Back Close
Full Screen / Esc
Printer-friendly Version Interactive Discussion
Discussion
P
a
per
|
Discussion
P
a
per
|
Discussion
P
a
per
|
Discussion
P
a
per
|
lated concentration. The performance of CMAQ-Hg model in simulating mercury has been evaluated against mercury concentration and deposition measured on surface mostly in US (Holloway et al., 2012; Bullock Jr. et al., 2008, 2009; Gbor et al., 2006, 2007).
In this paper, the temporal and spatial distribution of atmospheric mercury and its
5
deposition in 2011 were simulated on a nested domain over East China with grid res-olution of 27×27 km2 using CMAQ-Hg. The model results were compared to avail-able monitoring data. Seasonal contributions of all types of mercury emission sources, including natural emissions, cement plants, domestic coal burning, industrial boilers, metal productions, power plants and traffic emissions, to atmospheric mercury
concen-10
tration and deposition were quantified. The process analysis for atmospheric mercury concentration was used for select urban and non-urban areas. The influence of physical and chemical processes on mercury concentration was examined. This study provides a detailed model study on source apportionment and process analysis of atmospheric mercury in East China.
15
2 Methods
2.1 Model descriptions
The model used in this study was based on CMAQ v4.6 which has been modified by Bullock Jr. and Brehme (2002) and Gbor et al. (2006) to include chemistry, transport and deposition of GEM, GOM and PBM. The model was configured to use the Carbon
20
Bond 5 (CB05) gaseous phase chemistry mechanism (Sarvar et al., 2008) with Euler Backward Iterative (EBI) solver and the AERO4 aerosol mechanism (Binkowski and Roselle, 2002). The CB05 mechanism used here included mercury gaseous reactions with ozone, OH, H2O2and Cl2 as described by Lin and Tao (2003). The meteorologi-cal fields used in CMAQ-Hg were provided by the Weather Research and Forecasting
25
ACPD
15, 10389–10424, 2015Source attribution and process analysis
for atmospheric Hg
J. Zhu et al.
Title Page
Abstract Introduction
Conclusions References
Tables Figures
◭ ◮
◭ ◮
Back Close
Full Screen / Esc
Printer-friendly Version Interactive Discussion
Discussion
P
a
per
|
Discussion
P
a
per
|
Discussion
P
a
per
|
Discussion
P
a
per
|
the WRF outputs to the CMAQ-Hg model-ready format and dry deposition velocities of GEM and GOM were calculated. The process analysis (PA) technique is an advanced diagnostic method implemented in CMAQ. It provides hourly integrated process rates to quantify the changes in concentration from each of the scientific processes in the mass conservation equations being solved for each mercury species. During this
sim-5
ulation, the contributions from following physical and chemical processes were calcu-lated: emissions of mercury species (EMIS), net gas-phase chemical production/loss (CHEM), horizontal advection (HADV), vertical advection (ZADV), horizontal diffusion (HDIF), vertical diffusion (VDIF), dry deposition (DDEP), cloud processes (CLDS, in-cluding cloud attenuation of photolytic rates, convective and non-convective mixing and
10
scavenging by clouds, aqueous-phase chemistry, and wet deposition), aerosol pro-cesses (AERO, including thermodynamic equilibrium and dynamics such as homoge-neous nucleation, condensation/evaporation, and coagulation) (Liu and Zhang, 2013).
2.2 Emission inventory
Both anthropogenic and natural emission inventories of mercury were employed in our
15
simulation with CMAQ-Hg. Emissions from natural sources (NAT) including vegetation, soil surface and water bodies were based on the estimates by Shetty et al. (2008). GEM is the only species emitted from natural sources. Secondary emissions that re-sulted from deposited mercury transformed to GEM and re-emitted to the atmosphere from soil and water were also considered. Anthropogenic mercury emissions in China
20
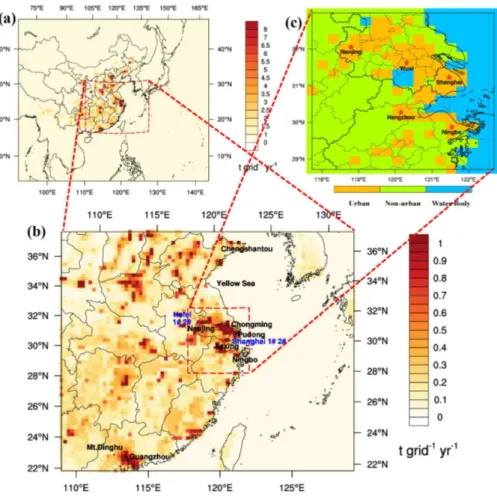
were prepared following the approaches of Wang et al. (2014), which were updated to 2007 (Fig. 1a). The inventory data were not consistent with our modeling period, but represented the most updated data at the time when this study was conducted. The monthly variation of anthropogenic sources was based on the monthly energy con-sumption and product yields published in the Chinese yearbook of provincial diversity.
25
con-ACPD
15, 10389–10424, 2015Source attribution and process analysis
for atmospheric Hg
J. Zhu et al.
Title Page
Abstract Introduction
Conclusions References
Tables Figures
◭ ◮
◭ ◮
Back Close
Full Screen / Esc
Printer-friendly Version Interactive Discussion
Discussion
P
a
per
|
Discussion
P
a
per
|
Discussion
P
a
per
|
Discussion
P
a
per
|
trol devices (Wang et al., 2014). The total anthropogenic mercury sources (ANTH) in China were classified into six categories for source apportionment: (1) emission from cement production (CEM), (2) emission from domestic life (DOM), which includes waste incineration, domestic coal burning and application of battery and fluorescent lighting, (3) emission from industrial boilers (IND) including boilers used for collective
5
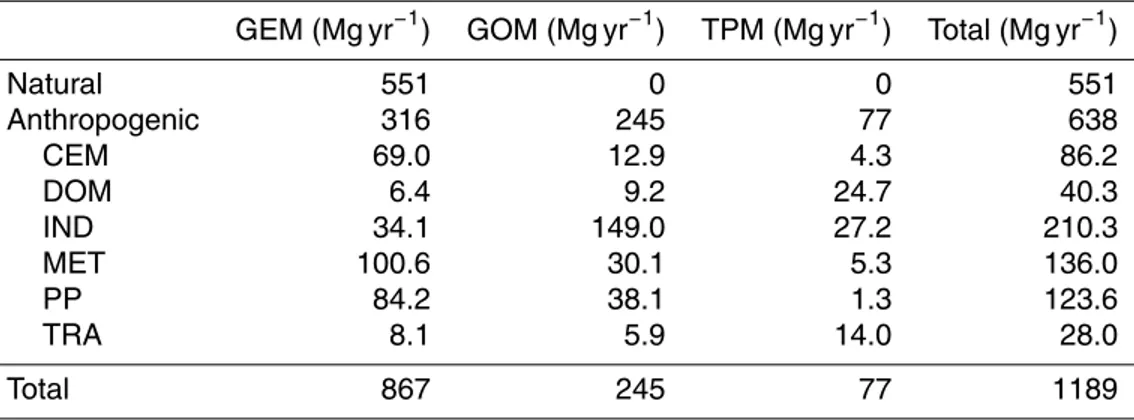
heating in North China during winter, (4) emission from metal production (MET) includ-ing zinc smelters, lead smelters, copper smelters, iron production, mercury production and gold production, (5) emissions from coal-fired power plants (PP), which were all treated as large point sources in our simulation, (6) emission from traffic (TRA). Table 1 summarizes the emission inventory for China (land area in the outermost model
do-10
main) in 2007. The annual total anthropogenic emissions amount to 638 Mg yr−1which
was comparable to natural emissions of 551 Mg yr−1. The average speciation of
anthro-pogenic emissions is as follows: (GEM 49.5 %, GOM 38.4 %, and PBM 12.1 %).
2.3 Model domain and scenarios
The modeling period comprises one year from 20 December 2010 to 31
Decem-15
ber 2011 including an 11 days spin-up period. Two nested domains were used for CMAQ-Hg model. The first domain (D01, Fig. 1a) covers most of China and some other parts of Asia with 85×72 horizontal grid cells at a spatial resolution of 81 km×81 km. The initial and boundary condition for D01 modeling were extracted from GEOS-Chem global simulation results. The nested domain (D02, Fig. 1b) was defined over East
20
China area which is the focus of this study. D02 contains 82×67 horizontal grids with a spatial resolution of 27 km×27 km. There were 27 vertical layers with a top layer pressure of 100 hPa for both domains. The Yangtze River Delta (YRD) (Fig. 1c) is one of the most industrialized and urbanized regions in East China and mercury pollution has become a problem of increasing concern, thus the YRD was chosen for process
25
ACPD
15, 10389–10424, 2015Source attribution and process analysis
for atmospheric Hg
J. Zhu et al.
Title Page
Abstract Introduction
Conclusions References
Tables Figures
◭ ◮
◭ ◮
Back Close
Full Screen / Esc
Printer-friendly Version Interactive Discussion
Discussion
P
a
per
|
Discussion
P
a
per
|
Discussion
P
a
per
|
Discussion
P
a
per
|
processes influencing atmospheric mercury species in urban and non-urban area was conducted in this study.
Nine emission scenarios in China were considered to understand the relative impor-tance of different emission sources to atmospheric mercury concentration and deposi-tion. The base case (BASE) was run with both natural and all anthropogenic sources
5
mentioned above. Seven sensitivity studies (C1–C7) each with one of six anthro-pogenic source sectors (i.e. CEM, DOM, IND, MET, PP and TRA) or natural emissions (NAT) excluded were designed. In addition, the boundary conditions (BC) were set to zero (C8). Subtracting the results of C1–C8 from the BASE case yields an estimate of mercury associated with these mercury sources.
10
3 Results and discussion
3.1 Model validation
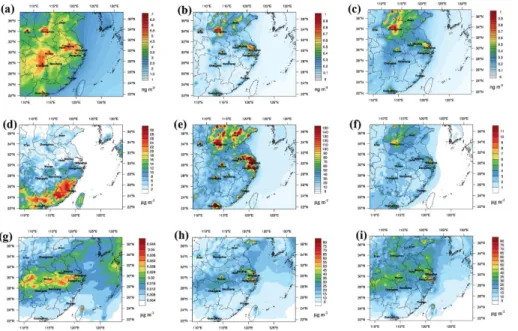
The spatial distribution of annual average concentration and annual total deposition of GEM, GOM and PBM simulated in BASE were shown in Fig. 2. The predicted an-nual average concentration of GEM, GOM and PBM were in the ranges of 1.8–8.4,
15
0.015–1.5 and 0.017–1.3 ng m−3. On average, GEM constituted 92.8 % of the total
at-mospheric mercury with the contribution going down to a minimum of 58.6 % near large anthropogenic sources (Fig. 2a). The concentration of GOM and PBM was typi-cally greater at locations of large cities due to the larger anthropogenic emission there and decreased rapidly away from source locations because of their relatively shorter
20
atmospheric lifetimes (Fig. 2b, c). The total mercury deposition was 65.3 µg m−2yr−1
with 34.3 µg m−2yr−1 of total dry deposition and 31.0 µg m−2yr−1 of total wet
deposi-tion. The dry deposition of GEM was 4.26 µg m−2yr−1 on average with the larger
de-position in the southern part of D02 due to the larger dry dede-position velocity of GEM there (Fig. 2d). GOM contributed 28.2 µg m−2yr−1 to total dry deposition with a range
25
ACPD
15, 10389–10424, 2015Source attribution and process analysis
for atmospheric Hg
J. Zhu et al.
Title Page
Abstract Introduction
Conclusions References
Tables Figures
◭ ◮
◭ ◮
Back Close
Full Screen / Esc
Printer-friendly Version Interactive Discussion
Discussion
P
a
per
|
Discussion
P
a
per
|
Discussion
P
a
per
|
Discussion
P
a
per
|
The distribution of the dry deposition of GOM and PBM resembled the spatial pattern of urban area in East China as a result of high concentration of GOM and PBM there, especially showing the elevated deposition in the eastern (i.e. YRD) and northern part of D02 (Fig. 2e and f). The wet deposition was dominated by PBM (56.5 %) followed by GOM (43.4 %). The distribution of wet deposition was affected by the spatial
pat-5
tern of concentration and precipitation (Fig. 2h and i). The wet deposition of GEM was negligible due to its low solubility in water (Fig. 2g).
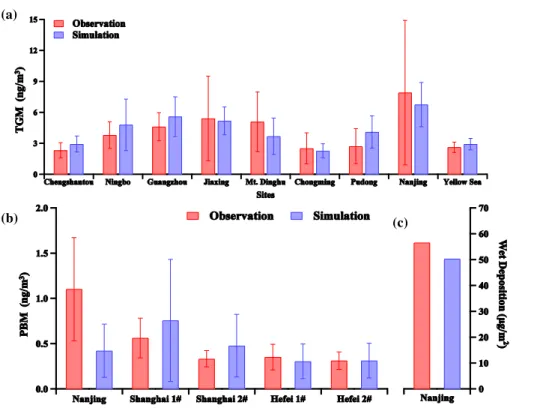
The results from the base case were compared to observations to give a preliminary evaluation of model performance. As long-term mercury measurements in East China are very limited, all available measurement results (listed in Zhu et al., 2012, 2014) in
10
East China were used to assess model skill, of which TGM concentrations were ob-tained in nine sites, PBM concentrations were obob-tained in five sites and wet deposition was only observed in Nanjing. The locations of these sites are given in Fig. 1b. Although the analysis in the following sections uses the model results for 2011, the same time-frame with observations reported was simulated for model validation. Figure 3 shows
15
the comparison between averaged measurements and CMAQ results during homolo-gous months. Most sites such as Chengshantou (Ci et al., 2011a), Ningbo (Nguyen et al., 2011), Guangzhou (Chen et al., 2013), Jiaxing (Wang et al., 2007), Mt. Dinghu (Chen et al., 2013), Chongming (Dou et al., 2013), Nanjing (Zhu et al., 2012) and Yel-low Sea (Ci et al., 2011b), the simulated TGM is quite consistent with observations
20
with relative bias of 4–28 % (Fig. 3a). In comparison, modeled TGM concentrations in Pudong were ∼51 % overestimated. The site in Pudong (Friedli et al., 2011) was lo-cated at a costal urban area with less than one month measurement data. The short duration of this measurement and unexpected complex emission and meteorological condition may be responsible for the larger bias. The correlation coefficient between
25
ACPD
15, 10389–10424, 2015Source attribution and process analysis
for atmospheric Hg
J. Zhu et al.
Title Page
Abstract Introduction
Conclusions References
Tables Figures
◭ ◮
◭ ◮
Back Close
Full Screen / Esc
Printer-friendly Version Interactive Discussion
Discussion
P
a
per
|
Discussion
P
a
per
|
Discussion
P
a
per
|
Discussion
P
a
per
|
is expected to be the incapability of the model to capture emission plumes and predict the transient peaks observed in urban sites because of the 27 km grid cell resolution and assumption of instantaneous emission dilution in grid cells (Pongprueksa et al., 2008). As seen in Fig. 3b, the model results were also comparable to PBM concen-tration observed in Nanjing (Zhu et al., 2014), Shanghai (Xiu et al., 2009) and Hefei
5
(Wang, 2010). PBM concentration in Nanjing was underestimated by 60 % which may be because the location of the observation site in Nanjing is in the central urban area with much higher particle concentration compared to the averaged concentration in the simulation grid cell. The scarcity of mercury deposition measurement in East China limited the evaluation of model performance for mercury deposition. Our model result
10
agrees reasonably well with mercury wet deposition measurement result in Nanjing site during 9 months in 2011 (Zhu et al., 2014) with 6.3 µg m−2underestimated which
was caused by 232.8 mm (21.8 % to total) less precipitation predicted. Overall, our sim-ulation did well in reflecting the levels and deposition of atmospheric mercury in East China and it is suitable for further analysis of source apportionment.
15
3.2 Source apportionment
3.2.1 Natural sources (NAT)
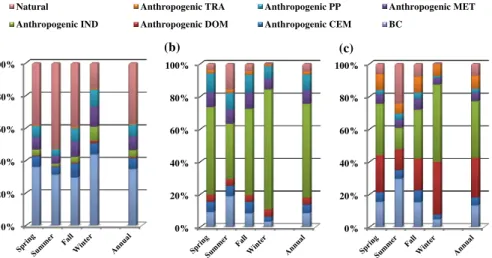
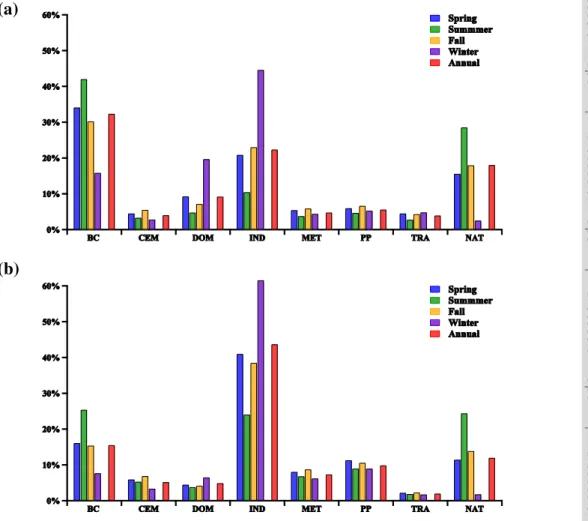
Figures 4 and 5 summarize annual and seasonal relative contribution of different source sectors to atmospheric mercury concentration and deposition in East China (land area in D02). Annual total mercury emissions from natural sources were close
20
to those from anthropogenic sources. Because all natural emissions are in the form of GEM, this sector is responsible for 63.6 % of the total annual GEM emission in China. The result was that natural sources are the largest contributor to atmospheric GEM concentration (36.6 % in annual average). Due to significant seasonal variation of GEM emission from NAT, the contribution from NAT to GEM varied between 52.2 %
25
ACPD
15, 10389–10424, 2015Source attribution and process analysis
for atmospheric Hg
J. Zhu et al.
Title Page
Abstract Introduction
Conclusions References
Tables Figures
◭ ◮
◭ ◮
Back Close
Full Screen / Esc
Printer-friendly Version Interactive Discussion
Discussion
P
a
per
|
Discussion
P
a
per
|
Discussion
P
a
per
|
Discussion
P
a
per
|
was not the key species for mercury deposition, NAT still made an evident contribution to wet and dry deposition in summer with 28.5 and 24.3 % respectively. That was be-cause of higher emission quantity of NAT and the increased photochemical activities in summer that led to a greater degree of GEM oxidation to GOM and transformation to PBM, which contributed 15.7 % of GOM and 24.2 % of PBM in summer. In contrast,
5
NAT contributes little to GOM concentration (0.2 %), PBM concentration (0.3 %) and deposition (2.4 % to wet deposition and 1.7 % to dry deposition) in winter. Therefore, during winter, ANTH had a much larger impact on atmospheric mercury concentration and deposition. The effect from NAT was descending from south to north in mainland of D02, correlating with air temperature. There was no obvious difference between the
10
quantities contributed from NAT to urban and rural areas but the relative contribution to urban areas was lower due to higher emissions and thus concentration and deposition in urban areas.
3.2.2 Cement production (CEM)
In 2011, anthropogenic sources emitted 638 Mg of mercury which was a little more than
15
that from natural sources (551 Mg yr−1). However, unlike natural sources, mercury from
ANTH includes GEM, GOM and PBM. The quantity and speciation of mercury released from six anthropogenic source categories were quite different. This leads to different impacts on the spatial and temporal distribution of atmospheric mercury concentration and deposition.
20
Total mercury emission from CEM is responsible for 13.5 % of the total anthropogenic emissions and∼80 % of the mercury from CEM was in the form of GEM. CEM con-tributed 6.6 % to the total annual GEM concentration which was 23.9 % of the total contribution from all anthropogenic sources. The impact on GOM and PBM concentra-tion from CEM was much lower than that of most other anthropogenic sources. As GEM
25
ACPD
15, 10389–10424, 2015Source attribution and process analysis
for atmospheric Hg
J. Zhu et al.
Title Page
Abstract Introduction
Conclusions References
Tables Figures
◭ ◮
◭ ◮
Back Close
Full Screen / Esc
Printer-friendly Version Interactive Discussion
Discussion
P
a
per
|
Discussion
P
a
per
|
Discussion
P
a
per
|
Discussion
P
a
per
|
year. CEM affected the GEM concentration in the eastern coastal area most evidently with up to 20 % because of the large emissions from cement plants in the Shandong, Jiangsu and Zhejiang provinces which are responsible for∼26 % of the total emissions from CEM in China.
3.2.3 Industrial boilers (IND)
5
Emissions of total mercury from IND made up 32.9 % of all anthropogenic emissions in China. Thus, it is the most important anthropogenic source. Moreover, 70.8 % of the total mercury emitted from IND was GOM which makes up 60.8 % of the total GOM emissions in China. Moreover, IND was also the largest source of PBM in China. Owing to the large quantity of GOM and PBM which can deposit near the emission
10
sources through dry and wet deposition, IND makes the largest contribution to mercury deposition with 22.3 and 43.6 % to annual wet and dry deposition corresponding to 57.5 and 34.4 % contribution to annual averaged GOM and PBM concentration. Especially in winter, IND dominated the GOM concentration and mercury dry deposition with the contribution reaching 73.3 and 63.9 % respectively as a result of large-scale collective
15
heating in northern China.
3.2.4 Power plants (PP)
Emissions from PP were another important sector and they were treated as point sources in the model. GEM and GOM are the main species emitted from PP with a per-centage of 68.1 and 30.8 % and, in contrast, with only 1.1 % of PBM. PP was the
small-20
est contributor (2.5 %) to PBM. However, PP was the second largest contributor to GEM and GOM concentration (7.1 and 9.6 % respectively) among all anthropogenic sources, although its contribution to GOM concentration was much lower than the largest GOM sources of IND. Emissions from PP were responsible for 5.5 and 9.8 % of wet and dry deposition which resulted from significant impact on GOM concentration. There were
25
ACPD
15, 10389–10424, 2015Source attribution and process analysis
for atmospheric Hg
J. Zhu et al.
Title Page
Abstract Introduction
Conclusions References
Tables Figures
◭ ◮
◭ ◮
Back Close
Full Screen / Esc
Printer-friendly Version Interactive Discussion
Discussion
P
a
per
|
Discussion
P
a
per
|
Discussion
P
a
per
|
Discussion
P
a
per
|
in the YRD. Because of this, obviously higher emission intensity from PP led to a much higher influence to atmospheric mercury pollution in the YRD with an annual averaged contribution to TGM of up to 1 ng m−3(>20 %).
3.2.5 Metal production (MET)
MET was the largest anthropogenic source of GEM accounting for 31.8 % of the
an-5
thropogenically emitted GEM. As this sector includes manufacturers and smelters of various iron and non-iron metals, the content of mercury from MET varied greatly de-pending on production process and the mercury content in raw materials. The speci-ation factors ranged from 65 to 89 % for GEM, 6 to 30 % for GOM, and 0 to 17 % for PBM. Overall, MET contributed 8.4, 8.2 and 5.0 % to GEM, GOM and PBM
concentra-10
tion and was responsible for 4.7 and 7.2 % of the annual wet and dry deposition in East China respectively. Although MET was distributed widely in East China, the effects of emissions from MET were greatest in Shaanxi Province due to high mercury concen-trations in zinc ore and some small scale plants with poor mercury control devices (Wu et al., 2012).
15
3.2.6 Domestic life (DOM) and traffic emission (TRA)
Emissions from DOM (6.3 %) and TRA (4.4 %) were the small fraction of anthropogenic sources. They both hardly affected GEM concentration with a contribution of less than 1 % and had little influence on GOM concentration (4.4 % from DOM and 1.8 % from TRA). However, over 50 % of total PBM emission came from DOM and TRA and they
20
increased the annual averaged PBM concentration by 24.4 and 8.0 % respectively. As PBM was the main component in mercury wet deposition, DOM was the most important anthropogenic contributor (9.1 %) to wet deposition except IND (22.3 %). In contrast, DOM and TRA were the two smallest contributors to mercury dry deposition with the proportion of 4.8 and 1.9 % because GOM was the dominant contributor to mercury
25
ACPD
15, 10389–10424, 2015Source attribution and process analysis
for atmospheric Hg
J. Zhu et al.
Title Page
Abstract Introduction
Conclusions References
Tables Figures
◭ ◮
◭ ◮
Back Close
Full Screen / Esc
Printer-friendly Version Interactive Discussion
Discussion
P
a
per
|
Discussion
P
a
per
|
Discussion
P
a
per
|
Discussion
P
a
per
|
the majority emitted in large cities. In spite of the lower total emissions from TRA, the impacts on PBM concentration and deposition were much higher in and around the province capitals and other large cities by a factor of 2–20 compared to rural areas.
3.2.7 Long-range transport (BC)
The impacts of boundary conditions (BC) were also significant for mercury pollution
5
in East China, which indicates the contribution of mercury emission from other source regions. GEM can be transported far beyond the regions where it is emitted and it is hardly deposited. Therefore, GEM in the global mercury pool affected the concentration in China evidently suggested by our simulation result with up to 34.3 % annual averaged GEM concentration from BC. However, BC have little effect on GOM concentration with
10
a contribution of only 8.6 % because of its relatively short lifetime. The contribution to GEM concentration from BC was largest in winter while the contribution was least to GOM concentration then because of relatively weaker emissions of GEM and stronger emission of GOM in China during winter. BC influenced the annual averaged PBM concentration by 13.3 % due to the low dry deposition velocity of fine size PBM. As PBM
15
was removed mainly by wet deposition, BC contributed 32.3 % to annual wet deposition of mercury in China. In comparison, only 15.4 % of annual dry deposition was linked to BC owing to the small contribution to GOM. Lin et al. (2012) estimated that 89.1 % of mercury dry deposition and 93.2 % of mercury wet deposition in contiguous US regions are caused by global sources, which is much higher than that ratio estimated for East
20
China in this study. The reason for this is the much higher local anthropogenic emission of mercury in China.
3.3 Process analysis
Figure 2 depicts the simulated concentration and deposition of mercury species during 2011 in East China, which indicated that the Yangtze River Delta (YRD) is one of most
25
ACPD
15, 10389–10424, 2015Source attribution and process analysis
for atmospheric Hg
J. Zhu et al.
Title Page
Abstract Introduction
Conclusions References
Tables Figures
◭ ◮
◭ ◮
Back Close
Full Screen / Esc
Printer-friendly Version Interactive Discussion
Discussion
P
a
per
|
Discussion
P
a
per
|
Discussion
P
a
per
|
Discussion
P
a
per
|
of the most active areas of human activity in China. Therefore, the YRD area which is shown in Fig. 1c was chosen to study the influence of each physical and chemical process implemented in CMAQ on atmospheric mercury. The area was divided into urban, non-urban and water body depends on the predominant land use. The area with urban coefficient of land use more than 10 % was defined as urban area in this study.
5
Comparisons of the contribution of each process to urban and non-urban mercury concentrations were studied.
3.3.1 Controlling processes
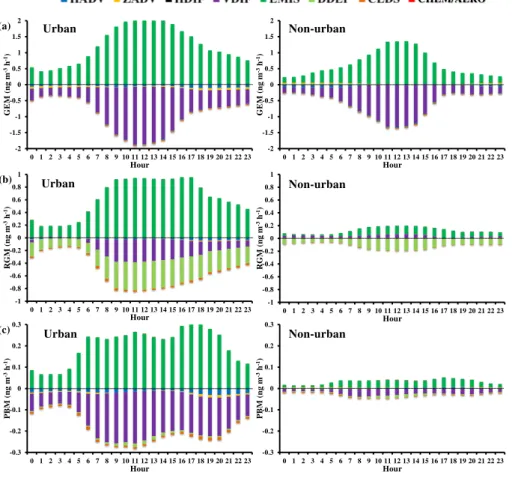
The annual averaged diurnal variations of the contribution from nine processes which included horizontal advection (HADV), vertical advection (ZADV), horizontal diffusion
10
(HDIF), vertical diffusion (VDIF), emissions (EMIS), dry deposition (DDEP), cloud physics and scavenging (CLDS) and gas and aerosol phase chemistry (CHEM/AERO) to the concentration of GEM, GOM and PBM in the near-surface layer (the first layer in model which was about 50 m) in urban and non-urban areas of the YRD are shown in Fig. 6. The results indicate that two major processes dominate surface GEM
concen-15
tration, namely EMIS and VDIF and their contributions were comparable in urban and non-urban area (Fig. 6a). The contributions of EMIS and VDIF to the change of GEM concentration were noticeably temporally variable with much higher values during mid-day which was a factor of>5 larger than that at night and they tended to compensate each other all of the time. The effect of EMIS extended gradually in daytime along with
20
the increase of temperature and solar radiation which led to higher emission from NAT. Anthropogenic activity and production are more active during day time which raised the emissions of mercury, especially in urban area. EMIS was the only processes with a positive contribution to GEM concentration in urban areas with annual average of 1.26 ng m−3h−1and other processes all played the opposite role. However, HADV and
25
ACPD
15, 10389–10424, 2015Source attribution and process analysis
for atmospheric Hg
J. Zhu et al.
Title Page
Abstract Introduction
Conclusions References
Tables Figures
◭ ◮
◭ ◮
Back Close
Full Screen / Esc
Printer-friendly Version Interactive Discussion
Discussion
P
a
per
|
Discussion
P
a
per
|
Discussion
P
a
per
|
Discussion
P
a
per
|
ZADV had the opposite effect with a positive influence in non-urban and a negative in urban areas at night possibly because of the strong heat island circulation. Processes of DDEP and CLDS made small contributions to the loss of GEM. On average, they re-duced the concentration of GEM by about 0.8 ng m−3per day in urban and non-urban
areas.
5
Unlike GEM, the contributions from different processes on surface GOM and PBM concentrations were much lower in non-urban than that in urban areas due to lower emissions of GOM and PBM in non-urban areas (Fig. 6b and c). EMIS and VDIF were also the dominant processes to change surface GOM and PBM concentrations similar to GEM. However, DDEP and CLDS were two additional dominant processes
influenc-10
ing GOM and PBM because of higher dry deposition velocity and reactivity of GOM and PBM. Particularly for GOM, DDEP was the most important removal process with the surface concentration of 7.3 and 2.9 ng m−3reduced in urban and non-urban area
respectively in a whole day. Local dry deposition of GOM was about 48 % of local emis-sions in urban areas while that in non-urban areas was 42 % larger than local emisemis-sions
15
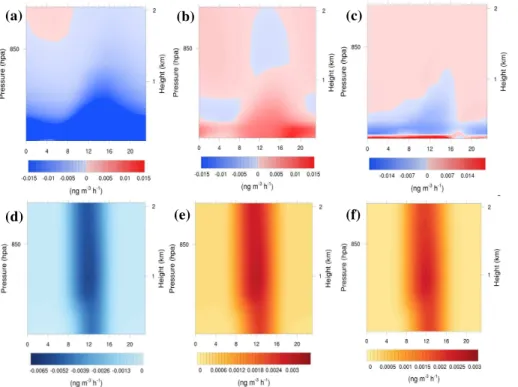
which was affected by the emissions from nearby urban areas. In addition, VDIF could contribute to gain of surface GOM in non-urban area in most hours, which indicated higher GOM concentrations in the free troposphere. Figure 7 displays diurnal profiles of the variation of HADV, VDIF, CHEM and AERO below 2 km. HADV played almost opposite roles in changing GOM concentration within the boundary layer in urban and
20
non-urban areas (Fig. 7a and b), but the trend of temporal variation and magnitude of contribution were about the same. It further indicated the transport of GOM from urban to non-urban areas which was the main source of GOM in upper air of non-urban ar-eas. The contribution of VDIF to the GOM concentration is displayed in Fig. 7c. More horizontally advected GOM aloft was mixed downwards to ground levels along with
25
ACPD
15, 10389–10424, 2015Source attribution and process analysis
for atmospheric Hg
J. Zhu et al.
Title Page
Abstract Introduction
Conclusions References
Tables Figures
◭ ◮
◭ ◮
Back Close
Full Screen / Esc
Printer-friendly Version Interactive Discussion
Discussion
P
a
per
|
Discussion
P
a
per
|
Discussion
P
a
per
|
Discussion
P
a
per
|
be negligible to change GOM and PBM concentration in the surface layer. Figure 7d–f show that the contributions of CHEM and AERO were much higher in the upper layers than that at surface especially around noon since most of mercury chemical reactions rely on solar radiation. CHEM and AERO are the most important processes to trans-form GEM to GOM and PBM in the atmosphere. Within 2 km upon non-urban areas,
5
the column concentration of GOM was increased by 41.9 ng m−2owing to the
transfor-mation of GEM through CHEM and the column concentration of PBM was enhanced by 29.1 ng m−2 through AERO in a whole day. The enhancements of GOM and PBM
through CHEM and AERO in urban area was about 13 % less than that in non-urban area. A combination of HADV, ZADV, VDIF, DDEP and CLDS tended to cancel out
10
the gain of PBM from EMIS and AERO in urban area. In spite of most decrease from VDIF in urban area, the other four processes also make 21 % contribution to remove surface PBM. However, both of HADV and ZADV transported PBM to surface layer in non-urban areas. The strongest increase of surface PBM occurred in the afternoon at 16–18 h due to higher emission rates of DOM and TRA which were the most important
15
source for PBM while most of the decrease occurred in the morning between 9–11 h because the VDIF process was most effective then. In urban areas, the contribution from DDEP to PBM was 20 % less than that from CLDS. In comparison, DDEP made 57 % more contribution than CLDS to the loss of surface PBM in non-urban areas. The contribution from HDIF was negligible for all of GEM, GOM and PBM concentrations.
20
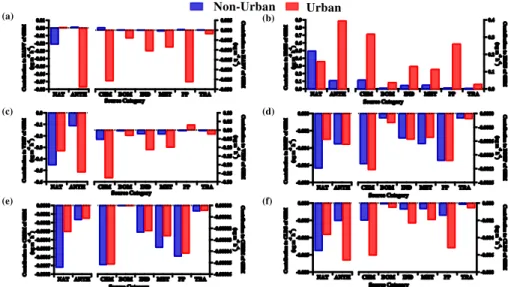
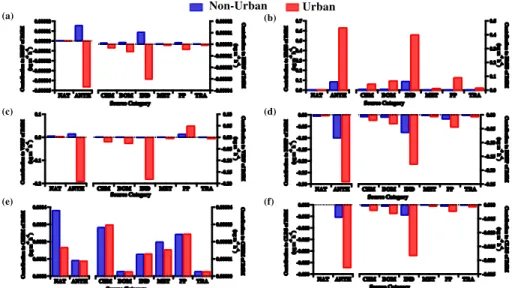
3.3.2 Impacts of sources on processes
Different mercury emission sources had different influences on processes due to the different distribution and intensity of emission sources. The contributions of natural sources and various anthropogenic sources to GEM processes in urban and non-urban areas of the YRD are compared in Fig. 8. Various anthropogenic sources, especially
25
CEM and PP, were the main sources leading to GEM advection out of urban areas with 0.077 ng m−3h−1by HADV while natural sources mainly caused GEM to be horizontally
ACPD
15, 10389–10424, 2015Source attribution and process analysis
for atmospheric Hg
J. Zhu et al.
Title Page
Abstract Introduction
Conclusions References
Tables Figures
◭ ◮
◭ ◮
Back Close
Full Screen / Esc
Printer-friendly Version Interactive Discussion
Discussion
P
a
per
|
Discussion
P
a
per
|
Discussion
P
a
per
|
Discussion
P
a
per
|
a similar contribution to DDEP and CHEM of GEM in both non-urban and urban areas. In comparison, natural sources affected DDEP and CHEM of GEM >110 % more in non-urban than urban areas though emission from NAT in non-urban area only 38 % more than that in urban area (Fig. 8d, e). Conversely, NAT caused comparable loss of GEM by VDIF in both areas and ANTH influenced VDIF of GEM in urban areas much
5
more evidently (Fig. 8c). In the YRD, emissions of GEM mostly came from CEM and PP which contributed locally to GEM concentrations with 0.32 and 0.27 ng m−3h−1 in
urban areas. More than 80 % of the GEM emissions in non-urban areas were emitted by natural sources (Fig. 8b). Totally, local emission in the YRD contributed 37.2 % to the annual averaged GEM concentration in non-urban and 45.7 % to that in urban areas.
10
Local emissions in the YRD were the primary source for GOM and PBM concentra-tion with a contribuconcentra-tion of 74.8 % (92.9 %) to GOM concentraconcentra-tion and 44.0 % (66.0 %) to PBM concentration in non-urban (urban) area respectively. As GOM and PBM were the main constituents of mercury deposition, local emission in the YRD contributed 65.1 % (88.7 %) to the annual mercury dry deposition and 37.3 % (56.2 %) to
mer-15
cury wet deposition in non-urban (urban) of YRD area. Obviously, local emissions have a larger influence on mercury concentration and deposition in urban areas. However, local emissions also were the most important factor for mercury pollution in non-urban areas. Figures 9 and 10 show the contribution from different sources on the various processes of GOM and PBM in two areas. Natural sources only affected CHEM and
20
AERO especially in non-urban areas significantly compared to anthropogenic sources (Fig. 9e, 10e). IND was the largest contributor to all processes of GOM except for CHEM (Fig. 9) while DOM contributed most to all processes of PBM besides of AERO (Fig. 10). All anthropogenic sources increased the outflow of GOM and PBM from ur-ban areas and enhanced the inflow into non-urur-ban areas. Moreover, the quantity of
25
ACPD
15, 10389–10424, 2015Source attribution and process analysis
for atmospheric Hg
J. Zhu et al.
Title Page
Abstract Introduction
Conclusions References
Tables Figures
◭ ◮
◭ ◮
Back Close
Full Screen / Esc
Printer-friendly Version Interactive Discussion
Discussion
P
a
per
|
Discussion
P
a
per
|
Discussion
P
a
per
|
Discussion
P
a
per
|
the surface GOM concentration by VDIF, which was because the emissions from PP was mostly in the free troposphere and formed a large concentration center there. Most of the GOM in higher altitudes would be diffused to the surface in local urban areas and others would be transported to non-urban areas and then increase surface GOM con-centration there by VDIF. Due to the limited emissions of PBM from PP, the influence
5
on VDIF of PBM from PP was negligible (Fig. 10c).
4 Conclusions
The simulation of atmospheric mercury in East China was conducted using CMAQ-Hg with a grid resolution in a nested domain of 27 km to study source apportionment and process analysis. An updated mercury emission inventory for 2007 with
anthro-10
pogenic emission of 638 Mg yr−1in China as well as emissions from natural sources of
551 Mg yr−1was used for this simulation. The base model results were consistent with
the measurements of atmospheric mercury including the concentration of TGM and PBM as well as the wet deposition in most sites of East China.
Model results for source apportionment showed that natural emissions are the most
15
important source for GEM concentration in East China with a contribution of 36.6 %. However natural sources were less important in winter than anthropogenic sources due to significant seasonal variation of emissions. Among the anthropogenic sources, metal production (MET) and power plants (PP) were largest contributors to GEM. For GOM and PBM, anthropogenic sources dominated the variation of concentration with
20
a contribution of 86.7 and 79.1 % to the annual averaged concentrations. Industrial sources (IND) were responsible for 57.5 % of the GOM concentration on average with the highest influence during winter time. IND also contributed significantly to PBM to-gether with domestic sources (DOM) and they accounted for 58.8 % of annual averaged PBM. 42.7 and 62.4 % of wet and dry deposition of mercury in East China came from
25
ACPD
15, 10389–10424, 2015Source attribution and process analysis
for atmospheric Hg
J. Zhu et al.
Title Page
Abstract Introduction
Conclusions References
Tables Figures
◭ ◮
◭ ◮
Back Close
Full Screen / Esc
Printer-friendly Version Interactive Discussion
Discussion
P
a
per
|
Discussion
P
a
per
|
Discussion
P
a
per
|
Discussion
P
a
per
|
wet and dry deposition in summer owing to higher emissions and the increased photo-chemical oxidation to GOM and transformation to PBM during this season. The impact of mercury emitted from outside of China was also significant for mercury pollution in East China. This was indicated by a contribution of more than 30 % from the model boundary conditions (BC) to GEM concentration and wet deposition.
5
The influence of atmospheric processes on mercury concentration in the near-surface layer was analyzed in urban and non-urban areas of the YRD. Emissions and vertical diffusion affected surface GEM and PBM concentration most and tended to compensate each other all the time in both urban and non-urban areas. However, dry deposition was the most important removal process for GOM with 7.3 and 2.9 ng m−3
10
deposited in urban and non-urban areas respectively on an average day. The variation of diurnal profiles of different processes (i.e.: HADV, VDIF, CHEM and AERO) inside the planetary boundary layer indicated the transport of mercury from urban to non-urban areas. Moreover, it was found that gas phase and aerosol chemistry (CHEM and AERO) have a large impact on GOM and PBM concentrations inside the free
tro-15
posphere. The high concentration of GOM aloft in non-urban areas could be diffused downwards by VDIF. Most of anthropogenic sources caused mercury to be transported and diffused away from urban areas by HADV and VDIF and increased the concentra-tion in non-urban areas by HADV. In contrast, emissions from power plants (PP) en-hanced surface GOM concentration by VDIF because emission from PP led to a large
20
concentration center in upper air. Natural sources only influenced CHEM and AERO in both areas more significantly than anthropogenic sources. Local emission in the YRD contributed 8.5 % more to GEM and ∼30 % more to GOM and PBM in urban than those in non-urban areas.
Acknowledgements. This work was supported by the National Key Basic Research
Develop-25
ment Program of China (2014CB441203,2011CB403406), the Specialized Research Fund for the Doctoral Program of Higher Education of China (20110091110010) and a project funded by the Priority Academic Program Development of Jiangsu Higher Education Institutions (PAPD). Thanks to Shuxiao Wang and Long Wang from Tsinghua University for providing mercury emis-sion data.
ACPD
15, 10389–10424, 2015Source attribution and process analysis
for atmospheric Hg
J. Zhu et al.
Title Page
Abstract Introduction
Conclusions References
Tables Figures
◭ ◮
◭ ◮
Back Close
Full Screen / Esc
Printer-friendly Version Interactive Discussion
Discussion
P
a
per
|
Discussion
P
a
per
|
Discussion
P
a
per
|
Discussion
P
a
per
|
References
Bieser, J., De Simone, F., Gencarelli, C., Geyer, B., Hedgecock, I., Matthias, V., Travnikov, O., and Weigelt, A.: A diagnostic evaluation of modeled mercury wet depositions in Europe us-ing atmospheric speciated high-resolution observations, Environ. Sci. Pollut. R., 21, 9995– 10012, 2014.
5
Binkowski, F. S. and Roselle, S. J.: Models-3 Community Multiscale Air Quality (CMAQ) model aerosol component 1. Model description, J. Geophys. Res., 108, 4183–4201, doi:10.1029/2001JD001409, 2003.
Bullock Jr., O. R. and Brehme, K. A.: Atmospheric mercury simulation using the CMAQ model: formulation description and analysis of wet deposition results, Atmos. Environ., 36, 2135–
10
2146, doi:10.1016/S1352-2310(02)00220-0, 2002.
Bullock Jr., O. R., Atkinson, D., Braverman, T., Civerolo, K., Dastoor, A., Davignon, D., Ku, J.-Y., Lohman, K., Myers, T. C., Park, R. J., Seigneur, C., Selin, N. E., Sistla, G., and Vijayaraghavan, K.: The North American Mercury Model Intercomparison Study (NAM-MIS): study description and model-to-model comparisons, J. Geophys. Res., 113, 1–17,
15
doi:10.1029/2008JD009803, 2008.
Bullock Jr., O. R., Atkinson, D., Braverman, T., Civerolo, K., Dastoor, A., Davignon, D., Ku, J.-Y., Lohman, K., Myers, T. C., Park, R. J., Seigneur, C., Selin, N. E., Sistla, G., and Vijayaragha-van, K.: An analysis of simulated wet deposition of mercury from the North American Mercury Model Intercomparison Study, J. Geophys. Res., 114, 1–12, doi:10.1029/2008JD011224,
20
2009.
Chen, L., Liu, M., Xu, Z., Fan, R., Tao, J., Chen, D., Zhang, D., Xie, D., and Sun, J.: Variation trends and influencing factors of total gaseous mercury in the Pearl River Delta – a highly industrialised region in South China influenced by seasonal monsoons, Atmos. Environ., 77, 757–766, 2013.
25
Ci, Z. J., Zhang, X. S., Wang, Z. W., and Niu, Z. C.: Atmospheric gaseous elemental mercury (GEM) over a coastal/rural site downwind of East China: temporal variation and long-range transport, Atmos. Environ., 45, 2480–2487, 2011a.
Ci, Z. J., Zhang, X. S., Wang, Z. W., Niu, Z. C., Diao, X. Y., and Wang, S. W.: Distribution and air-sea exchange of mercury (Hg) in the Yellow Sea, Atmos. Chem. Phys., 11, 2881–2892,
30
ACPD
15, 10389–10424, 2015Source attribution and process analysis
for atmospheric Hg
J. Zhu et al.
Title Page
Abstract Introduction
Conclusions References
Tables Figures
◭ ◮
◭ ◮
Back Close
Full Screen / Esc
Printer-friendly Version Interactive Discussion
Discussion
P
a
per
|
Discussion
P
a
per
|
Discussion
P
a
per
|
Discussion
P
a
per
|
Cohen, M., Artz, R., Draxler, R., Miller, P., Poissant, L., Niemi, D., Ratté, D., Deslauriers, M., Du-val, R., Laurin, R., Slotnick. J., Nettesheim, T., and McDonald, J.: Modeling the atmospheric transport and deposition of mercury to the Great Lakes, Environ. Res., 95, 247–265, 2004. Dou, H., Wang, S., Wang, L., Zhang, L., and Hao, J.: Characteristics of total gaseous mercury
concentrations at a rural site of Yangtze Delta, China, Environm. Sci., 34, 1–7, 2013.
5
Feng, X., Shang, L., Wang, S., Tang, S., and Zheng, W.: Temporal variation of to-tal gaseous mercury in the air of Guiyang, China, J. Geophys. Res., 109, D03303, doi:10.1029/2003JD004159, 2004.
Friedli, H. R., Arellano Jr., A. F., Geng, F., Cai, C., and Pan, L.: Measurements of atmo-spheric mercury in Shanghai during September 2009, Atmos. Chem. Phys., 11, 3781–3788,
10
doi:10.5194/acp-11-3781-2011, 2011.
Fu, X. W., Feng, X. B., Zhu, W. Z., Wang, S. F., and Lu, J.: Total gaseous mercury concentra-tions in ambient air in the eastern slope of Mt. Gongga, South-Eastern fringe of the Tibetan plateau, China, Atmos. Environ., 42, 970–979, 2008.
Gbor, P. K., Wen, D., Meng, F., Yang, F., Zhang, B., and Sloan, J. J.: Improved model for mercury
15
emission, transport and deposition, Atmos. Environ., 40, 973–983, 2006.
Gbor, P., Wen, D., Meng, F., Yang, F., and Sloan, J.: Modeling of mercury emis-sion, transport and deposition in North America, Atmos. Environ., 41, 1135–1149, doi:10.1016/j.atmosenv.2006.10.005, 2007.
Holloway, T., Voigt, C., Morton, J., Spak, S. N., Rutter, A. P., and Schauer, J. J.: An assessment
20
of atmospheric mercury in the Community Multiscale Air Quality (CMAQ) model at an urban site and a rural site in the Great Lakes Region of North America, Atmos. Chem. Phys., 12, 7117–7133, doi:10.5194/acp-12-7117-2012, 2012.
Keeler, G. J., Gratz, L. E., and Al-Wali, K.: Long-term atmospheric mercury wet deposition at Underhill, Vermont, Ecotoxicology, 14, 71–83, 2005.
25
Lin, C. J. and Pehkonen, S. O.: The chemistry of atmospheric mercury: a review, Atmos. Envi-ron., 33, 2067–2079, 1999.
Lin, C.-J., Pan, L., Streets, D. G., Shetty, S. K., Jang, C., Feng, X., Chu, H.-W., and Ho, T. C.: Estimating mercury emission outflow from East Asia using CMAQ-Hg, Atmos. Chem. Phys., 10, 1853–1864, doi:10.5194/acp-10-1853-2010, 2010.
30
ACPD
15, 10389–10424, 2015Source attribution and process analysis
for atmospheric Hg
J. Zhu et al.
Title Page
Abstract Introduction
Conclusions References
Tables Figures
◭ ◮
◭ ◮
Back Close
Full Screen / Esc
Printer-friendly Version Interactive Discussion
Discussion
P
a
per
|
Discussion
P
a
per
|
Discussion
P
a
per
|
Discussion
P
a
per
|
Lin, X. and Tao, Y.: A numerical modelling study on regional mercury budget for eastern North America, Atmos. Chem. Phys., 3, 535–548, doi:10.5194/acp-3-535-2003, 2003.
Lindberg, S. E., Brooks, S., Lin, C. J., Scott, K. J., Landis, M. S., Stevens, R. K., Goodsite, M., and Richter, A.: Dynamic oxidation of gaseous mercury in the arctic troposphere at polar sunrise, Environ. Sci. Technol., 36, 1245–1256, doi:10.1021/es0111941, 2002.
5
Liu, X. and Zhang, Y: Understanding of the formation mechanisms of ozone and particulate matter at a fine scale over the southeastern U. S.: Process analyses and responses to future-year emissions, Atmos. Environ., 74, 259–276, 2013.
Nguyen, D., Kim, J., Shim, S., and Zhang, X.: Ground and shipboard measurements of atmo-spheric gaseous elemental mercury over the Yellow Sea region during 2007–2008, Atmos.
10
Environ., 41, 253–260, 2011.
Pacyna, E. G., Pacyna, J. M., Sundseth, K., Munthe, J., Kindbom, K., Wilson, S., Steen-huisen, F., and Maxson, P.: Global emission of mercury to the atmosphere from anthro-pogenic sources in 2005 and projections to 2020, Atmos. Environ., 44, 2487–2499, 2010. Pai, P., Karamchandani, P., Seigneur, C., and Allan, M.: Sensitivity of simulated atmospheric
15
mercury concentrations and deposition to model input parameters, J. Geophys. Res., 104, 13855–13868, 1999.
Pan, L., Lin, C. J., Carmichael, G. R., Streets, D. G., Tang, Y., Woo, J. H., Shetty, S. K., Chu, H. W., Ho, T. C., Friedli, H. R., and Feng, X.: Study of atmospheric mercury budget in East Asia using STEM-Hg modeling system, Sci. Total Environ., 408, 3277–3291, 2010.
20
Pongprueksa, P., Lin, C. J., Lindberg, S. E., Jang, C., Braverman, T., Russell Bullock Jr., O., Ho, T. C., and Chu, H. W.: Scientific uncertainties in atmospheric mercury models III: bound-ary and initial conditions, model grid resolution, and Hg(II) reduction mechanism, Atmos. Environ., 42, 1828–1845, 2008.
Quan, J., Zhang, Q., and Zhang, X.: Emission of Hg from coal consumption in China and its
25
summertime deposition calculated by CMAQ-Hg, Terr. Atmos. Ocean. Sci., 20, 325–331, 2009.
Rolfhus, K. R., Sakamoto, H. E., Cleckner, L. B., Stoor, R. W., Babiarz, C. L., Back, R. C., Manolopoulos, H., Hurley, J. P.: Distribution and fluxes of total and methyl mercury in Lake Superior, Environ. Sci. Technol., 37, 865–872, 2003.
30
ACPD
15, 10389–10424, 2015Source attribution and process analysis
for atmospheric Hg
J. Zhu et al.
Title Page
Abstract Introduction
Conclusions References
Tables Figures
◭ ◮
◭ ◮
Back Close
Full Screen / Esc
Printer-friendly Version Interactive Discussion
Discussion
P
a
per
|
Discussion
P
a
per
|
Discussion
P
a
per
|
Discussion
P
a
per
|
Schroeder, W. H. and Munthe, J.: Atmospheric mercury – an overview, Atmos. Environ., 32, 809–822, 1998.
Seigneur, C., Vijayaraghavan, K., Lohman, K., Karamchandani, P., and Scott, C.: Global source attribution for mercury deposition in the United States, Environ. Sci. Technol., 38, 555–569, 2004.
5
Selin, N. E. and Jacob, D. J.: Seasonal and spatial patterns of mercury wet deposition in the United States: constraints on the contribution from North American anthropogenic sources, Atmos. Environ., 42, 5193–5204, 2008.
Selin, N. E., Jacob, D. J., Park, R. J., Yantosca, R. M., Strode, S., Jaegle, L., and Jaffe, D.: Chemical cycling and deposition of atmospheric mercury: global constraints from
observa-10
tions, J. Geophys. Res.-Atmos., 112, D02308, doi:10.1029/2006jd007450, 2007.
Shetty, S., Lin, C., Streets, D., and Jang, C.: Model estimate of mercury emission from natural sources in East Asia, Atmos. Environ., 42, 8674–8685, 2008.
Streets, D. G., Zhang, Q., and Wu, Y.: Projections of global mercury emissions in 2050, Environ. Sci. Technol., 36, 2983–2988, 2009.
15
Wan, Q., Feng, X. B., Lu, J. L., Zheng, W., Song, X. J., Li, P., Han, S. J., and Xu, H.: Atmospheric mercury in Changbai Mountain area, northeastern China I: the season distribution pattern of total gaseous mercury and its potential sources, Environ. Res., 109, 201–206, 2009. Wang, L., Wang, S., Zhang, L., Wang, Y., Zhang, Y., Nielsen, C., McElroy, M. B., and Hao, J.:
Source apportionment of atmospheric mercury pollution in China using the GEOS-Chem
20
model, Environ. Pollut., 190, 166–175, 2014.
Wang, S. X., Zhang, L., Wang, L., Wu, Q. R., Wang, F. Y., and Hao, J. M.: A review of at-mospheric mercury emissions, pollution and control in China, Front. Environ. Sci. Eng., 8, 631–649, doi:10.1007/s11783-014-0673-x, 2014.
Wang, Y.: The speciation, levels and potential impacted factors of atmospheric mercury in Hefei,
25
Central China, University of Science and Technology of China, 2010 (in Chinese).
Wang, Z. W., Chen, Z. S., Duan, N., and Zhang, X. S.: Gaseous elemental mercury concen-tration in atmosphere at urban and remote sites in China, J. Environ. Sci., 19, 176–180, 2007.
Wu, Q. R., Wang, S. X., Zhang, L., Song, J. X., Yang, H., and Meng, Y.: Update of mercury
30
ACPD
15, 10389–10424, 2015Source attribution and process analysis
for atmospheric Hg
J. Zhu et al.
Title Page
Abstract Introduction
Conclusions References
Tables Figures
◭ ◮
◭ ◮
Back Close
Full Screen / Esc
Printer-friendly Version Interactive Discussion
Discussion
P
a
per
|
Discussion
P
a
per
|
Discussion
P
a
per
|
Discussion
P
a
per
|
Wu, Y., Wang, S., Streets, D. G., Hao., J., Chan, M., and Jiang, J.: Trends in Anthropogenic Mercury Emissions in China from 1995 to 2003, Environ. Sci. Technol., 40, 5312–5318, 2006.
Xiu, G., Cail, J., Zhang, W., Zhang, D., Bueler, A., Lee, S., Shen, Y., Xu, L., Hunag, X., and Zhang, P.: Speciated mercury in size-fractionated particles in Shanghai ambient air, Atmos.
5
Environ., 43, 3145–3154, 2009.
Zhu, J., Wang, T., Talbot, R., Mao, H., Hall, C. B., Yang, X., Fu, C., Zhuang, B., Li, S., Han, Y., and Huang, X.: Characteristics of atmospheric Total Gaseous Mercury (TGM) observed in urban Nanjing, China, Atmos. Chem. Phys., 12, 12103–12118, doi:10.5194/acp-12-12103-2012, 2012.
10
ACPD
15, 10389–10424, 2015Source attribution and process analysis
for atmospheric Hg
J. Zhu et al.
Title Page
Abstract Introduction
Conclusions References
Tables Figures
◭ ◮
◭ ◮
Back Close
Full Screen / Esc
Printer-friendly Version Interactive Discussion
Discussion
P
a
per
|
Discussion
P
a
per
|
Discussion
P
a
per
|
Discussion
P
a
per
|
Table 1.Summary of mercury emissions in the model domain 1.
GEM (Mg yr−1) GOM (Mg yr−1) TPM (Mg yr−1) Total (Mg yr−1)
Natural 551 0 0 551
Anthropogenic 316 245 77 638
CEM 69.0 12.9 4.3 86.2
DOM 6.4 9.2 24.7 40.3
IND 34.1 149.0 27.2 210.3
MET 100.6 30.1 5.3 136.0
PP 84.2 38.1 1.3 123.6
TRA 8.1 5.9 14.0 28.0
ACPD
15, 10389–10424, 2015Source attribution and process analysis
for atmospheric Hg
J. Zhu et al.
Title Page
Abstract Introduction
Conclusions References
Tables Figures
◭ ◮
◭ ◮
Back Close
Full Screen / Esc
Printer-friendly Version Interactive Discussion
Discussion
P
a
per
|
Discussion
P
a
per
|
Discussion
P
a
per
|
Discussion
P
a
per
|
(a)
(b) (c)
ACPD
15, 10389–10424, 2015Source attribution and process analysis
for atmospheric Hg
J. Zhu et al.
Title Page
Abstract Introduction
Conclusions References
Tables Figures
◭ ◮
◭ ◮
Back Close
Full Screen / Esc
Printer-friendly Version Interactive Discussion
Discussion
P
a
per
|
Discussion
P
a
per
|
Discussion
P
a
per
|
Discussion
P
a
per
|
(a) (b) (c)
Natural Anthropogenic TRA Anthropogenic PP Anthropogenic MET
Anthropogenic IND Anthropogenic DOM Anthropogenic CEM BC
0% 20% 40% 60% 80% 100%
0% 20% 40% 60% 80% 100%
0% 20% 40% 60% 80% 100%
ACPD
15, 10389–10424, 2015Source attribution and process analysis
for atmospheric Hg
J. Zhu et al.
Title Page
Abstract Introduction
Conclusions References
Tables Figures
◭ ◮
◭ ◮
Back Close
Full Screen / Esc
Printer-friendly Version Interactive Discussion
Discussion
P
a
per
|
Discussion
P
a
per
|
Discussion
P
a
per
|
Discussion
P
a
per
|
(a)
(b)
ACPD
15, 10389–10424, 2015Source attribution and process analysis
for atmospheric Hg
J. Zhu et al.
Title Page Abstract Introduction Conclusions References Tables Figures ◭ ◮ ◭ ◮ Back Close
Full Screen / Esc
Printer-friendly Version Interactive Discussion Discussion P a per | Discussion P a per | Discussion P a per | Discussion P a per | -2 -1.5 -1 -0.5 0 0.5 1 1.5 2
0 1 2 3 4 5 6 7 8 9 10 11 12 13 14 15 16 17 18 19 20 21 22 23
GEM
(ng
m
-3 h -1) Hour -2 -1.5 -1 -0.5 0 0.5 1 1.5 2
0 1 2 3 4 5 6 7 8 9 10 11 12 13 14 15 16 17 18 19 20 21 22 23
GEM
(ng
m
-3 h -1) Hour -1 -0.8 -0.6 -0.4 -0.2 0 0.2 0.4 0.6 0.8 1
0 1 2 3 4 5 6 7 8 9 10 11 12 13 14 15 16 17 18 19 20 21 22 23
R
GM
(ng
m
-3 h -1) Hour -1 -0.8 -0.6 -0.4 -0.2 0 0.2 0.4 0.6 0.8 1
0 1 2 3 4 5 6 7 8 9 10 11 12 13 14 15 16 17 18 19 20 21 22 23
R
GM (ng
m
-3 h -1) Hour -0.3 -0.2 -0.1 0 0.1 0.2 0.3
0 1 2 3 4 5 6 7 8 9 10 11 12 13 14 15 16 17 18 19 20 21 22 23
P
BM
(
ng
m
-3 h -1) Hour -0.3 -0.2 -0.1 0 0.1 0.2 0.3
0 1 2 3 4 5 6 7 8 9 10 11 12 13 14 15 16 17 18 19 20 21 22 23
P
BM
(
ng
m
-3 h -1) Hour (a) (b) (c) Urban Urban
Urban Non-urban
Non-urban Non-urban
CHEM/AERO