ACPD
12, 25551–25572, 2012Ozone depletion and aerosols
A. Voulgarakis et al.
Title Page
Abstract Introduction
Conclusions References
Tables Figures
◭ ◮
◭ ◮
Back Close
Full Screen / Esc
Printer-friendly Version Interactive Discussion
Discussion
P
a
per
|
Dis
cussion
P
a
per
|
Discussion
P
a
per
|
Discussio
n
P
a
per
|
Atmos. Chem. Phys. Discuss., 12, 25551–25572, 2012 www.atmos-chem-phys-discuss.net/12/25551/2012/ doi:10.5194/acpd-12-25551-2012
© Author(s) 2012. CC Attribution 3.0 License.
Atmospheric Chemistry and Physics Discussions
This discussion paper is/has been under review for the journal Atmospheric Chemistry and Physics (ACP). Please refer to the corresponding final paper in ACP if available.
Linkages between ozone depleting
substances, tropospheric oxidation and
aerosols
A. Voulgarakis1,*, D. T. Shindell1, and G. Faluvegi1
1
NASA Goddard Institute for Space Studies and Columbia University Center for Climate Systems Research, New York, USA
*
now at: Department of Physics, Imperial College, London, UK
Received: 31 July 2012 – Accepted: 12 September 2012 – Published: 26 September 2012
Correspondence to: A. Voulgarakis ([email protected])
ACPD
12, 25551–25572, 2012Ozone depletion and aerosols
A. Voulgarakis et al.
Title Page
Abstract Introduction
Conclusions References
Tables Figures
◭ ◮
◭ ◮
Back Close
Full Screen / Esc
Printer-friendly Version Interactive Discussion
Discussion
P
a
per
|
Dis
cussion
P
a
per
|
Discussion
P
a
per
|
Discussio
n
P
a
per
|
Abstract
Coupling between the stratosphere and the troposphere allows changes in strato-spheric ozone abundances to affect tropospheric chemistry. Large-scale effects from such changes on chemically produced tropospheric aerosols have not been system-atically examined in past studies. We use a composition-climate model to investigate
5
potential past and future impacts of changes in stratospheric Ozone Depleting Sub-stances (ODS) on tropospheric oxidants and sulfate aerosols. In most experiments, we find significant responses in tropospheric photolysis and oxidants, with small but signif-icant effects on methane radiative forcing. The response of sulfate aerosols is sizeable when examining the effect of increasing future nitrous oxide (N2O) emissions. We also
10
find that without the regulation of chlorofluorocarbons (CFCs) through the Montreal Protocol, sulfate aerosols could have increased by 2050 by a comparable amount to the decreases predicted due to relatively stringent sulfur emissions controls. The histor-ical radiative forcing of CFCs through their indirect effects on methane (−22.6 mW m−2)
and sulfate aerosols (−3.0 mW m−2) discussed here is non-negligible when compared
15
to known historical CFC forcing. Our results stress the importance of accounting for stratosphere-troposphere, gas-aerosol and composition-climate interactions when in-vestigating the effects of changing emissions on atmospheric composition and climate.
1 Introduction
Stratospheric ozone (O3) changes have been large over the past few decades mainly
20
due to anthropogenic emissions of Ozone Depleting Substances (ODS), and are ex-pected to be large in the future due to the phase-out of ODS emissions and to climate change (e.g. Austin et al., 2010; Eyring et al., 2010). Stratospheric ozone exerts di-rect radiative forcing on the Earth system (Forster et al., 2007), while it also indidi-rectly affects other climate aspects such as tropospheric circulation and precipitation (Son
25
ACPD
12, 25551–25572, 2012Ozone depletion and aerosols
A. Voulgarakis et al.
Title Page
Abstract Introduction
Conclusions References
Tables Figures
◭ ◮
◭ ◮
Back Close
Full Screen / Esc
Printer-friendly Version Interactive Discussion
Discussion
P
a
per
|
Dis
cussion
P
a
per
|
Discussion
P
a
per
|
Discussio
n
P
a
per
|
important species, especially by affecting the tropospheric oxidizing capacity. The lat-ter is largely delat-termined by the abundances of hydroxyl radicals (OH), which depend
on tropospheric ozone and nitrogen oxides (NOx), humidity, abundances of species
that consume OH (Carbon Monoxide (CO), methane and Non-Methane Volatile Or-ganic Compounds (NMVOCs)), and Ultra-Violet (UV) radiation (e.g. Thompson, 1992;
5
Lelieveld et al., 2002; Voulgarakis et al., 2012).
Changes in stratospheric ozone can affect tropospheric oxidants via
stratosphere-troposphere exchange (STE) (Collins et al., 2003; Hegglin and Shepherd, 2009; Prather and Hsu, 2010; Zeng et al., 2010; Voulgarakis et al., 2011), which enriches the troposphere with ozone, and by driving changes in the photolysis of tropospheric
10
species (Madronich and Granier, 1992; Bekki et al., 1994; Fuglestved et al., 1994; Krol and van Weele, 1997; Isaksen et al., 2005; Lamarque et al., 2010b; Tang et al., 2011), which depends on UV radiation and, thus, the amount of overhead ozone. Photoly-sis has a central role in driving the formation of OH (Madronich and Granier, 1992; Fuglestved et al., 1994; Thompson, 1992; Rohrer and Berresheim, 2006; Voulgarakis
15
et al., 2009), since it leads to the breakdown of ozone,
O3+hν→O2+O(1D)(λ <320 nm) (R1)
and the excited oxygen atoms produced react with water vapor to produce OH:
O(1D)+H2O→OH+OH (R2)
Apart from cleansing the atmosphere from pollutants such as CO and NMVOCs,
oxida-20
tion by OH also affects methane and sulfate aerosols, being the major sink of the former (Madronich and Granier, 1992; Voulgarakis et al., 2012) and a major chemical source of the latter via gaseous oxidation of sulfur dioxide (SO2) (Unger et al., 2006;
Shin-dell et al., 2009). Thus, OH plays a significant indirect role in determining the radiative
balance of the troposphere. Sulfate aerosols are also produced through SO2 aqueous
25
oxidation by hydrogen peroxide (H2O2) (Koch et al., 2006; Unger et al., 2006), and the
ACPD
12, 25551–25572, 2012Ozone depletion and aerosols
A. Voulgarakis et al.
Title Page
Abstract Introduction
Conclusions References
Tables Figures
◭ ◮
◭ ◮
Back Close
Full Screen / Esc
Printer-friendly Version Interactive Discussion
Discussion
P
a
per
|
Dis
cussion
P
a
per
|
Discussion
P
a
per
|
Discussio
n
P
a
per
|
process (via OH), but the former produces aerosols with shorter lifetime, due to the usual simultaneous presence of clouds.
Although effects of stratospheric ozone changes on tropospheric oxidants have been studied in the past (see above), their possible indirect link with tropospheric aerosols and their radiative forcing has not been examined. Here, we systematically explore
5
these links in a number of model experiments, considering both past and future ODS changes. We further investigate such stratosphere-troposphere interactions in a hypo-thetical future scenario where ODS have not been regulated by the Montreal Protocol. Past studies examining this topic did not investigate tropospheric effects (Morgenstern et al., 2008; Newman et al., 2009). In Sect. 2, we outline the main characteristics of the
10
model used, and describe the model experiments performed. Section 3 presents and discusses the results of the experiments, while Sect. 4 outlines the conclusions of this study.
2 Model description and experimental set-up
2.1 Model description
15
We used a version of the GISS composition-climate model (Shindell et al., 2006; Shin-dell et al., 2012), which is very similar to the ModelE2 version developed for use in simulations in support of the Intergovernmental Panel on Climate Change (IPCC) Fifth
Assessment Report (AR5). The model has a 2◦ latitude by 2.5◦ longitude horizontal
resolution and 40 vertical layers from the surface to 0.1 hPa. Tropospheric/stratospheric
20
chemistry includes 156 chemical reactions among 51 gas species. Photolysis rates are simulated using the Fast-J2 scheme (Wild et al., 2000; Bian and Prather, 2002), which accounts for the effects of modelled overhead ozone, clouds, aerosols and surface re-flections. The model’s sulfate aerosol scheme includes prognostic simulations of the
mass distributions of DiMethyl Sulfide (DMS), MethaneSulfonic Acid (MSA), SO2, and
25
ACPD
12, 25551–25572, 2012Ozone depletion and aerosols
A. Voulgarakis et al.
Title Page
Abstract Introduction
Conclusions References
Tables Figures
◭ ◮
◭ ◮
Back Close
Full Screen / Esc
Printer-friendly Version Interactive Discussion
Discussion
P
a
per
|
Dis
cussion
P
a
per
|
Discussion
P
a
per
|
Discussio
n
P
a
per
|
The model’s skill in capturing tropospheric oxidants and sulfate has been evaluated in past studies and shown to be realistic (Koch et al., 2006; Shindell et al., 2006). A re-cent model evaluation, in which a very similar version of the model was used (Shindell et al., 2012), showed that the model has improved significantly compared to its previ-ous version (Shindell et al., 2006), especially when it comes to ozone seasonality in
5
the stratosphere. However, the Antarctic ozone hole extends more equatorward than seen in the observations, and it lasts somewhat too long. Still, the biases in middle and low latitudes, which are of particular interest in this study (due to the abundance of oxidants and aerosols in these regions), are small, and typically less than 5 %.
The global tropospheric mean mass-weighted OH concentration is
10
9.9×10⁻⁵mol cm−3, which is in good agreement with past estimates (Lawrence
et al., 2001). Furthermore, it has been shown (Voulgarakis et al., 2012) that the model’s tropospheric chemical methane lifetime agrees very well with a recent observationally-constrained estimate (Prather et al., 2012). The above indicate that tropospheric oxidising capacity is simulated reasonably in the model. The model’s
15
sulfate used has been found to be more sensitive to OH changes than several other models (Fry et al., 2012), though these other models did not include liquid tracer budgets, which may mean that they are missing some of the physics that are included in the GISS simulations, though differences in sulfate chemistry could be important as well.
20
2.2 Experimental set-up
In the experiments presented here, present-day anthropogenic and biomass
burn-ing emissions of NOx, CO, NMVOCs and aerosols follow Lamarque et al. (2010a),
which were created in support of the Coupled Model Intercomparison Project Phase
5 (CMIP5). Lightning NOx emissions depend on the model’s convection (Price et al.,
25
1997), while isoprene emissions respond to temperature and solar radiation based
on the algorithm of Guenther et al. (2006). Natural emissions of NOx from soils
are prescribed at fixed values (2.7 Tg N yr−1
ACPD
12, 25551–25572, 2012Ozone depletion and aerosols
A. Voulgarakis et al.
Title Page
Abstract Introduction
Conclusions References
Tables Figures
◭ ◮
◭ ◮
Back Close
Full Screen / Esc
Printer-friendly Version Interactive Discussion
Discussion
P
a
per
|
Dis
cussion
P
a
per
|
Discussion
P
a
per
|
Discussio
n
P
a
per
|
(16 Tg C yr−1), paraffins (14 Tg C yr−1), and terpenes (192 Tg yr−1). The concentrations of long-lived gases, such as CO2, methane, N2O and CFCs, are prescribed at the
sur-face to observed present-day values. When perturbed in our experiments (CFCs, N2O;
see next paragraph), they either follow past observations, or future projections accord-ing to the Representative Concentration Pathway (RCP; van Vuuren et al., 2011). The
5
RCP projections for N2O and CFC concentrations are based on calculations with the
reduced-complexity coupled carbon cycle climate model MAGICC 6.3 to estimate mix-ing ratios that would result from the RCP emissions (Meinshausen et al., 2011).
We performed six simulations (see Table 1): (a) BASE, which represents non-perturbed present-day (2000) conditions; (b) 1960 CFCs, in which CFCs are set to
10
1960 levels; (c) 2100 CFCs, in which CFCs are set to 2100 levels following the RCP8.5 scenario; (d) WACFCs, in which CFCs are set to 2050 levels following a “world avoided” scenario, where CFCs are not regulated by the Montreal Protocol (Newman et al., 2009); (e) 1850 N2O, in which N2O is set to 1850 levels; and (f) 2100 N2O, in which
N2O is set to 2100 levels (following RCP8.5). Non-ODS emissions/concentrations and
15
sea-surface temperatures are representative of present-day in all experiments in order to isolate the ODS effects alone. In each experiment, we ran the model using the same conditions for 7 yr and then averaged in order to increase the signal-to-noise ratio. Two years of spin-up were performed in advance.
3 Results and discussion
20
Figure 1 shows the annual zonal mean photolysis rate of ozone to yield a singlet oxy-gen atom (J(O1D); see Reaction R1), as well as its changes in the various sensitivity experiments. J(O1D) is largest in the tropics, where solar zenith angles and overhead ozone columns are smallest. We find that all the perturbations applied to ODS have sizeable effects on tropospheric photolysis (Fig. 1). The changes in J(O1D) are largest
25
ACPD
12, 25551–25572, 2012Ozone depletion and aerosols
A. Voulgarakis et al.
Title Page
Abstract Introduction
Conclusions References
Tables Figures
◭ ◮
◭ ◮
Back Close
Full Screen / Esc
Printer-friendly Version Interactive Discussion
Discussion
P
a
per
|
Dis
cussion
P
a
per
|
Discussion
P
a
per
|
Discussio
n
P
a
per
|
non-polar regions, such as northern midlatitudes, there are sizeable changes (mostly larger than 5 %), which can have significant impacts on tropospheric chemistry. The
effects are dramatic in the WACFCs experiment, where midlatitude J(O1D) increases
by more than 120 %.
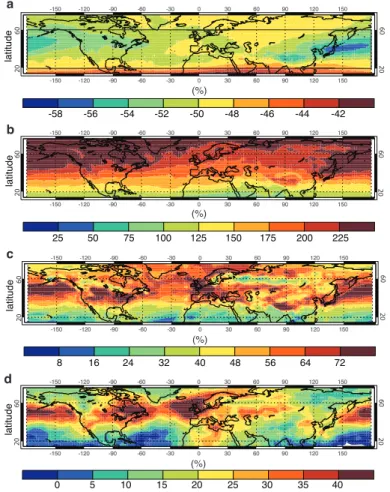
Figure 2 shows differences in total ozone column, surface J(O1D), surface OH and
5
surface sulfate concentrations, between the WACFCs and the BASE simulation, for the northern extratropics, the region where sulfate is most important for climate and air quality. Total ozone for 2050 is lower by 50–60 % due to the lack of regulation in CFCs in this scenario, in fairly good agreement with previous work (Newman et al.,
2009). This leads to ubiquitous surface J(O1D) increases of more than 150 % in the
10
northern extratropics, which, in turn leads to OH increases of 40–80 %. The highest OH increases are located in the regions with the largest total ozone and J(O1D) changes combined with high OH recycling efficiencies (Eastern US, Western Europe, East Asia) (Lelieveld et al., 2002).
We find subsequent large increases of sulfate aerosol concentrations throughout
15
the northern extratropics (Fig. 2d). Differences range from 20 to 50 % in highly pop-ulated midlatitude regions where aerosols cause serious human health damage. The increases are around 30–35 % over the northernmost states of the US, over 40 % over the British Isles, and 15–30 % over East Asia. Increases in sulfate aerosols are cor-related in several cases to the enhancement of the tropospheric oxidizing capacity,
20
as reflected by OH, which leads to more SO2 oxidised to sulfate. Figure 3 shows the
zonal mean differences in concentration and chemical gas-phase production rate of
sulfate, between WACFCs and BASE. It is clear that areas with large chemical produc-tion changes are also areas with high concentraproduc-tion changes, the “hot-spot” being the northern midlatitudes at low altitudes. This finding is in qualitative agreement with an
25
earlier study on a related topic (Toumi et al., 1994).
Note that changes in H2O2 and aqueous-phase production of sulfate are also
ACPD
12, 25551–25572, 2012Ozone depletion and aerosols
A. Voulgarakis et al.
Title Page
Abstract Introduction
Conclusions References
Tables Figures
◭ ◮
◭ ◮
Back Close
Full Screen / Esc
Printer-friendly Version Interactive Discussion
Discussion
P
a
per
|
Dis
cussion
P
a
per
|
Discussion
P
a
per
|
Discussio
n
P
a
per
|
changes by 11 %, relative to BASE. However, as mentioned earlier, the gas-phase pro-duction changes (via OH) are expected to be more important due to the longer lifetime of the sulfate produced through via gaseous processes.
Table 2 summarizes the effects of the perturbations applied in the different experi-ments on tropospheric OH and surface sulfate concentration, as well as on radiative
5
forcing by methane and sulfate. We focus on global effects, and on effects in north-ern midlatitudes, where sulfate is important, both for air quality and climate. The OH differences are significant in all the experiments, with the WACFCs scenario showing clearly the largest effects, consistent with photolysis changes (Fig. 1). Global methane radiative forcing strongly decreases in WACFCs (by∼0.5 W m−2), while there are also
10
significant changes in the other experiments (6–23 mW m−2
).
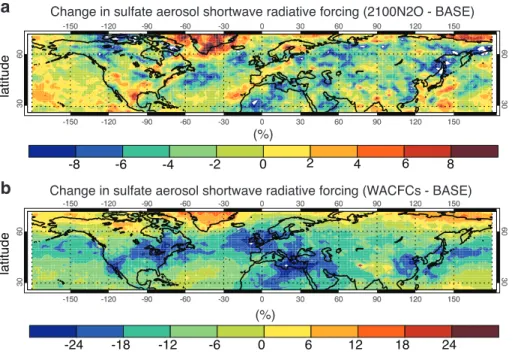
For sulfate, in terms of both concentration and forcing, the two cases for which we
find the most sizeable relative changes are WACFCs and 2100 N2O. In the former, the
differences range from around 12 to 20 %, while in the latter, they are around 1.7–2.5 %.
Regionally, concentration differences can be as large as 50 % in WACFCs and 15 % in
15
2100 N2O, and forcing differences reach 35 % in WACFCs and 13 % in 2100 N2O (see
Fig. 2d and Fig. 4). Areas affected heavily include East Asia, parts of Europe and parts of Northeastern America and the North Atlantic. In an additional experiment where
sul-fur emissions were set to 2050 values following the RCP4.5 scenario (in which SO2
emissions decrease by more than 50 %), we found global surface sulfate aerosol
con-20
centration reductions of 24 %. This indicates that the indirect effect of ODS on aerosols discussed here (17 % globally) could have cancelled out part of the benefit gained from aerosol emissions reductions, had the Montreal Protocol not been implemented. Note
that total sulfate burden changes depend on the current relative amount of SO2
re-moved by deposition versus conversion to sulfate, thus it would be useful to test the
25
variation of this balance across different models in future work.
ACPD
12, 25551–25572, 2012Ozone depletion and aerosols
A. Voulgarakis et al.
Title Page
Abstract Introduction
Conclusions References
Tables Figures
◭ ◮
◭ ◮
Back Close
Full Screen / Esc
Printer-friendly Version Interactive Discussion
Discussion
P
a
per
|
Dis
cussion
P
a
per
|
Discussion
P
a
per
|
Discussio
n
P
a
per
|
indirect forcing through other processes. Our calculated global methane radiative forc-ing due to past CFC changes is equal to about 7 % of the direct preindustrial (PI) to present-day (PD) forcing from CFCs, and to more than half their indirect effect through stratospheric ozone radiative forcing, based on Forster et al. (2007). For sulfate ra-diative forcing, the effects are smaller (1 % of the direct forcing and 8 % through of
5
the indirect stratospheric ozone effect). Similarly, the historical indirect effects of N2O
on radiative forcing through methane and sulfate (roughly equal) are equal to around 5 % of its direct PI-PD forcing and to 70 % of its indirect effects through stratospheric ozone. The effects of future N2O changes on radiative forcing in our experiments are
2–3 times larger than the historical effects, while the future effects of CFCs are also
10
equal or larger to the historical.
Changes in stratospheric ozone can impact tropospheric oxidation via STE, and this effect is expected to be opposite of the photolysis effect. Less ozone in the stratosphere can lead to less ozone transported to the troposphere and, thus, less OH produced by ozone photolysis. However, the effect of UV changes on photolysis appears to be
dom-15
inating the OH responses that we find in the troposphere. There is even one case (WACFCs, Southern Hemisphere) in which ozone depletion in the stratosphere is fol-lowed by ozone increases in the troposphere. However, this is driven by transport mod-ifications affecting the NOx budget in the troposphere and, thus, tropospheric ozone
production. We find that tropospheric temperature and humidity changes are very
min-20
imal (<1 %) in all the experiments, so we rule out the possibility that climate changes
induced by differences in CFCs and stratospheric ozone drive any of the changes sim-ulated.
Our experiments presented here are idealised, since a scenario in which only ODS will change, while other aspects of the climate system remain constant is not realistic.
25
Nevertheless, by isolating the ODS effect, we provide insight into particular processes which can be important. For the two scenarios in which we found the most sizeable
differences (WACFCs and 2100 N2O), changing future emissions and climate change
ACPD
12, 25551–25572, 2012Ozone depletion and aerosols
A. Voulgarakis et al.
Title Page
Abstract Introduction
Conclusions References
Tables Figures
◭ ◮
◭ ◮
Back Close
Full Screen / Esc
Printer-friendly Version Interactive Discussion
Discussion
P
a
per
|
Dis
cussion
P
a
per
|
Discussion
P
a
per
|
Discussio
n
P
a
per
|
have found that continental regions, where sulfate aerosols are of high importance,
will likely experience increases in OH abundances due to increases in NOxemissions,
while the global temperature and humidity increases expected due to global warming may lead to generally more OH production in the troposphere (Wild and Palmer, 2008). This, in addition to the oxidant increases due to ODS effects found here, could lead
5
to even larger sulfate responses in WACFCs and 2100 N2O. Note though, that when
more optimistic scenarios are used for future NOx emissions, there is a mixture of
positive and negative OH responses over industrialised regions, with large inter-model variability (Voulgarakis et al., 2012).
Projected increases in tropical upwelling could lead to further lower stratospheric
10
ozone decreases at low latitudes (Eyring et al., 2010), which would, again, add to the UV, oxidant and sulfate aerosol responses. Also, projected changes in atmospheric circulation may drive increased transport of ozone from the stratosphere to the tropo-sphere (Collins et al., 2003; Shindell et al., 2006), increasing tropospheric OH produc-tion. However, in a scenario like 2100 N2O, if we account for the simultaneous decline in 15
CFCs, part of the tropospheric effects will be cancelled out. Finally, note that in the cal-culations of OH and sulfate responses, feedbacks on OH through changes in methane have not been taken into account, since methane concentrations were kept constant. Had these feedbacks been included, all responses presented here would have been stronger.
20
4 Conclusions
We performed model experiments to investigate the role of ozone depleting substances in driving changes in tropospheric oxidants, aerosols and radiative forcing. These links
have not been examined in previous studies investigating the effects of ODS or the
evolution of tropospheric aerosols. Our results indicate that changes in ODS and
25
ACPD
12, 25551–25572, 2012Ozone depletion and aerosols
A. Voulgarakis et al.
Title Page
Abstract Introduction
Conclusions References
Tables Figures
◭ ◮
◭ ◮
Back Close
Full Screen / Esc
Printer-friendly Version Interactive Discussion
Discussion
P
a
per
|
Dis
cussion
P
a
per
|
Discussion
P
a
per
|
Discussio
n
P
a
per
|
through their effects on tropospheric methane and sulfate range from 8 % to 70 % (de-pending on the species) of the known corresponding indirect forcings through
strato-spheric ozone depletion. Special attention is needed regarding N2O effects beyond
2100, since its emissions are expected to be the dominant driver of future stratospheric ozone depletion (Ravishankara et al., 2009).
5
Our analysis also suggests that CFCs emissions reductions resulting from the Mon-treal Protocol may be translating to tropospheric composition and climate changes that have not been discussed in assessments exploring the “side-effects” of the agreement (Velders et al., 2007). We suggest that the Montreal Protocol may have been a factor mediating future sulfate aerosol concentrations in the 21th century. Finally, our results
10
imply that taking into account stratosphere-troposphere, gas-aerosol and composition-climate interactions is important when assessing the impact of regulations in emissions. Earth system models, which are designed to include all the above-mentioned interac-tions, are expected to facilitate such efforts in the future.
Acknowledgements. The authors wish to thank Paul Newman for providing useful information
15
on the WACFCs scenario, and NASA ACMAP for funding this research. Resources supporting this work were provided by the NASA High-End Computing (HEC) Program through the NASA Center for Climate Simulation (NCCS) at Goddard Space Flight Center.
References
Austin, J., Scinocca, J., Plummer, D., Oman, L., Waugh, D., Akiyoshi, H., Bekki, S.,
20
Braesicke, P., Butchart, N., Chipperfield, M., Cugnet, D., Dameris, M., Dhomse, S., Eyring, V., Frith, S., Garcia, R. R., Garny, H., Gettelman, A., Hardiman, S. C., Kinnison, D., Lamar-que, J. F., Mancini, E., Marchand, M., Michou, M., Morgenstern, O., Nakamura, T., Paw-son, S., Pitari, G., Pyle, J., Rozanov, E., Shepherd, T. G., Shibata, K., Teyssedre, H., Wilson, R. J., and Yamashita, Y.: Decline and recovery of total column ozone using a
mul-25
ACPD
12, 25551–25572, 2012Ozone depletion and aerosols
A. Voulgarakis et al.
Title Page
Abstract Introduction
Conclusions References
Tables Figures
◭ ◮
◭ ◮
Back Close
Full Screen / Esc
Printer-friendly Version Interactive Discussion
Discussion
P
a
per
|
Dis
cussion
P
a
per
|
Discussion
P
a
per
|
Discussio
n
P
a
per
|
Bekki, S., Law, K. S., and Pyle, J. A.: Effect of ozone depletion on atmospheric CH4 and CO concentrations, Nature, 371, 595–597, 1994.
Bian, H. and Prather, M.: Fast-J2: accurate simulations of photolysis in global climate models, J. Atmos. Chem., 41, 281–296, 2002.
Collins, W. J., Derwent, R. G., Garnier, B., Johnson, C. E., Sanderson, M. G., and
Steven-5
son, D. S.: Effect of stratosphere-troposphere exchange on the future tropospheric ozone trend, J. Geophys. Res., 108, 8528, doi:10.1029/2002JD002617, 2003.
Ehhalt, D., Prather, M., Dentener, F., Derwent, R., Dlugokencky, E., Holland, E., Isaksen, I., Katima, J., Kirchhoff, V., Matson, P., Midgley, P., and Wang, M.: Atmospheric chemistry and greenhouse gases, in: Climate Change 2001: The Scientific Basis, Contribution of Working
10
Group I to the Third Assessment Report of the Intergovernmental Panel on Climate Change, edited by: Houghton, J. T., Ding, Y., Griggs, D. J., Noguer, M., van der Linden, P. J., Dai, X., Maskell, K., and Johnson, C. A., Cambridge University Press, Cambridge, UK, 2001. Eyring, V., Cionni, I., Bodeker, G. E., Charlton-Perez, A. J., Kinnison, D. E., Scinocca, J. F.,
Waugh, D. W., Akiyoshi, H., Bekki, S., Chipperfield, M. P., Dameris, M., Dhomse, S.,
15
Frith, S. M., Garny, H., Gettelman, A., Kubin, A., Langematz, U., Mancini, E., Marchand, M., Nakamura, T., Oman, L. D., Pawson, S., Pitari, G., Plummer, D. A., Rozanov, E., Shep-herd, T. G., Shibata, K., Tian, W., Braesicke, P., Hardiman, S. C., Lamarque, J. F., Mor-genstern, O., Pyle, J. A., Smale, D., and Yamashita, Y.: Multi-model assessment of strato-spheric ozone return dates and ozone recovery in CCMVal-2 models, Atmos. Chem. Phys.,
20
10, 9451–9472, doi:10.5194/acp-10-9451-2010, 2010.
Forster, P., Ramaswamy, V., Artaxo, P., Berntsen, T., Betts, R., Fahey, D. W., Haywood, J., Lean, J., Lowe, D. C., Myhre, G., Nganga, J., Prinn, R., Raga, G., Schulz, M., and Van Dorland, R.: Changes in atmospheric constituents and in radiative forcing, in: Climate Change 2007: The Physical Science Basis, Contribution of Working Group I to the Fourth Assessment Report of
25
the Intergovernmental Panel on Climate Change, edited by: Solomon, S., Qin, D., Manning, M., Chen, Z., Marquis, M., Averyt, K. B., Tignor, M., and Miller, H. L., Cambridge Univ. Press, Cambridge, UK, 2007.
Fry, M. M., Naik, V., West, J. J., Schwarzkopf, M. D., Fiore, A. M., Collins, W. J., Dentener, F. J., Shindell, D. T., Atherton, C., Bergmann, D., Duncan, B. N., Hess, P., MacKenzie, I. A.,
30
ACPD
12, 25551–25572, 2012Ozone depletion and aerosols
A. Voulgarakis et al.
Title Page
Abstract Introduction
Conclusions References
Tables Figures
◭ ◮
◭ ◮
Back Close
Full Screen / Esc
Printer-friendly Version Interactive Discussion
Discussion
P
a
per
|
Dis
cussion
P
a
per
|
Discussion
P
a
per
|
Discussio
n
P
a
per
|
Fuglestved, J. S., Jonson, J. E., and Isaksen, I. S. A.: Effects of reductions in stratospheric ozone on tropospheric chemistry through changes in photolysis rates, Tellus B, 46, 172– 192, 1994.
Guenther, A., Karl, T., Harley, P., Wiedinmyer, C., Palmer, P. I., and Geron, C.: Estimates of global terrestrial isoprene emissions using MEGAN (Model of Emissions of Gases and
5
Aerosols from Nature), Atmos. Chem. Phys., 6, 3181–3210, doi:10.5194/acp-6-3181-2006, 2006.
Hegglin, M. I. and Shepherd, T. G.: Large climate-induced changes in ultraviolet index and stratosphere-to-troposphere ozone flux, Nature Geosci., 2, 687–691, 2009.
Isaksen, I. S. A., Zerefos, C., Kourtidis, K., Meleti, C., Dalsoren, S. B., Sundet, J. K.,
10
Grini, A., Zanis, P., and Balis, D.: Tropospheric ozone changes at unpolluted and semipol-luted regions induced by stratospheric ozone changes, J. Geophys. Res., 110, 02302, doi:10.1029/2004JD004618, 2005.
Kang, S. M., Polvani, L. M., Fyfe, J. C., and Sigmond, M.: Impact of polar ozone depletion on subtropical precipitation, Science, 332, 951–954, 2011.
15
Koch, D., Schmidt, G. A., and Field, C. V.: Sulfur, sea salt and radionuclide aerosols in GISS ModelE, J. Geophys. Res., 111, 06206, doi:10.1029/2004JD005550, 2006.
Krol, M. C. and van Weele, M.: Implications of variations in photodissociation rates for global tropospheric chemistry, Atmos. Environ., 31, 1257–1273, 1997.
Lamarque, J.-F., Bond, T. C., Eyring, V., Granier, C., Heil, A., Klimont, Z., Lee, D., Liousse, C.,
20
Mieville, A., Owen, B., Schultz, M. G., Shindell, D., Smith, S. J., Stehfest, E., Van Aar-denne, J., Cooper, O. R., Kainuma, M., Mahowald, N., McConnell, J. R., Naik, V., Riahi, K., and van Vuuren, D. P.: Historical (1850–2000) gridded anthropogenic and biomass burn-ing emissions of reactive gases and aerosols: methodology and application, Atmos. Chem. Phys., 10, 7017–7039, doi:10.5194/acp-10-7017-2010, 2010a.
25
Lamarque, J.-F., McConnell, J. R., Shindell, D. T., Orlando, J. J., and Tyndall, G. S.: Under-standing the drivers for the 20th century change of hydrogen peroxide in Antarctic ice-cores, Geophys. Res. Lett., 38, 04810, doi:10.1029/2010GL045992, 2010b.
Lawrence, M. G., J ¨ockel, P., and von Kuhlmann, R.: What does the global mean OH concentra-tion tell us?, Atmos. Chem. Phys., 1, 37–49, doi:10.5194/acp-1-37-2001, 2001.
30
ACPD
12, 25551–25572, 2012Ozone depletion and aerosols
A. Voulgarakis et al.
Title Page
Abstract Introduction
Conclusions References
Tables Figures
◭ ◮
◭ ◮
Back Close
Full Screen / Esc
Printer-friendly Version Interactive Discussion
Discussion
P
a
per
|
Dis
cussion
P
a
per
|
Discussion
P
a
per
|
Discussio
n
P
a
per
|
Madronich, S. and Granie, C.: Impact of recent total ozone changes on tropospheric ozone photodissociation, hydroxyl radicals, and methane trends, Geophys. Res. Lett., 19, 465–467, 1992.
Meinshausen, M., Smith, S. J., Calvin, K., Daniel, J. S., Kainuma, M. L. T., Lamarque, J.-F., Matsumoto, K., Montzka, S., Raper, S., Riahi, K., Thomson, A., Velders, G. J. M., and van
5
Vuuren, D. P.: The RCP greenhouse gas concentrations and their extensions from 1765 to 2300, Climatic Change, 109, 213–241,doi:10.1007/s10584-011-0156-z, 2011.
Morgenstern, O., Braesicke, P., Hurwitz, M. M., O’Connor, F. M., Bushell, A. C., Johnson, C. E., and Pyle, J. A.: The world avoided by the Montreal Protocol, Geophys. Res. Lett., 35, 16811, doi:10.1029/2008GL034590, 2008.
10
Newman, P. A., Oman, L. D., Douglass, A. R., Fleming, E. L., Frith, S. M., Hurwitz, M. M., Kawa, S. R., Jackman, C. H., Krotkov, N. A., Nash, E. R., Nielsen, J. E., Pawson, S., Stolarski, R. S., and Velders, G. J. M.: What would have happened to the ozone layer if chlorofluorocarbons (CFCs) had not been regulated?, Atmos. Chem. Phys., 9, 2113–2128, doi:10.5194/acp-9-2113-2009, 2009.
15
Prather, M. J. and Hsu, J.: Coupling of nitrous oxide and methane by global atmospheric chem-istry, Science, 330, 952, doi:10.1126/science.1196285, 2010.
Prather, M. J., Holmes, C. D., and Hsu, J.: Reactive greenhouse gas scenarios: systematic exploration of uncertainties and the role of atmospheric chemistry, Geophys. Res. Lett., 39, 09803, doi:10.1029/2012GL051440, 2012.
20
Price, C., Penner, J., and Prather, M.: NOxfrom lightning, 1, Global distribution based on light-ning physics, J. Geophys. Res., 102, 5929–5941, 1997.
Ravishankara, A. R., Daniel, J. S., and Portmann, R. W.: Nitrous oxide (N2O): the dominant ozone-depleting substance emitted in the 21st century, Science, 326, 123, doi:10.1126/science.1176985, 2009.
25
Rohrer, F. and Berresheim, H.: Strong correlation between levels of tropospheric hydroxyl radi-cals and solar ultraviolet radiation, Nature, 442, 184–187, 2006.
Shindell, D. T., Faluvegi, G., Unger, N., Aguilar, E., Schmidt, G. A., Koch, D. M., Bauer, S. E., and Miller, R. L.: Simulations of preindustrial, present-day, and 2100 conditions in the NASA GISS composition and climate model G-PUCCINI, Atmos. Chem. Phys., 6, 4427–4459,
30
ACPD
12, 25551–25572, 2012Ozone depletion and aerosols
A. Voulgarakis et al.
Title Page
Abstract Introduction
Conclusions References
Tables Figures
◭ ◮
◭ ◮
Back Close
Full Screen / Esc
Printer-friendly Version Interactive Discussion
Discussion
P
a
per
|
Dis
cussion
P
a
per
|
Discussion
P
a
per
|
Discussio
n
P
a
per
|
Shindell, D. T., Faluvegi, G., Koch, D. M., Schmidt, G. A., Unger, N., and Bauer, S. E.: Improved attribution of climate forcing to emissions, Science, 326, 716, doi:10.1126/science.1174760, 2009.
Shindell, D. T., Pechony, O., Voulgarakis, A., Faluvegi, G., Nazarenko, L., Lamarque, J.-F., Bow-man, K., Milly, G., Kovari, B., Ruedy, R., and Schmidt, G.: Interactive ozone and methane
5
chemistry in GISS-E2 historical and future climate simulations, Atmos. Chem. Phys. Dis-cuss., 12, 23513–23602, doi:10.5194/acpd-12-23513-2012, 2012.
Son, S.-W., Polvani, L. M., Waugh, D. W., Akiyoshi, H., Garcia, R., Kinnison, D., Pawson, S., Rozanov, E., Shepherd, T. G., and Shibata, K.: The impact of stratospheric ozone recovery on the Southern Hemisphere westerly jet, Science, 320, 1486–1489, 2008.
10
Tang, X., Wilson, S. R., Solomon, K. R., Shao, M., and Madronich, S.: Changes in air quality and tropospheric composition due to depletion of stratospheric ozone and interactions with climate, Photochem. Photobiol. Sci., 10, 280–291, 2011.
Thompson, A. M.: The oxidizing capacity of the earth’s atmosphere: probable past and future changes, Science, 256, 1157–1165, 1992.
15
Toumi, R., Bekki, S., and Law, K. S.: Indirect influence of ozone depletion on climate forcing by clouds, Nature, 372, 348–351, 1994.
Unger, N., Shindell, D. T., Koch, D. M., and Streets, D. G.: Cross influences of ozone and sulfate precursor emissions changes on air quality and climate, Proc. Natl. Acad. Sci., 103, 4377– 4380, 2006.
20
Velders, G. J. M., Andersen, S. O., Daniel, J. S., Fahey, D. W., and McFarland, M.: The impor-tance of the Montreal Protocol in protecting climate, Proc. Natl. Acad. Sci., 104, 4814–4819, 2007.
Voulgarakis, A., Wild, O., Savage, N. H., Carver, G. D., and Pyle, J. A.: Clouds, photolysis and regional tropospheric ozone budgets, Atmos. Chem. Phys., 9, 8235–8246,
doi:10.5194/acp-25
9-8235-2009, 2009.
Voulgarakis, A., Hadjinicolaou, P., and Pyle, J. A.: Increases in global tropospheric ozone follow-ing an El Ni ˜no event: examinfollow-ing stratospheric ozone variability as a potential driver, Atmos. Sci. Lett., 12, 228–232, 2011
Voulgarakis, A., Naik, V., Lamarque, J. F., Shindell, D. T., Young, P. J., Prather, M. J., Wild, O.,
30
ACPD
12, 25551–25572, 2012Ozone depletion and aerosols
A. Voulgarakis et al.
Title Page
Abstract Introduction
Conclusions References
Tables Figures
◭ ◮
◭ ◮
Back Close
Full Screen / Esc
Printer-friendly Version Interactive Discussion
Discussion
P
a
per
|
Dis
cussion
P
a
per
|
Discussion
P
a
per
|
Discussio
n
P
a
per
|
Stevenson, D. S., Strode, S. A., Sudo, K., Szopa, S., and Zeng, G: Simulations of present-day and future OH and methane lifetime in the ACCMIP project, Atmos. Chem. Phys. Discuss., in preparation, 2012.
Wild, O. and Palmer, P. I.: How sensitive is tropospheric oxidation to anthropogenic emissions?, Geophys. Res. Lett., 35, 22802, doi:10.1029/2008GL035718, 2008.
5
Wild, O., Zhu, X., and Prather, M. J.: Fast-J: accurate simulation of in- and
below-cloud photolysis in global chemical models, J. Atmos. Chem., 37, 245–282, doi:10.1023/A:1006415919030, 2000.
Zeng, G., Morgenstern, O., Braesicke, P., and Pyle, J. A.: Impact of stratospheric ozone recovery on tropospheric ozone and its budget, Geophys. Res. Lett., 37, 09805,
10
ACPD
12, 25551–25572, 2012Ozone depletion and aerosols
A. Voulgarakis et al.
Title Page
Abstract Introduction
Conclusions References
Tables Figures
◭ ◮
◭ ◮
Back Close
Full Screen / Esc
Printer-friendly Version Interactive Discussion
Discussion
P
a
per
|
Dis
cussion
P
a
per
|
Discussion
P
a
per
|
Discussio
n
P
a
per
|
Table 1.Specifications of the various model sensitivity experiments performed. The year in-dicated reflects the period to which the levels of each variable correspond. “SST/SI” refers to sea surface temperatures and sea-ice conditions used to drive the experiments. “Emissions” refers to anthropogenic and biomass burning ozone precursor (NOx, CO, NMVOC) and aerosol emissions.
CFCs N2O CH4 SSTs/SI/CO2 Emissions
BASE 2000 2000 2000 2000 2000
1960 CFCs 1960 2000 2000 2000 2000
2100 CFCs 2100 2000 2000 2000 2000
WACFCs WA 2000 2000 2000 2000
1850 N2O 2000 1850 2000 2000 2000
ACPD
12, 25551–25572, 2012Ozone depletion and aerosols
A. Voulgarakis et al.
Title Page
Abstract Introduction
Conclusions References
Tables Figures
◭ ◮
◭ ◮
Back Close
Full Screen / Esc
Printer-friendly Version Interactive Discussion
Discussion
P
a
per
|
Dis
cussion
P
a
per
|
Discussion
P
a
per
|
Discussio
n
P
a
per
|
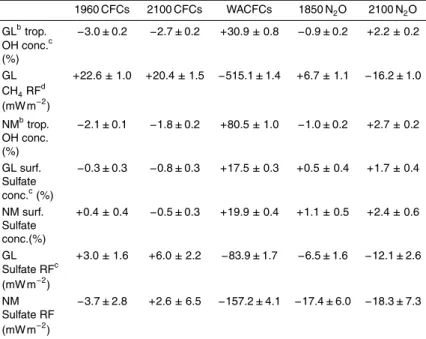
Table 2.Differences in annual mean tropospheric OH concentration, surface sulfate aerosol concentration, methane and sulfate aerosol Top-Of-the-Atmosphere (TOA) shortwave Radiative Forcing (RF), between the sensitivity experiments and the BASE runa.
1960 CFCs 2100 CFCs WACFCs 1850 N2O 2100 N2O
GLbtrop. −3.0±0.2 −2.7±0.2 +30.9±0.8 −0.9±0.2 +2.2±0.2
OH conc.c (%)
GL +22.6±1.0 +20.4±1.5 −515.1±1.4 +6.7±1.1 −16.2±1.0
CH4RFd
(mW m−2)
NMbtrop. −2.1±0.1 −1.8±0.2 +80.5±1.0 −1.0±0.2 +2.7±0.2
OH conc. (%)
GL surf. −0.3±0.3 −0.8±0.3 +17.5±0.3 +0.5±0.4 +1.7±0.4
Sulfate conc.c(%)
NM surf. +0.4±0.4 −0.5±0.3 +19.9±0.4 +1.1±0.5 +2.4±0.6
Sulfate conc.(%)
GL +3.0±1.6 +6.0±2.2 −83.9±1.7 −6.5±1.6 −12.1±2.6
Sulfate RFc (mW m−2)
NM −3.7±2.8 +2.6±6.5 −157.2±4.1 −17.4±6.0 −18.3±7.3
Sulfate RF (mW m−2)
aSeven years from each simulation where averaged in order to increase the signal-to-noise ratio. The
uncertainties are±1σstandard deviations of the mean, based on the fluctuations among the different years in each simulation.
bGL
=global; NM=northern midlatitudes (20–60◦N).
cMean tropospheric OH concentrations used for calculating the di
fferences are mass-weighted, while mean surface sulfate concentrations and mean sulfate radiative forcings are area-weighted.
dWe infer approximate global methane changes o
ACPD
12, 25551–25572, 2012Ozone depletion and aerosols
A. Voulgarakis et al.
Title Page Abstract Introduction Conclusions References Tables Figures ◭ ◮ ◭ ◮ Back Close
Full Screen / Esc
Printer-friendly Version Interactive Discussion Discussion P a per | Dis cussion P a per | Discussion P a per | Discussio n P a per | latitude
-60 -40 -20 0 20 40 60
latitude -60 -40 -20 0 20 40 60
Pressure (hPa) 2.7 2.4 2.1 1.8 1.5 1.2 0.9 0.6 0.3 (x10-5 s-1)
16 12 8 4 0 4 8 12 14 (%) latitude
-60 -40 -20 0 20 40 60 16 12 8 4 0 -4 -8 -12 -16 (%) latitude
-60 -40 -20 0 20 40 60 (%) 160 120 80 40 0 -40 -80 -120 -160 latitude
-60 -40 -20 0 20 40 60 16 12 8 4 0 -4 -8 -12 -16 16 12 8 4 0 -4 -8 -12 -16 (%) latitude
-60 -40 -20 0 20 40 60
(%) a b c d e f 200 400 600 800 1000 Pressure (hPa) 200 400 600 800 1000 Pressure (hPa) 200 400 600 800 1000 Pressure (hPa) 200 400 600 800 1000 Pressure (hPa) 200 400 600 800 1000 Pressure (hPa) 200 400 600 800 1000
ACPD
12, 25551–25572, 2012Ozone depletion and aerosols
A. Voulgarakis et al.
Title Page
Abstract Introduction
Conclusions References
Tables Figures
◭ ◮
◭ ◮
Back Close
Full Screen / Esc
Printer-friendly Version Interactive Discussion
Discussion
P
a
per
|
Dis
cussion
P
a
per
|
Discussion
P
a
per
|
Discussio
n
P
a
per
|
latitude
a
b
c
d
(%) (%)
(%)
20
60
20
60
20
60
20
60
20
60
20
60
20
60
20
60
(%)
latitude
latitude
0 5 10 15 20 25 30 35 40
8 16 24 32 40 48 56 64 72
latitude
25 50 75 100 125 150 175 200 225
-58 -56 -54 -52 -50 -48 -46 -44 -42
ACPD
12, 25551–25572, 2012Ozone depletion and aerosols
A. Voulgarakis et al.
Title Page
Abstract Introduction
Conclusions References
Tables Figures
◭ ◮
◭ ◮
Back Close
Full Screen / Esc
Printer-friendly Version Interactive Discussion
Discussion
P
a
per
|
Dis
cussion
P
a
per
|
Discussion
P
a
per
|
Discussio
n
P
a
per
|
-0.24 -0.18 -0.24 -0.06 0.00 0.06 0.12 0.18 0.24
200
400
600
800
1000
latitude
Pressure (hPa)
-1.6 -1.2 -0.8 -0.4 0.0 0.4 0.8 1.2 1.6
200
400
600
800
1000
Pressure (hPa)
-60 -40 -20 0 20 40 60
-60 -40 -20 0 20 40 60
latitude
(μg m-3)
(kg s-1)
b a
ACPD
12, 25551–25572, 2012Ozone depletion and aerosols
A. Voulgarakis et al.
Title Page
Abstract Introduction
Conclusions References
Tables Figures
◭ ◮
◭ ◮
Back Close
Full Screen / Esc
Printer-friendly Version Interactive Discussion
Discussion
P
a
per
|
Dis
cussion
P
a
per
|
Discussion
P
a
per
|
Discussio
n
P
a
per
|
latitude
-24 -18 -12 -6 0 6 12 18 24
latitude
(%)
-8 -6 -4 -2 0 2 4 6 8
Change in sulfate aerosol shortwave radiative forcing (2100N2O - BASE)
Change in sulfate aerosol shortwave radiative forcing (WACFCs - BASE)
(%)
b a