Acta Scientiarum
http://www.uem.br/acta ISSN printed: 1679-9275
ISSN on-line: 1807-8621
Doi: 10.4025/actasciagron.v37i3.19065
TRS value of sugarcane according to bioenergy and sugar levels
Tadeu Alcides Marques1*, Larissa Carolina Gonçalves Neves1, Erick Malheiros Rampazo1, Elvis Lima Deltrejo Junior1, Fernando Caetano de Souza1 and Patricia Angelica Alves Marques2
1
Centro de Estudos Avançados em Bioenergia e Tecnologia Sucroalcooleira, Universidade do Oeste Paulista, Rod. Raposo Tavares, km 572, 19067-175, Presidente Prudente, São Paulo, Brazil. 2
Departamento de Engenharia de Biossistemas, Instituto Nacional de Ciência e Tecnologia em Engenharia da Irrigação, Escola Superior de Agricultura Luiz de Queiroz, Universidade de São Paulo. Piracicaba, São Paulo, Brazil. *Author for correspondence. E-mail: [email protected]
ABSTRACT. In the specific case of sugarcane, producers in Brazil are currently paid by the content of total recoverable sugars (TRS) in the raw material when it reaches the industry, according to CONSECANA: TRS = 9.6316 *PC +9.15 * RSS, where PC is the Pol in cane (apparent sucrose) and RSS are reducing sugars in sugarcane (glucose + fructose). The objective of the project was to propose changes in the procedures used to mathematically determine the TRS, estimating the calorific value of moist cake and weight of moist cake. The final model is then proposed: TRS = 25.9892 + 0.02172*CVmc*WMC+0.536*WMC – 4.14*CVmc + + 4.8158*PC + 4.575*RSS. Thus we obtain the TRS calculated according to the calorific value of moist cake (CVmc), weight of moist cake (WMC), Pol cane (PC) and the reducing sugars in sugarcane (RSS). This form is included in the estimation of TRS, the calorific value of moist cake, which reflects the bioenergy of fiber, weight of moist cake that estimates sugarcane fiber, in addition to existing factors Pol cane and reducing sugars in sugarcane. In the proposed model, the estimated values of TSR were 11.08% higher than the estimated values in the CONSECANA model.
Keywords:Saccharum, quality, biomass.
Valor de ATR da cana-de-açúcar em função de teores de bioenergia e açúcar
RESUMO. No caso particular da cana-de-açúcar, os produtores são remunerados atualmente no Brasil pelo teor de açúcares totais recuperáveis (ATR) que a matéria-prima apresenta ao chegar à indústria, segundo CONSECANA: ATR = 9,6316*PC+9,15*AR, onde PC é a Pol da cana (sacarose aparente) e ARC são os açúcares redutores da cana (glicose +frutose). O objetivo do projeto foi propor alterações nos procedimentos utilizados para determinação matemática do ATR, estimando pelo poder calorífico do bolo úmido e peso do bolo úmido. O modelo final proposto fica então: ATR = 25,9892 + 0,02172* PCbu* PBU +0,536* PBU – 4,14* PCbu + 4,8158*PC + 4,575* ARC. Assim tem-se o ATR calculado em função do Poder calorífico do bolo úmido (PCbu), peso do bolo úmido (PBU), Pol da cana (PC) e Açúcares Redutores da Cana (ARC). Desta forma inclui-se na estimativa dos valores de ATR o Poder calorífico do bolo úmido, que reflete a bioenergia da fibra, peso do bolo úmido que estima a fibra da cana, alem dos fatores já existentes, Pol da cana e Açúcares Redutores da cana. O modelo proposto estimou valores de ATR 11,08% superiores que o modelo Consecana.
Palavras-chave:Saccharum, qualidade, biomassa.
Introduction
Biomass is an important energy source for the human race. It is the natural way of storing a fraction of incident solar energy in the planet, and even fossil fuels originated from biomass. The challenge facing humanity is to seek solutions for ever more efficient use of this natural resource (ROSSETO, 2012).
Analyzing the waste products from the most important commercial monocultures in the country, sugarcane stands out due to the abundance of straw residue (green leaves, dry leaves and tops) (SOUSA; MACEDO, 2010).
Acta Scientiarum. Agronomy Maringá, v. 37, n. 3, p. 343-357, July-Sept., 2015 et al., 2010). And according to Inman-Bamber et al.
(2011), some sugarcane clones can yield higher amounts of fiber without significant losses in sucrose levels, but possibly reducing total recoverable sugars (TRS), compromising quality-based payment. According to Rosseto (2012), a more efficient manner to compare plants according to quality of produced biomass is to convert all biomass into a single energy unit, which could be Joule (J); Mega Joule (MJ); Giga Joule (GJ) or ton of oil equivalent (1 toe = 42 GJ).
The bioelectricity generated from sugarcane bagasse has gained importance as a product in Brazilian power plants (MARTINES FILHO et al., 2006). In 2008, about 30 plants in Brazil negotiated an average of 544 MW for sale annually over 15 years. That volume generated US$ 389.6 million in annual revenue (SOUSA; MACEDO, 2010).
With an increase of 4.3% over the previous harvest, sugarcane production in Brazil has expanded to an expected 8.5 million hectares in producing states for the 2012/13 season, with São Paulo state leading the pack with 4.42 million hectares. Total projections call for 596.63 million tons of sugarcane to be milled in the 2012/13 harvest, a 6.5% increase over the 2011/12 season, meaning that 36.3 million more tons will be milled than during the previous harvest (CONAB, 2012).
The essence of the current payment system (CONSECANA) is to reward sugarcane quality based on the prices of the final products obtained from this raw material; as such, there is no single price per ton, with variations according to climate factors, soil, variety, farming practices and marketing mix of the industrial unit. Soil tillage for crop placement can result in higher growth rates and lead to changes in quality at harvest time (TAVARES et al., 2010). Mechanized sugarcane harvest creates straw residue, which depending on the handling system can result in lower biomass and bioenergy production (CAMPOS et al., 2010). Revisions to the payment system are important to eliminate distortions and stimulate an improvement in the quality of raw materials (SACHS, 2007).
The research hypothesis was that the energy value of wet bagasse can create an additional parameter to calculate TRS in order to obtain a fair compensation for the material delivered at processing plants.
The objective of the project was to propose changes in the procedures used to mathematically determine TRS, estimated by the calorific value of moist cake and weight of moist cake, in addition to previously used factors – Calorific Value (CV), RSS
and Industrial Fiber. The intent is to collaborate towards a more accurate payment formula for sugarcane – one that does not necessarily imply higher prices, but rather values that better fit existing profit margins for the different by-products produced from the raw material.
Material and methods
A total of 128 sugarcane samples from the experiment were analyzed – 64 in 2010, and 64 in 2011. The soil in the experiments was characterized as a Dystrophic Red-Yellow Argisol, typical to moderate, with medium-clayish texture (SANTOS et al., 2006). The climate in the region is classified as Aw, with rainy summers and dry winters.
A DDS Cal2K bomb calorimeter was used to analyze the gross calorific value, in accordance with criteria set by the Brazilian Association for Technical Standards – ABNT in rule NBR 8693/84 (VALE et al., 2007). The analysis was carried out in moist cake obtained after milling (FERNANDES, 2003).
The Hawaiian method was used to analyze real fiber (VALSECHI, 1968).
All data were charted and subjected to correlation analysis and graph creation using Microcal Origin 6.0 mathematical software.
Results and discussion
Considering the distribution of energy in sugarcane, the following model can be written:
materials organics others sugars
fiber
sugarcane
ε
ε
ε
ε
= + + (1)In which:
εsugarcane = Total energy in sugarcane
εfiber = energy of fiber in the sugarcane
εsugars = energy of sugars in the sugarcane
εother organic materials = energy of non-sugars in the
sugarcane
As the bioenergy of a material is determined by the gross calorific value, we get:
5 , 90 * *
100
% sugar
fiber sugarcane
CV TRS CV
sugarcane F
CV
= +100 * organic sugar
-non CVnso
+
(2)
CVsugarcane = Calorific value of sugarcane
F%sugarcane = Values of fiber in sugarcane in (%)
CVfiber = Calorific value of sugarcane fiber
Value of sugarcane and bioenergy 349
CVnso = Calorific value of non-sugar organic
materials
As the level of non-sugar organic materials in sugarcane is 1.16%, TRS values are near 12% of sugarcane, and fiber averages 12%, non-organic materials represent 4.83% of the sum of TRS plus Fiber, making it possible to exclude it from the formula or leave it as a constant C:
( C)
CV TRS CV
sugarcane F
CVsugarcane= fiber + sugar +
5 , 90 * *
100
% (3)
Isolating variable TRS, we get:
( )
sugar fiber
sugarcane
CV C CV sugarcane F
CV
TRS * * 90,5
100 %
− −
= (4)
The Calorific value of sugar (CVsugar) used was = 17 MJ kg-1, the Calorific value of non-sugar organic
materials (CVnso) used was = 20 MJ kg-1.
Using the data in Table 1, regressions were done using Origin 6.0 software.
Figure 1 presents the regression between the Calorific value of sugarcane obtained from analyses directly in the material and Calorific value of sugarcane calculated with the value of the Calorific value of moist cake obtained after pressing for analysis. Despite the low value of the coefficient of determination r2, it can be observed that the regression has a significant value at 1%. This denotes a strong correlation between the variables, indicating the possibility of calculating the Calorific value of sugarcane by performing analyses in the fibrous material (moist cake) produced by preparing the sample for payment purposes. In this case, as cited by Sachs (2007), revisions to the payment system can result in better quality sugarcane and stimulate producers; however, the COSECANA payment system is complex and quite structured, with the possibility of adding certain factors as long as they are mutually interesting for mill owners and sugarcane suppliers.
Table 1. Results obtained for variables Analyzed calorific value of sugarcane, Calculated calorific value of sugarcane, Real fiber, Fiber press method, Calorific value of real fiber, and Calorific value of moist cake.
(Figura 1) (Figura 2) (Figura 3)
Calorific value of sugarcane Analyzed
Gj kg-1
Calorific value of sugarcane Calculated with Moist cake
Gj kg-1
Real fiber (%)
Fiber - Press Calculated
Calorific value Real fiber – analyzed
(Mj kg-1)
Calorific value of moist cake
(Mj kg-1)
3.25 2.30 9.71 11.48 18.08 8.69
3.70 3.03 10.65 11.35 18.09 11.57
3.75 2.79 11.23 11.19 17.46 10.80
4.77 2.04 9.62 10.74 21.19 8.27
5.09 2.69 10.24 11.53 18.39 10.10
4.10 3.07 10.32 12.21 27.45 10.82
4.49 2.62 10.07 11.24 17.69 10.12
4.76 2.53 10.43 11.01 20.33 10.00
3.88 3.62 11.09 10.66 18.01 14.80
5.77 2.91 11.44 13.51 18.74 9.21
6.00 3.45 11.26 14.13 16.21 10.42
.
.
7.65 2.69 9.62 12.26 18.16 9.46
5.27 2.44 11.32 13.37 18.40 7.82
6.34 2.27 13.02 12.20 18.12 8.03
6.47 2.93 11.70 13.40 16.42 9.36
7.90 3.18 12.26 12.78 21.75 10.69
4.64 2.69 11.68 12.31 18.24 9.42
5.86 3.36 11.20 12.60 20.28 11.48
5.35 1.91 12.24 10.77 18.12 7.72
4.86 2.68 11.66 11.98 18.51 9.66
5.14 3.39 13.72 13.31 18.70 10.90
8.08 2.72 12.26 13.27 25.80 8.79
6.47 3.14 12.06 14.11 18.32 9.48
5.56 3.18 10.68 13.21 18.57 10.30
5.10 3.36 11.04 14.06 26.60 10.18
8.72 3.83 11.88 13.53 18.81 12.11
5.49 2.82 11.58 12.56 17.09 9.64
6.19 3.68 14.22 13.95 20.67 11.26
8.46 3.25 13.00 14.35 18.40 9.64
5.61 2.45 11.52 12.32 18.71 8.57
6.12 2.93 9.72 13.16 14.94 9.54
5.85 2.77 13.18 13.04 18.64 9.11
5.58 2.99 9.82 12.95 17.15 9.91
7.40 4.27 11.62 12.79 18.17 14.33
6.73 2.97 11.24 13.17 18.60 9.67
5.53 2.76 11.18 12.09 26.73 9.83
Acta Scientiarum. Agronomy Maringá, v. 37, n. 3, p. 343-357, July-Sept., 2015 The inclusion of the Calorific value of sugarcane
should occur naturally, as Rosseto (2012) reports that the best way to compare plants is by their bioenergy, and their assessment to that end should be simple and without great changes in methodology.
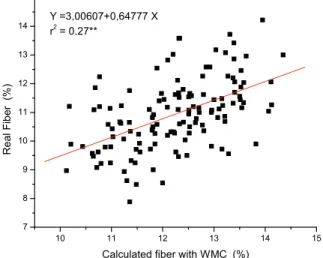
Figure 2 presents the regression between real fiber analyzed directly in sugarcane and Industrial fiber calculated using the weight of moist cake (WMC). Despite the low value for the coefficient of determination r2, it can be seen that the regression has statistical value at 1%. This indicates a strong correlation between the variables. This consideration allowed CONSECANA to incorporate the calculation of Industrial fiber through WMC into the model already in place in Brazil.
Figure 1. Mathematical regression model of the Calculated calorific value of sugarcane with WMC and the Calorific value of sugarcane by direct analysis.
10 11 12 13 14 15
7 8 9 10 11 12 13 14 15
Y =3,00607+0,64777 X r2
= 0,27**
Re
al
Fib
e
r (%
)
Calculated fiber with WMC (%)
Figure 2. Mathematical regression model between Calculated fiber with WMC and Real fiber in sugarcane.
Figure 3 presents the regression between the Calorific value of real fiber analyzed directly in sugarcane fiber and the Calorific value of moist cake
(WB). It can be observed that the regression is statistically significant at 1%. This indicates a strong correlation between the variables.
12 14 16 18 20 22 24 26 28 7
8 9 10 11
12 Y =7,62052+0,12002 X
r2 = 0,12**
C
a
lo
ri
fi
c v
a
lu
e
of
Re
al
f
ibe
r (M
J k
g
-1)
Calorific value of moist cake (MJ kg-1)
Figure 3. Mathematical regre ssion model between Calorific value of moist cake and the Calorific value of Real fiber, determined in the material used to analytically determine real fiber.
In equation 4, the value of CVcane (the first
independent variable) can be calculated through the calorific value of moist cake, as shown in Figure 1; those data showed a correlation coefficient at 1%. The second independent variable shown in this model is F%Cane, which from Figure 2 can be calculated using the Weight of Moist cake (WMC), with a correlation coefficient at 1%, which is already used by the CONSECANA system. The third independent variable, CVfiber, can be calculated from Figure 3 using the calorific value of moist cake. CVsugar is constant,
equal to 17 MJ kg-1. Thus, the TRS value can be
estimated by a mathematical model using the variables WMC and CVmc. As Figures 1, 2 and 3 show values for the regression coefficient of determination r2 that are significant at 1%, it was decided to perform a multiple regression between TRS, Calorific value of sugarcane, calculated with the calorific value of moist cake, Fiber calculated with the weight of moist cake and calorific value of moist cake.
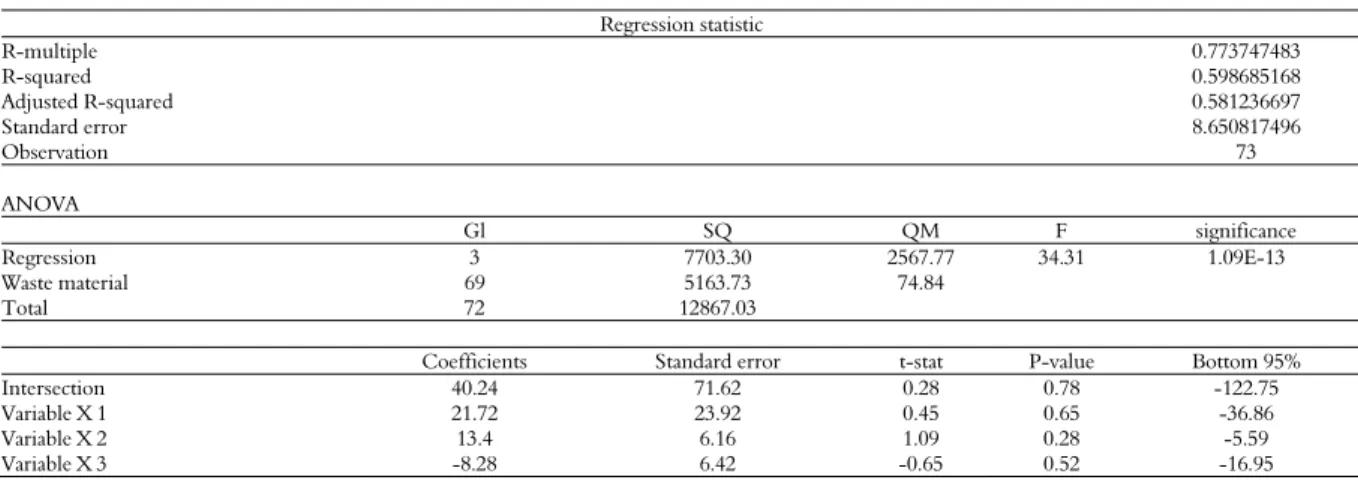
The following model is obtained (Table 2), adjusted to the values:
Y = 40.24 + 21.72*X1 + 13.4*X2 - 8.28*X3 (5)
in which:
Y = Total recoverable sugars, estimated; X1 = Calorific value of sugarcane calculated with the calorific value of moist cake; X2 = Fiber calculated with the moist cake obtained during pressing; X3 = Calorific value of moist
cake; R2 = 0.60**; CV = 9.17% between calculated
Value of sugarcane and bioenergy 351
Table 2. Values of r, F-test and Coefficients of the multiple regression model between TRS (Y), Calorific value of sugarcane, calculated with the calorific value of moist cake (X1), Fiber calculated with the moist cake obtained in pressing (X2) and calorific value of moist cake (X3).
Regression statistic
R-multiple 0.773747483
R-squared 0.598685168
Adjusted R-squared 0.581236697
Standard error 8.650817496
Observation 73
ANOVA
Gl SQ QM F significance
Regression 3 7703.30 2567.77 34.31 1.09E-13
Waste material 69 5163.73 74.84
Total 72 12867.03
Coefficients Standard error t-stat P-value Bottom 95%
Intersection 40.24 71.62 0.28 0.78 -122.75
Variable X 1 21.72 23.92 0.45 0.65 -36.86
Variable X 2 13.4 6.16 1.09 0.28 -5.59
Variable X 3 -8.28 6.42 -0.65 0.52 -16.95
It has also (CONSECANA, 2011):
Y = 9. 6316*X4 + 9.15*X5 (6)
In which:
- X4 = Pol in Cane (PC);
- X5 = Reducing sugars in sugarcane (RSS). By adding equations 5 and 6, we get:
Y = 40.24 + 21.72*X1 + 13.4*X2 - 8.28*X3 (5)
Y = 9. 6316*X4 + 9.15*X5 (6)
2Y = 40.24 + 21.72*X1 + 13.4*X2 - 8.28*X3 + 9. 6316*X4 + 9.15*X5 (7)
2
X5) * 9.15 X4 * 6316 9. X3 * 8.28 -X2 * 13.4 X1 * 21.72
40.24+ + + +
=
Y (8)
Y = 20.12 + 10.86*X1 + 6.70*X2 – 4.14*X3 + 4.8158*X4 + 4.575*X5 (9)
or,
TRS = 20.12 + 10.86*PCCCCVMC + 6.70*Fpmc – 4.14*CVmc+ 4.8158*PC + 4.575*RSS
(10)
The press methodology used 500 g of shredded sugarcane; WMC is obtained after pressing, ranging from 110 to 160 g. In order to transform the calorific value of WMC into the calorific value of sugarcane, the following model should be used:
WMC * ) (
PCCCCVMC= CVmc500
(11)
In the CONSECANA methodology, the industrial fiber calculated with WMC follows the model below:
Findustrial = 0.08*WMC + 0.876 (12)
The final model is therefore:
TRS = 20.12 + 10.86* (CVmc500 )*WMC+
6.70*( 0.08*WMC+0.876) – 4.14*CVmc ++
4.8158*PC + 4.575*RSS
(13)
We therefore obtain TRS calculated as a function of the Calorific value of moist cake (CVmc), weight of moist cake (WMC), Pol in sugarCane (PC) and Reducing Sugars in Sugarcane (RSS), equations 14.
TRS = 25.9892 + 0.02172*CVmc* WMC+0.536*WMC – 4.14*CVmc + 4.8158*PC + 4.575*RSS
(14)
Acta Scientiarum. Agronomy Maringá, v. 37, n. 3, p. 343-357, July-Sept., 2015 Table 3. TRS values calculated with the original CONSECANA model, confronted against the proposed model, which takes into account the calorific value of moist cake and the amount of moist cake produced in 0.5kg of pressed sugarcane.
TRS TRSproposed dev. dev.2
PC RSS PCCCCVMC Fpmc CVmc
123.53 147.85 24.32 591.42 12.08 0.79 2.30 11.48 08.69
130.23 146.28 16.05 257.51 12.73 0.83 3.03 11.35 11.57
119.18 140.23 21.06 443.32 11.57 0.84 2.79 11.19 10.80
138.17 149.07 10.90 118.89 13.68 0.70 2.04 10.74 08.27
136.48 153.00 16.52 272.95 13.47 0.74 2.69 11.53 10.10
140.21 160.52 20.31 412.48 13.92 0.67 3.07 12.21 10.82
143.35 153.68 10.32 106.56 14.20 0.72 2.62 11.24 10.12
143.39 151.73 08.35 069.71 14.24 0.68 2.53 11.01 10.00
124.76 131.96 07.20 051.90 12.19 0.81 3.62 10.66 14.80
126.24 135.15 08.90 079.29 12.45 0.69 2.35 10.18 10.09
120.60 139.04 18.44 339.97 11.72 0.84 2.05 10.63 08.42
118.95 130.28 11.33 128.34 11.56 0.83 3.53 10.71 14.35
110.59 134.19 23.60 556.95 10.62 0.90 2.59 10.93 10.28
103.07 122.34 19.28 371.64 9.80 0.95 3.38 10.64 13.86
115.07 130.49 15.41 237.56 11.10 0.89 2.12 10.12 09.19
115.60 142.53 26.92 724.82 11.24 0.81 2.11 11.25 08.13
124.89 144.08 19.18 368.05 12.16 0.85 2.00 10.88 07.98
142.62 162.43 19.81 392.43 14.19 0.65 2.74 12.16 09.72
125.84 144.21 18.37 337.36 12.93 0.15 2.60 11.16 10.12
119.53 142.84 23.31 543.58 11.57 0.89 3.09 11.55 11.60
113.63 131.62 17.99 323.56 11.06 0.78 2.36 10.44 09.87
.. .. .. .. .. .. .. .. ..
140.58 157.00 16.42 269.71 16.32 0.00 2.90 11.80 10.62
147.73 161.78 14.04 197.23 15.34 0.00 2.67 11.82 09.77
150.38 167.97 17.59 309.31 14.92 0.73 2.68 12.30 09.40
136.13 152.46 16.33 266.82 13.12 1.07 1.68 10.98 06.64
140.81 149.31 08.50 072.33 14.47 0.16 2.27 10.77 09.18
146.01 159.74 13.73 188.57 14.63 0.55 3.23 11.93 11.70
136.75 155.96 19.21 368.91 13.38 0.86 2.60 11.76 09.56
149.50 166.79 17.29 298.81 14.75 0.81 2.93 12.32 10.25
145.75 175.19 29.45 867.05 14.35 0.82 3.24 13.41 10.33
159.85 162.66 02.81 007.92 16.20 0.42 2.71 11.35 10.36
152.04 163.20 11.16 124.57 15.08 0.74 2.77 11.79 10.15
152.67 164.34 11.67 136.18 16.34 0.00 2.82 11.89 10.23
154.72 171.15 16.43 270.02 15.65 0.44 3.00 12.51 10.32
138.41 160.52 22.11 488.87 13.77 0.63 2.89 12.23 10.18
151.49 174.51 23.02 529.92 15.10 0.66 3.02 13.00 09.96
162.85 185.24 22.39 501.32 16.43 0.50 3.18 13.54 10.04
159.70 175.45 15.75 248.14 16.10 0.51 2.46 12.51 08.46
171.75 176.18 04.44 019.67 17.36 0.50 2.77 12.09 09.89
178.67 184.21 05.53 030.63 18.11 0.47 2.69 12.51 09.25
149.37 172.35 22.98 528.20 15.01 0.52 3.13 12.92 10.39
179.49 182.83 03.34 011.13 18.16 0.50 2.67 12.33 9.34
179.64 186.08 06.44 041.52 18.14 0.54 3.18 12.80 10.67
172.16 178.92 06.76 045.74 17.39 0.51 3.06 12.44 10.60
150.66 206.94 56.28 3167.42 15.11 0.56 2.62 12.40 09.40
averages
140.30 156.47
VC = 11.08%
Conclusion
It is possible to estimate TRS values using the Calorific value of moist cake, weight of moist cake, Pol in cane and Reducing Sugars in sugarcane.
The proposed model estimated TRS values to be 11.08% higher than in the CONSECANA model, due to non-sugar organic materials.
Acknowledgements
To FAPESP for providing the technical and financial feasibility for the project.
To CENTEC, Center for Advanced Studies in Bioenergy and Sugar-Ethanol Technology at UNOESTE, for the support in the development of the research study.
References
CAMPOS, L. H. F.; CARVALHO, S. J. P.; CHRISTOFFOLETI, P. J.; FORTES, C.; SILVA, J. S. Sistemas de manejo da palhada influenciam acúmulo de biomassa e produtividade da cana-de-açúcar (var. RB855453). Acta Scientiarum. Agronomy, v. 32, n. 2, p. 345-350, 2010.
CONAB-Companhia Nacional de Abastecimento.
Acompanhamento de safra brasileira: cana-de-açúcar, segundo levantamento. agosto/2012 - Brasília: Conab 2012.
Value of sugarcane and bioenergy 353
FERNANDES, A. C. Cálculos na agroindústria da cana-de-açúcar. 2. ed. Piracicaba: EME/STAB, 2003.
INMAN-BAMBER, N. G.; JACKSON, P. A.; HEWIT, M. Sucrose accumulation in sugarcane stalks does not limit photosynthesis and biomass production. Crop and Pasture Science, v. 62, n. 10, p. 848-858, 2011.
LEÓN, R. G.; GILBERT, R. A.; KORNDORFER, P. H.; COMSTOCK, J. C. Selection criteria and performance of energycane clones (Saccharum spp. × S. spontaneum) for biomass production under tropical and sub-tropical Conditions. Ceiba, v. 51, n. 1. p. 11-16. 2010.
MARTINES-FILHO, J.; BURNQUIST, H. L.; VIAN, C. E. F. Bioenergy and the Rise of Sugarcane-Based Ethanol in Brazil. Choices. 2nd quarter, v. 21, n. 2. p. 91-96, 2006.
ROSSETO, R. A bioenergia, a cana energia e outras culturas energéticas. Pesquisa e Tecnologia, v. 9, n. 1, p. 1-6, 2012. SACHS, R. C. C. Remuneração da tonelada de cana-de-açúcar no Estado de São Paulo. Informações Econômicas, v. 37, n. 2, p. 55-66. 2007.
SANTOS, H. G.; JACOMINE, P. K. T.; ANJOS, L. H. C.; OLIVEIRA, V. A.; OLIVEIRA, J. B.; COELHO, M. R.; LUMBRERAS, J. F.; CUNHA, T. J. F. Sistema brasileiro de classificação de solos. 2. ed. Rio de Janeiro: Embrapa Solos, 2006.
SOUSA, E. L. L.; MACEDO, I. C. Etanol e bioeletricidade: a cana-de-açúcar no futuro da matriz energética. São Paulo: Luc Projetos de Comunicação, 2010.
TAVARES, O. C. H.; LIMA, E.; ZONTA, E. Crescimento e produtividade da cana planta cultivada em diferentes sistemas de preparo do solo e de colheita. Acta Scientiarum. Agronomy, v. 32, n. 1, p. 61-68, 2010. VALE, A. T.; GENTIL, L. V.; GONÇALEZ, J. C. COSTA, A. F. Caracterização energética e rendimento da carbonização de resíduos de grãos de café (Coffea arábica L.) e de madeira (Cedrelinga catenaeformis) Duke. Cerne, v. 13, n. 4. p. 416-420. 2007.
VALSECHI, O. Curso de aperfeiçoamento para fiscalização de análises em cana-de-açúcar. Piracicaba: CALQ, 1968.
Received on November 6, 2012. Accepted on May 4, 2013.