Optical characterization of 316L stainless steel coated with sol
–
gel titania
D.C.L. Vasconcelos
a, E.H.M. Nunes
a,⁎
, A.C.S. Sabioni
b, P.M.P. Vasconcelos
c, W.L. Vasconcelos
a aDept. of Metallurgical and Materials Engineering, Federal University of Minas Gerais—UFMG, Av. Presidente Antônio Carlos, 6627, Campus da UFMG, Escola de Engenharia, Bloco 2, Sala 2230,
Belo Horizonte, MG, CEP: 31270‐901, Brazil
bDept. of Physics, Federal University of Ouro Preto
—UFOP, Ouro Preto, MG, CEP: 35400‐000, Brazil
cSchool of Earth Sciences, The University of Queensland, St Lucia, Qld 4072, Australia
a b s t r a c t
a r t i c l e
i n f o
Article history:
Received 9 April 2012
Received in revised form 17 July 2012 Available online 21 August 2012
Keywords:
Sol–gel; Titanium dioxide; Color;
FTIR; UV–vis
In this work 316L stainless steel substrates were coated with sol–gel derivedfilms by means of the dip-coating technique. Titanium isopropoxide and ethanol were used as chemical precursor and solvent, respectively. The dip-coating step was performed using withdrawal speeds of 6 mm/min, 30 mm/min, and 60 mm/min. Next, the samples were heat treated in air for 30 min at 100 °C, 300 °C, and 400 °C. The processed composites were examined by FTIR and UV–vis spectroscopies. We observed that the materials prepared in this work can exhibit a variety of colors depending on the heat treatment temperature, withdrawal speed, and precursor:solvent molar ratio used in their processing. It is an importantfinding since this behavior could lead to architectural application of these materials. We believe that the changes observed in the UV–vis spectra and the colors of these samples could be related to the variation of the coating thickness as the processing conditions were modified. FTIR tests revealed that the ratio between the intensities of features ascribed to hydroxyl groups and Ti\O bonds decreased as the heat treatment temperature was increased. On the other hand, the ratio between bands related to Ti\O\Ti and Ti\O bonds decreased when the heating temperature was raised from 100 °C to 300 °C.
© 2012 Elsevier B.V. All rights reserved.
1. Introduction
Stainless steel has been widely used because of its remarkable corro-sion resistance at temperatures close to room temperature[1]. Nonethe-less, when it is used for decorative purposes its appearance requires a special attention and its color becomes a major focus. According to Kikuti et al.[2], the standard color of stainless steel (light gray) does not always blend pleasingly with the environment in which it is intended to be used. However, when oxidefilms are present on the surface of stainless steel different colors may eventually be observed due to light interference phenomena occurring at thefilm–air and steel–film interfaces. Several methods are commonly used in the preparation of colored stainless steel samples, including heat treatment and/or thermal oxidation[3,4], electrochemical oxidation[5–8], chemical oxidation[9,10], and sol–gel process[11,12].
Sol–gel coatingfilms is probably one of the most important appli-cations of the sol–gel process[13]. Sol–gel dip coating is potentially less expensive than other conventional thinfilm forming processes
[14,15]. In addition, this technique is very useful for obtaining materials with new active functions since it allows tailoring the microstructure of the preparedfilms[16–20].
It is well established that the presence of oxidefilms on the surface of stainless steel may lead to improving its corrosion resistance[21–23]. The chemical resistance of samples prepared in this work was assessed by Vasconcelos et al.[24]. From potentiodynamic tests they reported that the corrosion rates of these composites were two orders of magni-tude lower than that of the bare stainless steel. Moreover, the presence of the sol–gel titaniafilm led to samples with enhanced passivation potentials.
In this work we obtained sol–gel titania coatings on 316L stainless steel substrates. The titania sols were prepared by hydrolysis and conden-sation of titanium isopropoxide in the presence of water. The as-prepared sols were deposited on 316L stainless steel substrates by means of the dip-coating technique, using different withdrawal speeds. The processed samples were examined by FTIR and UV–vis spectroscopies.
2. Experimental procedure
In this work, 316L stainless steel plates of 2 mm thickness were cut into pieces of 3.0 cm× 3.0 cm. Prior to coating, substrates were polished until 600 mesh, washed with detergent and deionized water, and degreased with acetone. Finally, they were placed in an ultrasonic bath with acetone and dried under hot air.
Sol–gel titania solutions were prepared by the hydrolysis and con-densation of titanium isopropoxide (TIP) in the presence of water. The TIP:H2O molar ratio was kept at 1:16. Ethanol (Eth) was used as
solvent in the syntheses. We used Eth:TIP molar ratios of 16:1 and ⁎ Corresponding author.
E-mail addresses:eduardohmn@yahoo.com.br(E.H.M. Nunes),wlv@demet.ufmg.br
(W.L. Vasconcelos).
0022-3093/$–see front matter © 2012 Elsevier B.V. All rights reserved.
http://dx.doi.org/10.1016/j.jnoncrysol.2012.07.035
Contents lists available atSciVerse ScienceDirect
Journal of Non-Crystalline Solids
64:1. Acetic acid (HAc) and diethanolamine (DEA) were added to the initial solution, keeping the TIP:HAc:DEA molar ratio at 1:1:1. It is well established that DEA can act as stabilizing agent for the titania sol, preventing its precipitation[25–28]. Next, 316L stainless steel plates were coated with the as-prepared sols by means of the dip-coating technique, using withdrawal speeds of 6 mm/min, 30 mm/min, and 60 mm/min. The coated plates were heat treated for 30 min in air at 100 °C, 300 °C, and 400 °C. It is worth mentioning that before their coating the substrates showed the standard color of stainless steel (light gray).
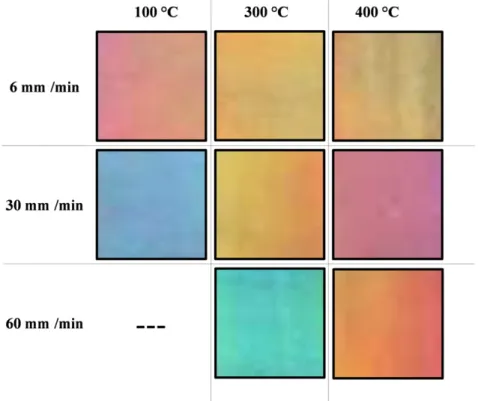
FTIR spectra were taken using a Perkin Elmer Spectrum 1000 spec-trometer, using a variable angle specular reflectance (VASR) accessory. The spectra were collected using an incidence angle of 80°, 4 cm−1 res-olution, and 64 scans. The FTIR spectra showed in this work were obtained using samples prepared by keeping the Eth:TIP molar ratio at 16:1. UV–vis absorption spectra were taken in the spectral range from 200 nm to 800 nm, using a Toshiba U-3510 spectrometer. The UV–vis tests were carried out with an integrating sphere module. The photo-graphs showed inFigs. 8 and 9were obtained using a digital camera (Olympus model Stylus 1010) supported by an adjustable tripod leg.
3. Results
3.1. FTIR spectroscopy
Fig. 1shows the FTIR spectra of titaniafilms prepared in this work. The broad absorption band at about 3300 cm−1is ascribed to stretching vibrations of molecular water and hydroxyl groups[29]. We observed two features at 3250 cm−1 and 3365 cm−1 superimposed onto the band at 3300 cm−1. They have been ascribed, respectively, to asymmet-ric and symmetasymmet-ric stretching vibrations of NH bonds from DEA. Bands re-lated to symmetric νs(CH2) and asymmetric νas(CH2) stretching
vibrations from TIP are observed at 2867 cm−1and 2930 cm−1[30,31]. The bands at about 2350 cm−1are due to CO
2 present in the beam
path within the FTIR spectrometer[32]. The features at 1445 cm−1and 1638 cm−1are assigned respectively to symmetricν
s(COO) and
asym-metricνas(COO) stretching vibrations. The feature at 1560 cm−1is due
to a ν(C_O) mode, whereas that at 1080 cm−1 is assigned to
ν(Ti\O\C) bridging vibrations from isopropoxy groups[31,33]. The
band at 1380 cm−1is related to the symmetric deformation mode of CH3groups from TIP[30,34]. We observed that this band is less evident
in the FTIR spectra of samples heat treated at 300 °C or 400 °C. Absorp-tion bands ascribed to Ti\O and Ti\O\Ti bonds are observed in the
spectral range from 800 cm−1to 400 cm−1, the former being observed at higher wavenumbers than the latter[30,33].
Fig. 2a exhibits the ratio between the intensities of the bands related to hydroxyl groups (3300 cm−1) and Ti
\O bonds (800 cm−1) as a
function of the heat treatment temperature. We observed that this ratio decreased as the heat treatment temperature was increased.
Fig. 2b shows the ratio between the bands ascribed to Ti\O\Ti
(680 cm−1) and Ti
\O bonds (800 cm−1). One notices that this ratio
decreased when the heat treatment temperature was raised from 100 °C to 300 °C. However, no further substantial changes in this ratio were observed when the heating temperature changed from 300 °C to 400 °C.Table 1gives the positions of bands associated to Ti\O\Ti
and Ti\O bonds as a function of the heat treatment temperature. We
noticed that in a general way, the higher the heat treatment tempera-ture, the greater the separation between these two bands.
3.2. UV–vis absorption spectra of coatings obtained using an Eth:TIP molar ratio of 16:1
Figs. 3 to 5depict the UV–vis absorption spectra of titania coatings pre-pared using respectively withdrawal speeds of 6 mm/min, 30 mm/min, and 60 mm/min. In the spectrum of the coating obtained using 6 mm/min withdrawal speed and 100 °C heating temperature we
observed the presence of two transmission windows at about 385 nm and 700 nm. The combination of these two transmission windows gives rise to a pinkish colored sample. In the spectra of the coatings prepared using 6 mm/min withdrawal speed and heat treatment temperatures of 300 °C and 400 °C both transmission windows are
Fig. 1.FTIR spectra of titania coatings prepared in this work. Samples are prepared using withdrawal speeds of (I) 6 mm/min, (II) 30 mm/min, and (III) 60 mm/min, and heat treatment temperatures of (a) 100 °C, (b) 300 °C, and (c) 400 °C.
3043
shifted towards shorter wavelengths, giving rise to orange to brown colored samples. We noticed the presence of an absorption band at about 322 nm in the spectra shown inFig. 3.
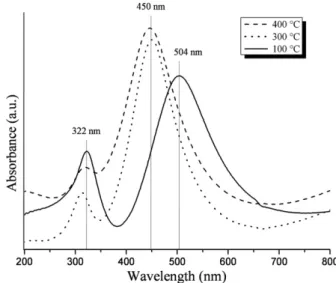
We observed fromFig. 4that the titaniafilms obtained by keeping the withdrawal speed at 30 mm/min exhibit one major absorption band in the visible region. However, thefilm heat treated at 100 °C showed two major absorption bands in the ultraviolet region, whereas samples heated at 300 °C and 400 °C presented only one band. This behavior sug-gests the occurrence of different types of electronic transitions from the ground state to excited ones in the ultraviolet region of the spectrum of thefilm heated at 100 °C. This sample exhibited a deep blue color due to the presence of a transmission window in its spectrum at 475 nm. The coating obtained after heat treatment at 300 °C showed low absorp-tion of photons with wavelengths longer than 600 nm, leading to orange to brown colored samples. The sample heat treated at 400 °C exhibited two transmission windows at 425 nm and 700 nm. The combination of these transmission windows gives rise to a pink coloredfilm.
FromFig. 5we observed that increasing the heat treatment temper-ature of the titaniafilms obtained with a 60 mm/min withdrawal speed leads to shifting the transmission windows present in the visible region towards longer wavelengths. This behavior causes the observed color change in the samples from green to red. It is worth mentioning that the titania coating prepared using 60 mm/min withdrawal speed and 100 °C heat treatment temperature did not develop color. Because of this behavior its UV–vis spectrum is not shown in this work.
3.3. UV–vis absorption spectra of coatings obtained using an Eth:TIP molar ratio of 64:1
The titania sols prepared using a C2H5OH:TIP molar ratio of 64:1 also
gave rise to colored films. The spectra of the films obtained with 30 mm/min and 60 mm/min withdrawal speeds are shown inFigs. 6
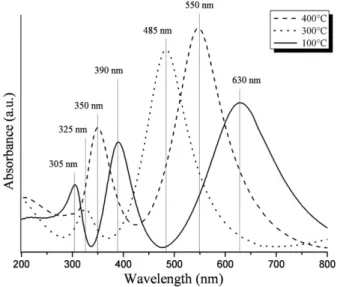
and 7, respectively. Films prepared with a 30 mm/min withdrawal speed showed one major absorption band centered in the visible region. We observed that this band is shifted towards longer wavelengths when the heating temperature is increased. In the UV–vis spectra of titania coatings obtained using a 60 mm/min withdrawal speed we noticed the presence of a wide absorption band in the visible range. The increase of the coating heat treatment temperature caused the increase of light transmission in the violet region. Because of this behavior the coating color changed from blue to dark blue when the heating tem-perature was increased. Some of the coatings obtained using a solvent: precursor molar ratio of 64:1 did not develop color. Because of this behav-ior their UV–vis spectra are not shown in this work.Figs. 8 and 9show photographs of samples prepared in this work.
4. Discussion
As mentioned before, the feature at 1080 cm−1has been ascribed toν(Ti\O\C) bridging vibrations from isopropoxy groups[31,33]. According to Atik et al.[21], when nucleophilic ligands like HAc are added to TIP the coordination number of the central atom increases from 4 to 6 and oligomeric species ([(Ti(OPri)3(OAc)]n(n= 2 or 3))
Fig. 2.Ratio between the intensities of infrared bands observed in this work as a function of the heat treatment temperature. (a) Ratio between bands ascribed to hydroxyl groups (3300 cm−1) and Ti
\O bonds (800 cm−1). (b) Ratio between features related to Ti
\O\Ti (680 cm−1) and Ti
\O bonds (800 cm−1).
Table 1
Positions of infrared bands ascribed to Ti\O\Ti and Ti\O bonds as a function of the heat
treatment temperature. The mean values shown in this table were obtained considering a 95% confidence level.
Heat treatment temperature (°C)
Ti\O
(cm−1)
Ti\O\Ti
(cm−1)
Δ(Ti\O)−(Ti\O\Ti)
(cm−1)a
100 °C 795 ± 2 687 ± 5 108 ± 7 300 °C 815 ± 10 680 ± 1 135 ± 11 400 °C 824 ± 10 684 ± 4 140 ± 14
aDistance between the bands related to Ti
\O and Ti\O\Ti bonds.
are formed. Vasconcelos et al.[35]suggested that a dimeric complex could be present in the network of samples prepared in this work. In this complex HAc could act as carboxylate ligand (CH3COO−). One
notices that only the sample prepared using a 60 mm/min withdrawal speed and 400 °C heat treatment temperature did not exhibit the feature at 1080 cm−1in its spectrum.
The presence of the bands at 1638 cm−1and 1445 cm−1in the FTIR spectra of samples prepared in this work may suggest a bidentate bridg-ing coordination for the acid group[31]. The separation of 193 cm−1 between these features is commonly observed for bidentate bridged carboxylic acid titanium complexes [36]. We did not observe the bands at 1000 cm−1and 850 cm−1in the FTIR spectra obtained in this work. These bands have been ascribed to isopropoxy groups from TIP[30]. One also notices the absence of the feature related to the C\O stretching mode from free carboxylic acids in the spectral range
from 1750 cm−1to 1735 cm−1. According to Urlaub et al.[31], this behavior could suggest the absence of ester groups in the prepared coatings resulting from the reaction between TIP and HAc.
We observed that the ratio between the intensities of infrared bands ascribed to hydroxyl groups and Ti\O bonds decreased as the heat
treatment temperature was increased (seeFig. 2a). It is well established that the heat treatment of sol–gel titania samples leads to the removal
of hydroxyls and water from them[37–39]. One would expect that this behavior could lead to decreasing the feature related to hydroxyl groups. In addition, the titania lattice is gradually formed as the heat treatment step is performed[30,40]. One also might expect that the gradual formation of the titania lattice is accompanied by increasing the band ascribed to Ti\O bonds. We believe that the decrease of the aforementioned ratio is related to both the decrease of the band related to hydroxyl groups and the increase of the feature ascribed to Ti\O
bonds.
We noticed that the ratio between features related to Ti\O\Ti and
Ti\O bonds decreased when the heat treatment temperature was
raised from 100 °C to 300 °C (seeFig. 2b). One observes fromTable 1
that the band ascribed to Ti\O bonds was more sensible to the heat
treatment step than that related to Ti\O\Ti bonds. We noticed that
the feature related to Ti\O bonds was shifted towards higher
wavenumbers as the heat treatment temperature was increased. It is well established that in the dip-coating process thefilm thickness (h) can be expressed by the Landau–Levich equation[41–43]:
h¼0:94 ðη:UÞ 2=3
γ1LV=6ðρ:gÞ1=2; ð1Þ
Fig. 4.UV–vis absorption spectra of sol–gel titania coatings prepared using a withdrawal speed of 30 mm/min. Samples are obtained by keeping the Eth:TIP molar ratio at 16:1.
Fig. 5.UV–vis absorption spectra of sol–gel titania coatings prepared using a withdrawal speed of 60 mm/min. Samples are obtained by keeping the Eth:TIP molar ratio at 16:1.
Fig. 6.UV–vis absorption spectra of sol–gel titania coatings prepared using a withdrawal speed of 30 mm/min. Samples are obtained by keeping the Eth:TIP molar ratio at 64:1.
Fig. 7.UV–vis absorption spectra of sol–gel titania coatings prepared using a withdrawal speed of 60 mm/min. Samples are obtained by keeping the Eth:TIP molar ratio at 64:1.
3045
where U represents the substrate withdrawal speed,ηandρthe viscosity and density of the sol, respectively,γLVthe liquid–vapor surface tension,
and g the gravity. One observes from Eq.(1)that the higher the with-drawal speed and sol viscosity, the thicker is the sol–gel coating. In addi-tion, it is well known that the higher the heat treatment temperature of thefilms, the lower are their thicknesses[15]. Vasconcelos et al.[24]
evaluated the thicknesses of the coatings prepared in this work using an Eth:TIP molar ratio of 16:1. Although the thicknesses of thefilms pre-pared by keeping the Eth:TIP molar ratio at 64:1 were not assessed in this work, we believe that they could be thinner than those obtained using a molar ratio of 16:1 since the lower the precursor concentration, the lower the sol viscosity[44]. Based on these observations one might ex-pect that the titania coatings obtained in this work exhibit different thicknesses since the processing conditions varied from one sample to another.
Rampaul et al.[45]investigated the deposition by dip-coating of titania thinfilms on glass substrates. They noticed that the shift of ab-sorption bands observed in the UV–vis spectra of the obtainedfilms increases with increasing their thicknesses. This behavior seems to be related to the light interference phenomena occurring at the steel–film andfilm–air interfaces. We believe that the observed changes in the UV–vis spectra and colors of the samples prepared in this work could be related to the variation of the coating thickness as the processing conditions were modified.
5. Conclusions
FTIR tests revealed that the ratio between the intensities of features ascribed to hydroxyl groups and Ti\O bonds decreased as the heat
treatment temperature was increased. The ratio between the bands
Fig. 8.Photographs of samples obtained using an Eth:TIP molar ratio of 16:1.
related to Ti\O\Ti and Ti\O bonds decreased when the heating
temperature was raised from 100 °C to 300 °C. However, no further substantial changes in this ratio were observed when the heat treatment temperature changed from 300 °C to 400 °C. We observed that the feature ascribed to Ti\O bonds was more sensible to the heat treatment
step than that related to Ti\O\Ti bonds. We noticed that the feature
related to Ti\O bonds was shifted towards higher wavenumbers as
the heat treatment temperature was increased.
The feature related to the C_O stretching mode from free carboxylic
acids in the spectral range from 1750 cm−1to 1735 cm−1was not observed in the FTIR spectra obtained in this work. This behavior could indicate the absence of ester groups in the prepared coatings resulting from the reaction between TIP and HAc. We noticed that the materials prepared in this work can exhibit a variety of colors depending on the heat treatment temperature, withdrawal speed, and precursor:solvent molar ratio used in their processing. It is an importantfinding since this behavior could lead to the architectural application of these materials. We believe that the observed changes in the UV–vis spectra and colors of these samples could be related to the variation of the coating thickness as the processing conditions were modified.
Acknowledgments
The authors thank thefinancial support from the Brazilian Research Agency (CNPq).
References
[1] C.J. Lin, J.G. Duh, Surf. Coat. Technol. 85 (1996) 175–182.
[2] E. Kikuti, R. Conrrado, N. Bocchi, S.R. Biaggio, R.C. Rocha-Filho, J. Braz. Chem. Soc. 15 (2004) 472–480.
[3] L.D. Underwood, US Pat. 3664884, May 1972. [4] S.A. Sygeoda, Beg. Pat. 869885, February 1979. [5] C.J. Lin, J.G. Duh, Surf. Coat. Technol. 70 (1994) 79–85. [6] C.J. Lin, J.G. Duh, Thin Solid Films 287 (1996) 80–86.
[7] K. Ogura, W. Lou, M. Nakayama, Electrochim. Acta 41 (1996) 2849–2853. [8] L.D. Vázquez-Santoyo, J.J. Pérez-Bueno, A. Manzano-Ramírez, J. Gonzalez-Hernández,
J.F. Pérez-Robles, Yu.V. Vorobiev, Inorg. Mater. 41 (2005) 955–960.
[9] T.E. Evans, A.C. Hart, A.E. Skedgell, Trans. Inst. Met. Finish. 51 (1973) 108–112. [10] T.E. Evans, Corros. Sci. 17 (1977) 105–124.
[11] X. Yu, Y. Zuo, H.W. Ma, H.F. Zhao, W.W. Luo, W. Bi, W. Li, Key Eng. Mater. 280–283 (2007) 815–818.
[12] X.G. Yu, L.Y. Liu, Y.B. Zuo, L.J. Wang, H.W. Ma, W.Y. Bi, H.F. Zhao, L. Wang, F. Long, W.W. Luo, Key Eng. Mater. 336–338 (2007) 2649–2651.
[13] R. Reisfeld, Struct. Bond. 85 (1996) 215–233.
[14] C.J. Brinker, G.C. Frye, A.J. Hurd, C.S. Ashley, Thin Solid Films 201 (1991) 97–108. [15] C.J. Brinker, A.J. Hurd, P.R. Schunk, G.C. Frye, C.S. Ashley, J. Non-Cryst. Solids
147–148 (1992) 424–436.
[16] H. Dislich, E. Hussmann, Thin Solid Films 77 (1981) 129–140. [17] S.J. Sakka, J. Non-Cryst. Solids 73 (1985) 651–660.
[18] T.P. Chou, C. Chandrasekaran, S. Limmer, C. Nguyen, G.Z. Cao, J. Mater. Sci. Lett. 21 (2002) 251–255.
[19] M. Sato, E.B. Slamovich, T.J. Webster, Biomaterials 26 (2005) 1349–1357. [20] S.V. Lamaka, M.F. Montemor, A.F. Galio, M.L. Zheludkevich, C. Trindade, L.F. Dick,
M.G.S. Ferreira, Electrochim. Acta 53 (2008) 4773–4783.
[21] M. Atik, S.H. Messaddeq, F.P. Luna, M.A. Aegerter, Mater. Sci. Lett. 15 (1996) 2051–2054.
[22] K. Izumi, N. Minami, Y. Uchida, Key Eng. Mater. 150 (1998) 77–87.
[23] D.C.L. Vasconcelos, J.A.N. Carvalho, M. Mantel, W.L. Vasconcelos, J. Non-Cryst. Solids 273 (2000) 135–139.
[24] D.C.L. Vasconcelos, E.H.M. Nunes, A.C.S. Sabioni, J.C.D. da Costa, W.L. Vasconcelos, J. Mater. Eng. Perform. 21 (2012) 411–417.
[25] D.B. Haddow, P.F. James, R. Noort, J. Mater. Sci. Mater. Med. 7 (1996) 255–260. [26] D. Bao, X. Wu, L. Zhang, X. Yao, Thin Solid Films 350 (1999) 30–37.
[27] A. Verma, S.B. Samanta, A.K. Bakhshi, S.A. Agnihotry, Sol. Energy Mater. Sol. Cells 88 (2005) 47–64.
[28] A. Verma, M. Kar, S.A. Agnihotry, Sol. Energy Mater. Sol. Cells 91 (2007) 1305–1312. [29] D.L. Wood, E.M. Rabinovich, D.W. Johnson, J.B. MacChesney, E.M. Vogel, J. Am.
Ceram. Soc. 66 (1983) 693–699.
[30] M. Burgos, M. Langlet, Thin Solid Films 349 (1999) 19–23.
[31] R. Urlaub, U. Posset, R. Thull, J. Non-Cryst. Solids 265 (2000) 276–284. [32] M. Hermann, W. Niessen, H.G. Karge, Stud. Surf. Sci. Catal. 94 (1995) 131–138. [33] F.N. Castellano, J.M. Stipkala, L.A. Friedman, G.L. Meyer, Chem. Mater. 6 (1994)
2123–2129.
[34] D.P. Birnie, J. Mater. Sci. 35 (2000) 367–374.
[35] D.C.L. Vasconcelos, V.C. Costa, E.H.M. Nunes, A.C.S. Sabioni, M. Gasparon, W.L. Vasconcelos, Mater. Sci. Appl. 2 (2011) 1375–1382.
[36] S. Doeuff, M. Henry, C. Sanchez, J. Livage, J. Non-Cryst. Solids 89 (1987) 206–216. [37] E. Sanchez, T. López, R. Gómez, Bokhimi, A. Morales, O. Novaro, J. Solid State
Chem. 122 (1996) 309–314.
[38] D. Beydoun, R. Amal, Mater. Sci. Eng., B 94 (2002) 71–81.
[39] L. Caldeira, D.C.L. Vasconcelos, E.H.M. Nunes, V.C. Costa, A.P. Musse, S.A. Hatimondi, J.F. Nascimento, W. Grava, W.L. Vasconcelos, Ceram. Int. 38 (2012) 3251–3260.
[40] S. Musić, M. Gotić, M. Ivanda, S. Popović, A. Turković, R. Trojko, A. Sekulić, K. Furić, Mater. Sci. Eng. B 47 (1997) 33–40.
[41] L.D. Landau, B.G. Levich, Acta Physicochim. URS 17 (1942) 42–54.
[42] I.M. Thomas, in: L.C. Klein (Ed.), Sol–gel Optics: Processing and Applications, Springer, Boston, 1994, pp. 141–158.
[43] C.J. Brinker, G.W. Scherer, in: C.J. Brinker, G.W. Scherer (Eds.), Sol–gel Science: the Physics and Chemistry of Sol–gel Processing, Academic Press Inc., San Diego, 1990, pp. 787–838.
[44] M. Langlet, A. Kim, M. Audier, C. Guillard, J.M. Herrmann, J. Mater. Sci. 38 (2003) 3945–3953.
[45] A. Rampaul, I.P. Parkin, S.A. O'Neill, J. de Souza, A. Mills, N. Elliott, Polyhedron 22 (2003) 35–44.
3047