Insights about serum sodium behavior after 24
hours of continuous renal replacement therapy
INTRODUCTION
Continuous renal replacement therapy (CRRT) is a widely adopted supportive therapy that is used in critically ill patients. Although deinitive indications for CRRT are controversial, its use should be strongly considered in speciic situations, such as severe hemodynamic instability and brain edema.(1-3)
In these situations, blood osmolality variation potentially causes serious adverse efects, which include disequilibrium syndrome, osmotic demyelination, brain edema and hypotension.(4,5)
he serum sodium concentration is a major determinant of blood osmolality, and its variation over time is extremely important.(6) A large 24-hour variation
Thiago Gomes Romano1,2, Cassia Pimenta Barufi Martins3, Pedro Vitale Mendes1,4, Bruno Adler Maccagnan Pinheiro Besen4, Fernando Godinho Zampieri4, Marcelo Park4
1. Intensive Care Unit, Hospital Sírio-Libanês - São Paulo (SP), Brazil.
2. Discipline of Nephrology, Faculdade de Medicina do ABC - Santo André (SP), Brazil. 3. Intensive Care Unit, Hospital Baia Sul - Florianópolis (SC), Brazil.
4. Intensive Care Unit, Department of Emergency, Hospital das Clínicas, Faculdade de Medicina, Universidade de São Paulo - São Paulo (SP), Brazil.
Objective: he aim of this study was to investigate the clinical and laboratorial factors associated with serum sodium variation during continuous renal replacement therapy and to assess whether the perfect admixture formula could predict 24-hour sodium variation.
Methods: hirty-six continuous renal replacement therapy sessions of 33 patients, in which the aluent prescription was unchanged during the irst 24 hours, were retrieved from a prospective collected database and then analyzed. A mixed linear model was performed to investigate the factors associated with large serum sodium variations (≥ 8mEq/L), and a Bland-Altman plot was generated to assess the agreement between the predicted and observed variations.
Results: In continuous renal replace-ment therapy 24-hour sessions, SAPS 3
Conflicts of interest: None.
Submitted on February 17, 2016 Accepted on April 20, 2016
Corresponding author:
Thiago Gomes Romano
Av. Príncipe de Gales, 821, Vila Príncipe de Gales CEP: 09060-650 - Santo André (SP), Brazil E-mail: [email protected]
Responsible editor: Luciano César Pontes de Azevedo
Análise do comportamento do sódio ao longo de 24 horas de
terapia renal substitutiva
ABSTRACT (p = 0.022) and baseline hypernatremia (p = 0.023) were statistically signiicant predictors of serum sodium variations ≥ 8mEq/L in univariate analysis, but only hypernatremia demonstrated an independent association (β = 0.429, p < 0.001). he perfect admixture for-mula for sodium prediction at 24 hours demonstrated poor agreement with the observed values.
Conclusions: Hypernatremia at the time of continuous renal replacement therapy initiation is an important factor associated with clinically signiicant serum sodium variation. he use of 4% citrate or acid citrate dextrose - formula A 2.2% as anticoagulants was not associated with higher serum sodium variations. A mathematical prediction for the serum sodium concentration after 24 hours was not feasible.
DOI: 10.5935/0103-507X.20160026
of the serum sodium concentration in the presence of either hyponatremia or hypernatremia is associated with encephalic derangements (brain edema or osmotic demyelination syndrome), and to avoid such derangements, a variation smaller than 8mEq/L is considered safe.(5,7) In
addition, citrate anticoagulation is the preferred method
for ilter protection during CRRT compared to heparin,(8)
but its use may be associated with sodium variations that are often unpredictable. Currently, scheduled laboratory monitoring and ine tuning have been standard procedures to modulate serum electrolytes until achieving the stable target value.(9) Furthermore, there are no validated
prediction rules to estimate sodium variation during CRRT with citrate as the ilter protection method.
hus, the primary objectives of this study were to investigate whether citrate anticoagulation is associated with large serum sodium variations over 24 hours and whether the perfect admixture formula could predict its variation. Secondary objectives were to assess the clinical and laboratorial factors associated with a large serum sodium variation and to additionally explore predictors of the resulting serum sodium concentration up to 24 hours of continuous renal replacement therapy.
METHODS
Continuous renal replacement therapy sessions were retrieved from two prospectively collected electronic
databases from two hospitals (Hospital Sírio Libanês
and Hospital das Clínicas da Faculdade de Medicina de São Paulo) located in São Paulo, Brazil. hese data were reviewed from 2003 to 2012 in one hospital and from 2011 to 2012 in another hospital. A CRRT session was retrieved if the session had lasted for at least 24 hours and if the aluent luid prescription was not modiied during this time period. Two CRRT machines were used during
this study, a Diapact®
CRRT (BBraun Laboratories,
Melsungen, Germany) and Prismalex® System (Gambro,
Lund, Sweden).
his study protocol followed the guidelines of the Declaration of Helsinki. he institutional review board
of the hospital (Comissão para Análise de Projetos de
Pesquisa - CAPPesq) reviewed and approved this study (CAPPesq protocol number 107443). he requirement for written informed consent was waived because there was no intervention; we used a database that assured patient conidentiality.
Clinical and laboratorial data were collected from the electronic records. When necessary, laboratorial data were retrieved from the electronic consulting system. Data are shown for the whole group (all CRRT sessions) and were categorized into two groups: he irst group (Group 1) underwent CRRT sessions with 24 hours of serum sodium concentration variation ≥ |8|mEq/L; and the second group (Group 2) with 24 hours of serum sodium concentration variation < |8|mEq/L.
Continuous renal replacement therapy initiation and conduction
In both units, the CRRT prescription was individualized according to the patients’ clinical situation. To enhance ilter protection, 4% citrate was routinely used in one hospital, 2.2% acid citrate dextrose - formula A (ACD-A) was used in the other hospital, and both hospitals commonly used heparin and a normal saline lavage when necessary. Post-iltration and systemic ionized calcium and sodium activated the partial thromboplastin time (aPTT), and potassium, venous blood pH, bicarbonate and standard base excess (SBE) were routinely collected, as necessary, every six hours. he initial sodium aluent concentration prescription was based on the serum concentration, presence of brain edema and anticoagulant use. With the use of heparin or lavage, the sodium concentration was prescribed to equalize the targeted serum concentration. he electrolyte composition of the luid replacement was identical to the dialysate in cases of continuous venous-venous hemodiailtration (CVVHDF). When using 4% citrate and 2.2% ACD-A, sodium and bicarbonate concentrations were prescribed at 15 - 20mEq/L and 5 - 10mEq/L below the targeted serum concentration, respectively, because the 4% citrate solution contained 408mEq/L of sodium and the 2.2% ACD-A solution contained 224mEq/L of sodium.
Serum sodium prediction after 24 hours
he perfect admixture formula, which was originally presented in this manuscript, takes into account that all of the components that pass through the ilter have robust difusibility and sieving properties, including 4% citrate(10)
and 2.2% ACD-A.(11) Consequently, the serum sodium in
the CRRT venous line consisted of the respective low proportional admixture of the anticoagulant, aluent luid and blood, which occurs in the ilter and in the venous line (“mixing chamber”). his inding justiies the reduction in the aluent luid sodium concentration
during CRRT using 4% citrate(12) or 2.2% ACD-A(13) as
an anticoagulant to achieve systemic equilibrium without hypernatremia. he 4% citrate and 2.2% ACD-A had a sodium concentration of 408mEq/L and 224mEq/L, respectively. Furthermore, the resultant venous line sodium concentration was tightly associated with the equilibrated systemic serum sodium concentration during
CRRT.(14) hus, we assumed that serum sodium after 24
hours resulted from the equilibrium of the proportional admixture of sodium derived from the aluent, blood and anticoagulant.
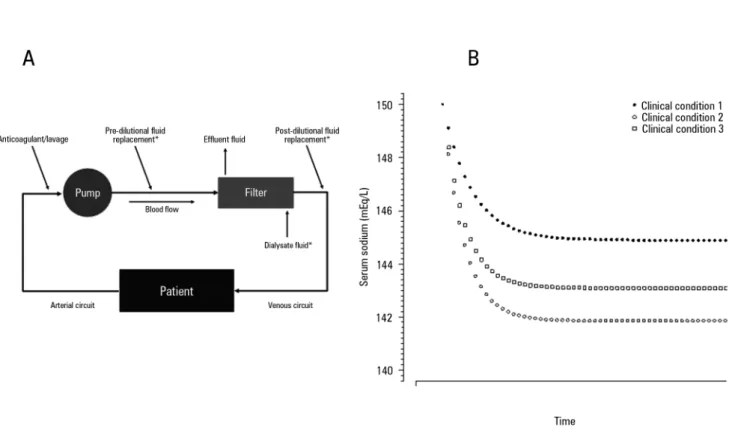
Figure 1A shows the principle of the perfect sodium admixture among the cited components, in which the ilter and venous circuit are a mixing chamber. Using this mixing chamber principle, we hypothesized that administration of the perfect admixture back into the patient will determine the inal serum sodium concentration. he equilibrium process requires an unpredictable amount time, as shown in igure 1 B.
For each milliliter of blood passing through the ilter, the perfect admixture principle can be mathematically written as follows (sodium units are mEq):
Sodium mass
Blood sodium (Bs) = Systemic serum sodium concentration * blood low/1000
Aluent luid sodium (As) = Aluent sodium concentration * dosage (in L/hour)/1000 * 60
Anticoagulant sodium (ACs) = Sodium concentration (408mEq/L of sodium for 4% citrate and 224mEq/L for the 2.2% ACD-A solution) * ACs low (in mL/hour)/60
Diluents’ volume
Blood volume (Bv) = Blood low (mL/minute)
Aluent volume (Av) = Dialysis dose (mL/hour)/60 Anticoagulant volume (ACv) = Anticoagulant low (mL/hour)/60
The sodium inside the mixing chamber is:
[Na+] = (Bs + As + ACs)/(Bv + Av + Acv)
he Bs value is renewed after each cycle of serum sodium equilibrium, resulting in a non-linear variation of serum sodium until equilibrium, as shown in igure 1 A.
However, this sodium concentration will equilibrate in serum and re-enter the CRRT machine, leading to a new Bs value, and thus, a new value of equilibrium will be achieved until the inal value is obtained.
Statistical analysis
Data were predominantly non-parametrically distributed (as tested using the Shapiro-Wilk goodness-of-it model), and thus, they are presented as the median [25% - 75%], except for the diference between observed and predicted sodium, which was shown as the mean and standard deviation. Comparisons between diferent groups were performed using the Mann-Whitney test, and comparisons of subjects of the same group over time were performed using the Friedman test. Post-hoc analyses were not performed because temporal tests are only used to demonstrate trends. A mixed linear model using the CRRT session as the random factor was used to investigate the independent association between SAPS 3 and initial serum sodium with the 24-hour serum sodium variation as the dependent variable because the aforementioned two variables were signiicantly diferent between groups at baseline. A Bland-Altman diagram was generated to demonstrate agreements between predicted sodium concentration at 24 hours using the perfect admixture
formula and observed values at 24 hours.(15) he R-free
source software was used to performed all of the statistical analyses and to generate graphs.(16)
RESULTS
Figure 1 - Serum sodium prediction using the total admixture formula. A) Principles of the formula, where the filter and continuous renal replacement therapy venous circuit are assumed to be a “perfect” mixing chamber, and 4% citrate and 2.2% ACD-A are considered with a sieving coefficient ~1 and diffusibility ~1 through the filter. B) Equilibrium of the serum sodium through the time of continuous renal replacement therapy in three different clinical conditions. All three conditions started with a serum sodium = 150mEq/L, affluent sodium = 135mEq/L, and a blood flow = 180mL/minute. The three different clinical conditions were: clinical condition 1: continuous renal replacement therapy dosage = 2000mL/hour, and 2.2% ACD-A (224mEq/L of sodium) flow = 250mL/hour; Clinical condition 2: continuous renal replacement therapy dosage = 3000mL/hour, and 2.2% ACD-A flow = 250mL/hour; Clinical condition 3: continuous renal replacement therapy dosage = 2000mL/hour, and 2.2% ACD-A flow = 300mL/hour. * Only used in continuous venous-venous hemofiltration and continuous venous-venous hemodiafiltration; # Only used in continuous venous-venous hemodialysis and continuous venous-venous hemodiafiltration.
relevant data immediately before CRRT initiation, and the amount of serum sodium concentration variation during the 24-hour session was also analyzed. hese two tables showed that the disease severity at ICU admission (disclosed by the SAPS 3 score) and initial serum sodium concentration were slightly diferent between Groups 1 and 2. he more severe the hypernatremia, the more intense the serum sodium variation. Multivariate analysis revealed that only the initial sodium was signiicantly related (beta coeicient = 0.429, p < 0.001) to the sodium variation during the irst 24 hours of CRRT, while disease severity (SAPS 3) was not related (beta coeicient = - 0.050, p = 0.615).
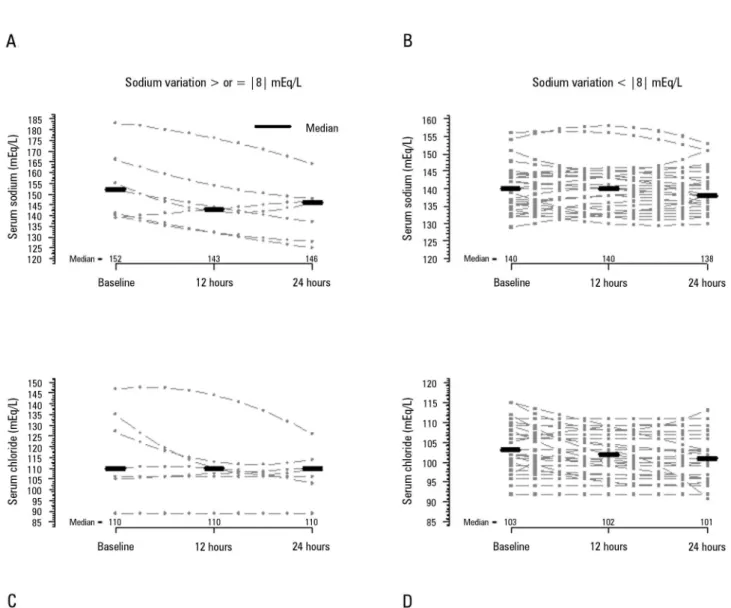
Figure 2 shows the temporal behavior of serum sodium and chloride during the irst 24 hours, and tables 3 and 4 show the same temporal range behavior of the other patients’ relevant metabolic variables and CRRT data,
respectively. Importantly, no patient received hypertonic solutions during the CRRT session. he serum sodium median variations between 24 hours after CRRT initiation and baseline were 0.0 [0.3 - 2.0], -1.0 [-5.0 - 2.0], and -3.0 [-7.5 - -1.0] mEq/L (p = 0.280) in patients who were anticoagulated with heparin, 4% citrate and 2.2% ACD-A, respectively. Metabolic acidosis improved during
the CRRT session, and PaCO2 also increased. CRRT
related variables were relatively stable.
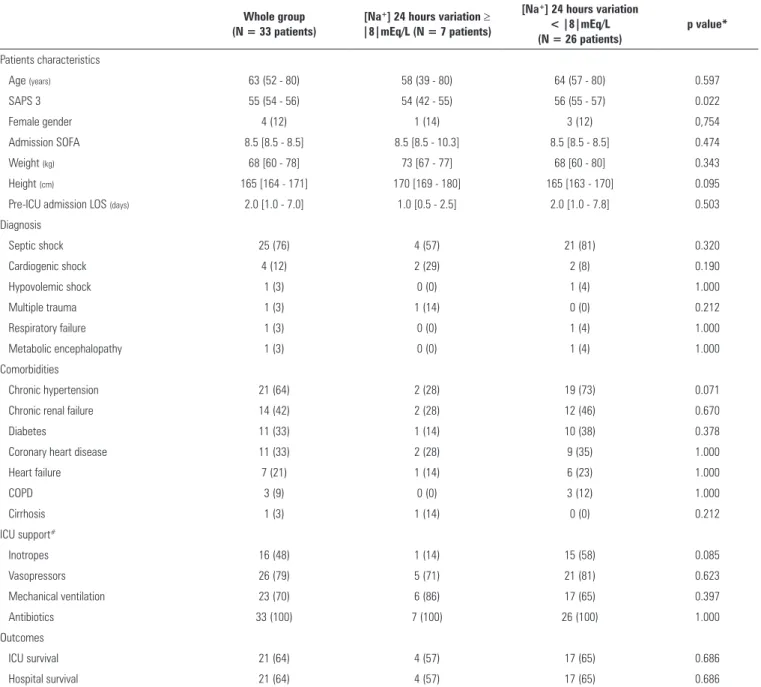
Table 1 - Characteristics of the whole group of 33 patients analyzed and the groups categorized according to the 24 hours sodium variation ≥ |8|mEq/L or <|8|mEq/L
Whole group (N = 33 patients)
[Na+] 24 hours variation ≥ |8|mEq/L (N = 7 patients)
[Na+] 24 hours variation < |8|mEq/L (N = 26 patients)
p value*
Patients characteristics
Age (years) 63 (52 - 80) 58 (39 - 80) 64 (57 - 80) 0.597
SAPS 3 55 (54 - 56) 54 (42 - 55) 56 (55 - 57) 0.022
Female gender 4 (12) 1 (14) 3 (12) 0,754
Admission SOFA 8.5 [8.5 - 8.5] 8.5 [8.5 - 10.3] 8.5 [8.5 - 8.5] 0.474
Weight (kg) 68 [60 - 78] 73 [67 - 77] 68 [60 - 80] 0.343
Height (cm) 165 [164 - 171] 170 [169 - 180] 165 [163 - 170] 0.095
Pre-ICU admission LOS (days) 2.0 [1.0 - 7.0] 1.0 [0.5 - 2.5] 2.0 [1.0 - 7.8] 0.503
Diagnosis
Septic shock 25 (76) 4 (57) 21 (81) 0.320
Cardiogenic shock 4 (12) 2 (29) 2 (8) 0.190
Hypovolemic shock 1 (3) 0 (0) 1 (4) 1.000
Multiple trauma 1 (3) 1 (14) 0 (0) 0.212
Respiratory failure 1 (3) 0 (0) 1 (4) 1.000
Metabolic encephalopathy 1 (3) 0 (0) 1 (4) 1.000
Comorbidities
Chronic hypertension 21 (64) 2 (28) 19 (73) 0.071
Chronic renal failure 14 (42) 2 (28) 12 (46) 0.670
Diabetes 11 (33) 1 (14) 10 (38) 0.378
Coronary heart disease 11 (33) 2 (28) 9 (35) 1.000
Heart failure 7 (21) 1 (14) 6 (23) 1.000
COPD 3 (9) 0 (0) 3 (12) 1.000
Cirrhosis 1 (3) 1 (14) 0 (0) 0.212
ICU support#
Inotropes 16 (48) 1 (14) 15 (58) 0.085
Vasopressors 26 (79) 5 (71) 21 (81) 0.623
Mechanical ventilation 23 (70) 6 (86) 17 (65) 0.397
Antibiotics 33 (100) 7 (100) 26 (100) 1.000
Outcomes
ICU survival 21 (64) 4 (57) 17 (65) 0.686
Hospital survival 21 (64) 4 (57) 17 (65) 0.686
Na+ - sodium; SAPS - Simplified Acute Physiological Score; SOFA - Sequential Organ Failure Assessment; ICU - intensive care unit; LOS - length of stay; COPD - chronic obstructive pulmonary
disease. * p value of the comparison between the groups with sodium variation ≥ |8|mEq/L and < |8|mEq/L within the first 24 hours. # At any time of the intensive care unit stay. The results
are expressed as the median (25% - 75%) or as the number (%).
citrate (2.2% ACD-A or 4% citrate), a 24-hour serum sodium variation of 1.5 [-0.5 - 5.5] mEq/L with an initial serum sodium concentration of 140 [136 - 144] mEq/L and sodium in the solution of 133 [125 - 139] mEq/L was observed. Among these CRRT sessions, when only initially hypernatremic patients were observed (total of six sessions) (serum sodium > 145mEq/L), the sodium variation, serum concentration, and solution concentration were 9.5 [4.8 - 14.0] mEq/L, 167 [159 - 175] mEq/L and 165
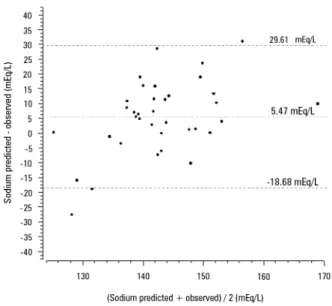
[160 - 169] mEq/L, respectively. Figure 4 shows the poor agreement between the observed serum sodium at the end of 24 hours of CRRT and the expected serum sodium calculated using the perfect admixture formula.
DISCUSSION
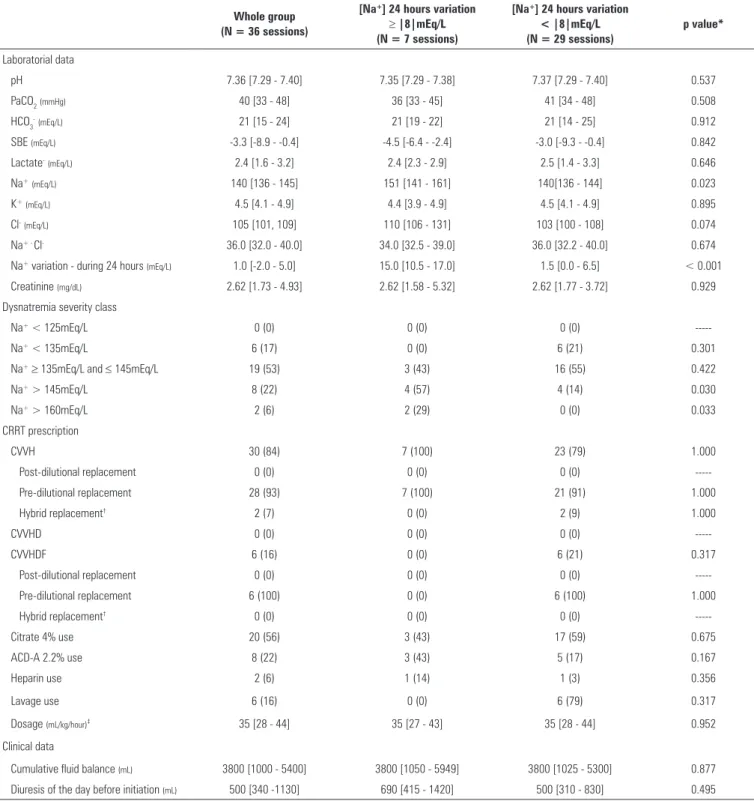
Table 2 - Clinical, laboratorial and continuous renal replacement therapy data immediately before initiation
Whole group (N = 36 sessions)
[Na+] 24 hours variation
≥ |8|mEq/L (N = 7 sessions)
[Na+] 24 hours variation < |8|mEq/L (N = 29 sessions)
p value*
Laboratorial data
pH 7.36 [7.29 - 7.40] 7.35 [7.29 - 7.38] 7.37 [7.29 - 7.40] 0.537
PaCO2(mmHg) 40 [33 - 48] 36 [33 - 45] 41 [34 - 48] 0.508
HCO3-(mEq/L) 21 [15 - 24] 21 [19 - 22] 21 [14 - 25] 0.912
SBE (mEq/L) -3.3 [-8.9 - -0.4] -4.5 [-6.4 - -2.4] -3.0 [-9.3 - -0.4] 0.842
Lactate-(mEq/L) 2.4 [1.6 - 3.2] 2.4 [2.3 - 2.9] 2.5 [1.4 - 3.3] 0.646
Na+(mEq/L) 140 [136 - 145] 151 [141 - 161] 140[136 - 144] 0.023
K+(mEq/L) 4.5 [4.1 - 4.9] 4.4 [3.9 - 4.9] 4.5 [4.1 - 4.9] 0.895
Cl-(mEq/L) 105 [101, 109] 110 [106 - 131] 103 [100 - 108] 0.074
Na+ - Cl- 36.0 [32.0 - 40.0] 34.0 [32.5 - 39.0] 36.0 [32.2 - 40.0] 0.674
Na+ variation - during 24 hours (mEq/L) 1.0 [-2.0 - 5.0] 15.0 [10.5 - 17.0] 1.5 [0.0 - 6.5] < 0.001
Creatinine (mg/dL) 2.62 [1.73 - 4.93] 2.62 [1.58 - 5.32] 2.62 [1.77 - 3.72] 0.929
Dysnatremia severity class
Na+ < 125mEq/L 0 (0) 0 (0) 0 (0)
---Na+ < 135mEq/L 6 (17) 0 (0) 6 (21) 0.301
Na+≥ 135mEq/L and ≤ 145mEq/L 19 (53) 3 (43) 16 (55) 0.422
Na+ > 145mEq/L 8 (22) 4 (57) 4 (14) 0.030
Na+ > 160mEq/L 2 (6) 2 (29) 0 (0) 0.033
CRRT prescription
CVVH 30 (84) 7 (100) 23 (79) 1.000
Post-dilutional replacement 0 (0) 0 (0) 0 (0)
---Pre-dilutional replacement 28 (93) 7 (100) 21 (91) 1.000
Hybrid replacement† 2 (7) 0 (0) 2 (9) 1.000
CVVHD 0 (0) 0 (0) 0 (0)
---CVVHDF 6 (16) 0 (0) 6 (21) 0.317
Post-dilutional replacement 0 (0) 0 (0) 0 (0)
---Pre-dilutional replacement 6 (100) 0 (0) 6 (100) 1.000
Hybrid replacement† 0 (0) 0 (0) 0 (0)
---Citrate 4% use 20 (56) 3 (43) 17 (59) 0.675
ACD-A 2.2% use 8 (22) 3 (43) 5 (17) 0.167
Heparin use 2 (6) 1 (14) 1 (3) 0.356
Lavage use 6 (16) 0 (0) 6 (79) 0.317
Dosage (mL/kg/hour)‡ 35 [28 - 44] 35 [27 - 43] 35 [28 - 44] 0.952
Clinical data
Cumulative fluid balance (mL) 3800 [1000 - 5400] 3800 [1050 - 5949] 3800 [1025 - 5300] 0.877
Diuresis of the day before initiation (mL) 500 [340 -1130] 690 [415 - 1420] 500 [310 - 830] 0.495
Na+ - sodium; PaCO
2 - partial pressure of carbon dioxide; HCO3 - bicarbonate; SBE - standard base excess; K
+ - potassium; Cl- - chloride; Na+ - Cl- - sodium-chloride; CRRT - continuous renal
replacement therapy; CVVH - continuous venous-venous hemofiltration; CVVHD - continuous venous-venous hemodialysis; CVVHDF - continuous venous-venous hemodiafiltration; ACD-A - acid citrate dextrose - formula A. † In these sessions, the pre- and post-dilutional fluid replacement were used at the same time during continuous venous-venous hemofiltration and continuous
Figure 2 - Sodium and chloride serum concentrations over the first 24 hours after continuous renal replacement therapy initiation. A and B) Sodium concentrations in the groups with sodium variations ≥ |8|mEq/L and < |8|mEq/L, respectively. The sodium concentration of Friedman´s analysis resulted in p = 0.040 in panel A and p = 0.841 in panel B. C and D) Chloride concentration in the groups with sodium variation ≥ |8|mEq/L and < |8|mEq/L, respectively. The chloride concentration of Friedman´s analysis resulted in p = 0.486 in panel C and p < 0.001 in panel D.
of CRRT initiation. he perfect admixture formula for sodium prediction is not accurate, and the use of 4% citrate or 2.2% ACD-A as anticoagulants was not associated with higher serum sodium variations.
A large variation in serum sodium concentration during extracorporeal therapy is potentially dangerous to critically ill patients, mainly because a large osmolality variation is associated with hemodynamic instability(17) and encephalic
water interstitial changes.(18) hus, the main inding of
this study supports that patients with hyperfnatremia at CRRT initiation are more prone to present dangerous
serum sodium concentration variations within the irst 24 hours of CRRT and should be monitored closely to avoid iatrogenic insults. Despite the recognition of pre-CRRT hypernatremia as a mortality predictor,(19) it is not
consistently associated with serum sodium variations after CRRT initiation.(20) Furthermore, hypernatremic patients
are more severely ill and present more organ dysfunction than non-hypernatremic patients, as demonstrated by other studies.(21)
Table 3 - Metabolic data variation within the first 24 hours of continuous renal replacement therapy
[Na+] 24 hours variation CRRT initiation 12 hours 24 hours p value*
pH
Whole group 7.37 [7.29 - 7.40] 7.34 [7.27 - 7.42] 7.40 [7.34 - 7.43] 0.072
≥ |8|mEq/L 7.34 [7.32 - 7.35] 7.37 [7.31 - 7.43] 7.37 [7.31 - 7.40] 0.717
< |8|mEq/L 7.37 [7.28 - 7.42] 7.34 [7.27 - 7.42] 7.40 [7.34 - 7.44] 0.132
PaCO2(mmHg)
Whole group 37 [30 - 47] 41 [33 - 45] 41 [37 - 46] 0.014
≥ |8|mEq/L 35 [28 - 42] 37 [32 - 43] 45 [38 - 48] 0.018
< |8|mEq/L 39 [31 - 47] 41 [33 - 46] 40 [37 - 45] 0.580
SBE (mEq/L)
Whole group -3.7 [-9.0 - -1.0] -3.4 [-7.7 - 1.1] -0.8 [-4.4 - 1.7] < 0.001
≥ |8|mEq/L -6.3 [-9.1 - -2.5] -1.3 [-7.6 - 1.1] 0.6 [-1.4 - 1.2] 0.236
< |8|mEq/L -3.4 [-8.7 - -0.7] -4.0 [-7.2 - 0.6] -1.2 [-4.2 - 2.0] 0.095
HCO3-(mEq/L)
Whole group 21 [15 - 24] 22 [18 - 25] 23 [20 - 26] < 0.001
≥ |8|mEq/L 19 [14 - 23] 22 [18 - 25] 25 [22 - 27] 0.169
< |8|mEq/L 21 [15 - 24] 22 [18 -25] 23 [20 - 26] 0.099
Lactate-(mEq/L)
Whole group 2.3 [1.4 - 3.2] 2.3 [1.7 - 3.5] 2.2 [1.7 - 3.1] 0.088
≥ |8|mEq/L 2.9 [2.2 - 3.7] 1.3 [0.9 - 1.8] 2.0 [1.8 - 2.2] 0.097
< |8|mEq/L 2.3 [1.4 - 3.2] 2.7 [1.9 - 3.7] 2.3 [1.7 - 3.2] 0.033
K+(mEq/L)
Whole group 4.5 [4.1 - 4.9] 4.3 [4.0 - 4.6] 4.2 [3.9 - 4.4] 0.164
≥ |8|mEq/L 4.4 [3.7 - 5.2] 4.4 [4.2 - 4.6] 4.1 [3.9 - 4.3] 0.819
< |8|mEq/L 4.5 [4.1 - 4.9] 4.3 [4.0 - 4.7] 4.2 [3.9 - 4.5] 0.227
Na+ - Cl-(mEq/L)
Whole group 36.0 [32.0 - 40.0] 36.5 [34.0 - 41.0] 37.5 [32.8 - 41.2] 0.104
≥ |8|mEq/L 33.3 [2.8 - 34.8] 38.5 [36.5 - 40.5] 34.0 [32.0 - 37.0] 0.074
< |8|mEq/L 36.0 [33.3 - 40.0] 35.3 [34.0 - 41.0] 38.0 [34.5 - 41.5] 0.071
Temperature (ºCelsius)
Whole group 36.2 [36.7 - 36.6] 35.7 [35.2 - 36.4] 36.0 [35.6 - 36.6] 0.495
≥ |8|mEq/L 36.7 [35.6 - 36.3] 35.6 [35.1 - 36.0] 36.2 [35.6 - 36.7] 0.147
< |8|mEq/L 36.2 [35.6 - 36.6] 36.2 [35.5 - 36.6] 36.0 [35.6 - 36.6] 0.888
Diuresis (mL)†
Whole group 0 [0 - 0] 40 [0 - 465] 191 [0 - 875] < 0.001
≥ |8|mEq/L 0 [0 - 0] 25 [0 - 463] 0‡ [0 - 600] 0.180
< |8|mEq/L 0 [0 - 0] 55 [0 - 420] 280 [10 - 895] 0.006
Fluid balance (mL)†
Whole group 0 [0 - 0] 0 [0 - 0] 0 [-720 - 969] 0.872
≥ |8|mEq/L 0 [0 - 0] 0 [0 -105] 0‡ [-310 - 796] 0.446
< |8|mEq/L 0 [0 - 0] 0 [0 -0] 0 [-905 - 994] 0.861
Na+ - sodium; CRRT - continuous renal replacement therapy; PaCO
2 - partial pressure of carbon dioxide; SBE - standard base excess; HCO3 - bicarbonate; K
+ - potassium; Na+ - Cl- -
sodium-chloride. * p value of the Friedman’s test, comparing the variables trough the time. † Diuresis and fluid balance are cumulative from the continuous renal replacement therapy beginning. ‡ p > 0.05 versus < |8|mEq/L group (Wilcoxon’s test). The results are expressed as the median (25% - 75%).
heparin.(22) However, the sodium load measured in
citrate salts is very high, which can worsen the serum sodium prediction after CRRT initiation. he practice of prescribing aluent sodium lower than the serum sodium concentration when using citrate-related anticoagulants is frequent.(9,23) In the present study, the
sodium concentration in aluent solutions was 10mEq/L lower than the serum sodium concentration when using 4% citrate and 4mEq/L lower than he serum sodium concentration when using 2.2% ACD-A, a inding
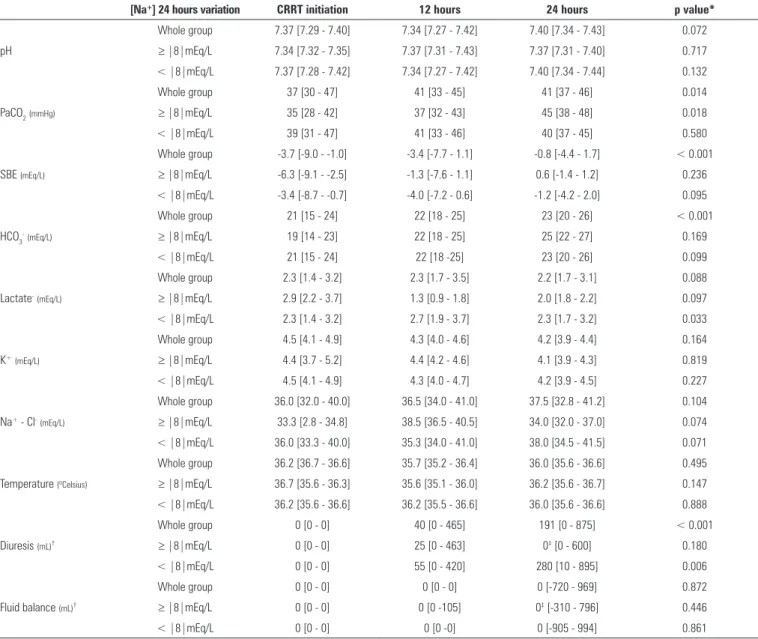
Table 4 - Continuous renal replacement therapy data during the first 24 hours
[Na+] 24 hours
variation CRRT initiation 12 hours 24 hours p value*
Blood flow (mL/minute)
Whole group 180 [150 - 180] 180 [150 - 180] 180 [150 - 180] 0.651
≥ |8| mEq/L 180 [158 - 180] 180 [180 - 180] 180 [150 - 180] 0.589
< |8| mEq/L 180 [158 - 180] 180 [150 - 195] 180 [150 - 180] 0.958
Dialysate flow (mL/hour)
Whole group 1000 [1000 - 1200] 1000 [1000 - 1200] 1000 [1000 - 1200]
---≥ |8| mEq/L 0 [0 - 0] 0 [0 - 0] 0 [0 - 0]
---< |8| mEq/L 1000 [1000 - 1300] 1000 [1000 - 1300] 1000 [1000 - 1300]
---Replacement fluid flow (mL/hour)
Whole group 2000 [1500 - 2500] 2000 [1500 - 2500] 2500 [1500 - 2500]
---≥ |8| mEq/L 2000 [1850 - 2000] 2000 [1850 - 2000] 2000 [1850 - 2000]
---< |8| mEq/L 2000 [1500 - 2500] 2000 [1500 - 2500] 2000 [1500 - 2500]
---ACD-A 2.2% flow (mL/hour)
Whole group 180 [180 - 180] 180 [180 - 180] 180 [180 - 182] 0.223
≥ |8| mEq/L 180 [180 - 180] 180 [180 - 180] 180 [180 - 180] 1.000
< |8| mEq/L 180 [180 - 180] 180 [180 - 180] 180 [180 - 190] 0.368
Citrate 4% flow (mL/hour)
Whole group 150 [140 - 160] 150 [140 - 160] 150 [140 - 160] 0.692
≥ |8| mEq/L 160 [145 - 170] 140 [135 - 145] 150 [140 - 160] 0.264
< |8| mEq/L 150 [140 - 160] 160 [140 - 160] 150 [140 - 160] 0.973
Volume of lavage (mL/hour)
Whole group 300 [225 - 300] 300 [300 - 300] 300 [188 - 300] 0.819
≥ |8| mEq/L 450 [375 - 525] 200 [150 - 250] 300 [200 - 300] 0.368
< |8| mEq/L 300 [150 - 300] 300 [300 - 300] 300 [225 - 300] 0.692
Affluent fluid [Na+] (mEq/L)
Whole group 138 [127 - 140] 138 [127 - 140] 139 [127 - 140] 1.000
≥ |8| mEq/L 140 [125 - 142] 140 [125 - 142] 140 † [125 - 142] 1.000
< |8| mEq/L 137 [128 - 140] 137 [128 - 140] 137 [128 - 140] 1.000
Ultrafiltration rate (mL/hour)
Whole group 100 [100 - 164] 150 [100 -2 00] 110 [100 - 164] 0.257
≥ |8| mEq/L 75 [50 - 125] 150 [130 - 164] 100 [100 - 100] 0.368
< |8| mEq/L 100 [100 - 164] 150 [100 - 200] 150 [100 - 200] 0.612
Effluent flow‡(mL/hour)
Whole group 2340 [1975 - 2794] 2270 [1808 - 2745] 2290 [1800 - 2730] 0.918
≥ |8|mEq/L 2225 [2010 - 3123] 2265 [1824 - 2655] 2360 [1910 - 2600] 0.895
< |8|mEq/L 2385 [1925 - 2784] 2270 [1835 - 2715] 2290 [1800 - 2735] 0.964
Na+ - sodium; CRRT - continuous renal replacement therapy; ACD-A - acid citrate dextrose - formula A. * p value of the Friedman’s test, comparing the variables trough the time. † - > 0.05
versus < |8|mEq/L group (Wilcoxon’s test). ‡ Effluent flow equalizes the sum of dialysate, replacement fluid, 2.2% ACD-A, 4% citrate, lavage and ultrafiltration rate. The results are expressed
as the median (25% - 75%).
concentration reduction; however, the serum sodium concentration decrease during the irst 24 hours of CRRT was approximately 9mEq/L, a inding that elicits concern when prescribing CRRT using any citrate formulation in hypernatremic patients.
he mathematical prediction of the 24-hour serum sodium behavior using the perfect admixture formula presented in this manuscript is not suitable for bedside use because the agreement with observed serum sodium was poor. However, there are some hypotheses in response to these results. First, the equilibrium of electrolytes across membranes, as low weight molecules, is theoretically perfect; however, mass transfer can be afected by many
other erratic factors; for instance, diferent charges in high weight organic molecules, which is also known as
the Gibbs-Donnan efect.(24) hus, sodium variation may
be unpredictable during medium to long time periods of CRRT.
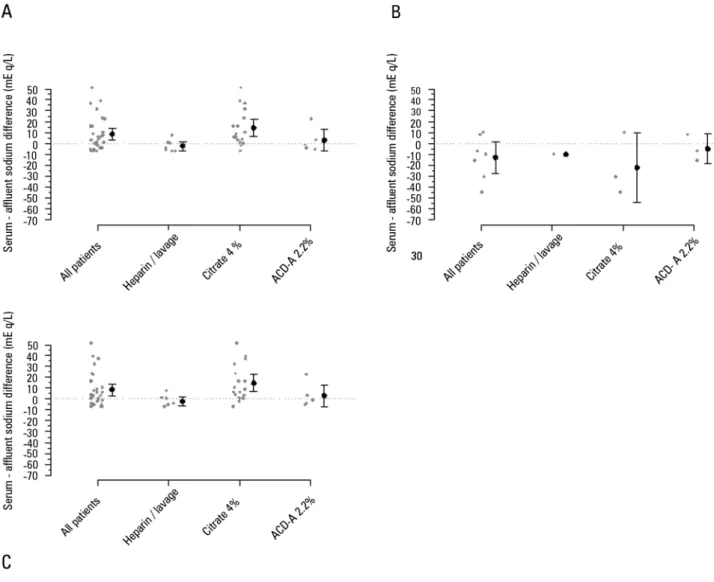
Figure 3 - Difference between serum and affluent sodium after 24 hours of continuous renal replacement therapy. A) All sessions of continuous venous-venous hemofiltration. B) Sessions where the sodium variation was ≥ |8|mEq/L. C) Session where the sodium variation was < |8|mEq/L. ACD-A - acid citrate dextrose - formula A. Gray points represent the session’s individual variations. Black points and bars represent the mean variation and 95% confidence interval.
of citrate was considered to be 1 for model simpliication; however, this inding may not hold true because the sieving coeicient is actually approximately 0.9.
his study has some limitations. First, the small sample size could potentially reduce the sensitivity of the analyses for relevant associations. Second, there were no patients with severe hyponatremia, and thus, this subgroup was not well evaluated. hird, the outcome measure (sodium variation ≥ 8mEq/L) might be too strict, and smaller variations could have occurred using citrate-based anticoagulation; however, we believe they are not very relevant to clinical practice. Fourth, this study represents the practice of only
Figure 4 - Bland-Altman diagram showing the agreement between the serum sodium predicted using the total admixture formula and serum sodium after 24 hours of continuous renal replacement therapy initiation.
CONCLUSIONS
Hypernatremia at the time of continuous renal replacement therapy initiation is an important factor that is associated with clinically signiicant serum sodium
Objetivo: Investigar os fatores clínicos e laboratoriais associados com a variação dos níveis séricos de sódio durante terapia renal substitutiva contínua e avaliar se a fórmula de mixagem perfeita pode prever a variação do sódio nas 24 horas.
Métodos: A partir de uma base de dados coletada de forma prospectiva, recuperamos e analisamos os dados referentes a 36 sessões de terapia renal substitutiva realizadas em 33 pacientes, nas quais a prescrição de aluentes permaneceu inalterada durante as primeiras 24 horas. Aplicamos um modelo linear misto para investigar os fatores associados com grandes variações dos níveis séricos de sódio (≥ 8mEq/L) e geramos um gráico de Bland-Altman para avaliar a concordância entre as variações previstas e observadas.
Resultados: Nas sessões de terapia renal substitutiva de 24 horas identiicamos que SAPS 3 (p = 0,022) e hipernatremia
basal (p = 0,023) foram preditores estatisticamente signiicantes de variações séricas do sódio ≥ 8mEq/L na análise univariada, porém apenas hipernatremia demonstrou uma associação independente (β = 0,429; p < 0,001). A fórmula de mixagem perfeita para previsão do nível de sódio após 24 horas demonstrou baixa concordância com os valores observados.
Conclusões: A presença de hipernatremia por ocasião do início da terapia renal substitutiva é um fator importante associado com variações clinicamente signiicativas dos níveis séricos de sódio. O uso de citrato 4% ou da fórmula A de ácido citrato dextrose 2,2% como anticoagulantes não se associou com variações mais acentuadas dos níveis séricos de sódio. Não foi viável desenvolver uma predição matemática da concentração do sódio após 24 horas.
RESUMO
Descritores: Terapia de substituição renal; Hemoiltração; Hemodiailtração; Sódio; Cuidados críticos
variations, and the intensivist should be aware of this inding when continuous renal replacement therapy is started. he use of 4% citrate or 2.2% acid citrate dextrose - formula A as anticoagulants is not associated with serum sodium variations ≥ 8mEq/L if the initial aluent luid prescription considers its sodium content in advance. he use of a speciic mathematical calculation could not predict the 24-hour sodium variation.
ACKNOWLEDGEMENTS
We thank the nephrology center of both hospitals (Hospital Sírio-Libanês and Hospital das Clínicas of the Universidade de São Paulo), which performed the renal replacement therapy of patients in this study.
Authors’ contributions
REFERENCES
1. Mehta RL, McDonald B, Gabbai FB, Pahl M, Pascual MT, Farkas A, Kaplan RM; Collaborative Group for Treatment of ARF in the ICU. A randomized clinical trial of continuous versus intermittent dialysis for acute renal failure. Kidney Int. 2001;60(3):1154-63.
2. Fletcher JJ, Bergman K, Carlson G, Feucht EC, Blostein PA. Continuous renal replacement therapy for refractory intracranial hypertension? J Trauma. 2010;68(6):1506-9.
3. Lin CM, Lin JW, Tsai JT, Ko CP, Hung KS, Hung CC, et al. Intracranial pressure fluctuation during hemodialysis in renal failure patients with intracranial hemorrhage. Acta Neurochir Suppl. 2008;101:141-4. 4. Henrich WL, Woodard TD, Blachley JD, Gomez-Sanchez C, Pettinger W,
Cronin RE. Role of osmolality in blood pressure stability after dialysis and ultrafiltration. Kidney Int. 1980;18(4):480-8.
5. Adrogué HJ, Madias NE. Hypernatremia. N Engl J Med.
2000;342(20):1493-9.
6. Rasouli M, Kalantari KR. Comparison of methods for calculating serum osmolality: multivariate linear regression analysis. Clin Chem Lab Med. 2005;43(6):635-40.
7. Adrogué HJ, Madias NE. Hyponatremia. N Engl J Med. 2000;342(21):1581-9. Review.
8. Bai M, Zhou M, He L, Ma F, Li Y, Yu Y, et al. Citrate versus heparin anticoagulation for continuous renal replacement therapy: an updated meta-analysis of RCTs. Intensive care medicine. 2015;41(12):2098-110. 9. Morgera S, Schneider M, Slowinski T, Vargas-Hein O, Zuckermann-Becker
H, Peters H, et al. A safe citrate anticoagulation protocol with variable treatment efficacy and excellent control of the acid-base status. Crit Care Med. 2009;37(6):2018-24.
10. Kozik-Jaromin J, Nier V, Heemann U, Kreymann B, Böhler J. Citrate pharmacokinetics and calcium levels during high-flux dialysis with regional citrate anticoagulation. Nephrol Dial Transplant. 2009;24(7):2244-51. 11. Chadha V, Garg U, Warady BA, Alon US. Citrate clearance in children
receiving continuous venovenous renal replacement therapy. Pediatr Nephrol. 2002;17(10):819-24.
12. Tolwani AJ, Prendergast MB, Speer RR, Stofan BS, Wille KM. A practical citrate anticoagulation continuous venovenous hemodiafiltration protocol for metabolic control and high solute clearance. Clin J Am Soc Nephrol. 2006;1(1):79-87.
13. Morabito S, Pistolesi V, Tritapepe L, Fiaccadori E. Regional citrate anticoagulation for RRTs in critically ill patients with AKI. Clin J Am Soc Nephrol. 2014;9(12):2173-88.
14. Huang C, Zhang P, Du R, Li Y, Yu Y, Zhou M, et al. Treatment of acute hypernatremia in severely burned patients using continuous veno-venous hemofiltration with gradient sodium replacement fluid: a report of nine cases. Intensive Care Med. 2013;39(8):1495-6.
15. Bland JM, Altman DG. Statistical methods for assessing agreement between two methods of clinical measurement. Lancet. 1986;1(8476):307-10.
16. Team RDC. R: A language and environment for statistical computing. Viena, Austria: R Foundation for Statistical Computing; 2009.
17. Colì L, La Manna G, Comai G, Ursino M, Ricci D, Piccari M, et al. Automatic adaptive system dialysis for hemodialysis-associated hypotension and intolerance: a noncontrolled multicenter trial. Am J Kidney Dis. 2011;58(1):93-100.
18. Kong X, Wen JQ, Qi RF, Luo S, Zhong JH, Chen HJ, et al. Diffuse interstitial brain edema in patients with end-stage renal disease undergoing hemodialysis: a tract-based spatial statistics study. Medicine (Baltimore). 2014;93(28):e313.
19. Han SS, Bae E, Kim DK, Kim YS, Han JS, Joo KW. Dysnatremia, its correction, and mortality in patients undergoing continuous renal replacement therapy: a prospective observational study. BMC Nephrol. 2016;17:2.
20. Dangoisse C, Dickie H, Tovey L, Ostermann M. Correction of hyper- and hyponatraemia during continuous renal replacement therapy. Nephron Clin Pract. 2014;128(3-4):394-8.
21. Stelfox HT, Ahmed SB, Khandwala F, Zygun D, Shahpori R, Laupland K. The epidemiology of intensive care unit-acquired hyponatraemia and hypernatraemia in medical-surgical intensive care units. Crit Care. 2008;12(6):R162.
22. Schilder L, Nurmohamed SA, Bosch FH, Purmer IM, den Boer SS, Kleppe CG, Vervloet MG, Beishuizen A, Girbes AR, Ter Wee PM, Groeneveld AB; CASH study group. Citrate anticoagulation versus systemic heparinisation in continuous venovenous hemofiltration in critically ill patients with acute kidney injury: a multi-center randomized clinical trial. Crit Care. 2014;18(4):472.
23. Gattas DJ, Rajbhandari D, Bradford C, Buhr H, Lo S, Bellomo R. A Randomized Controlled Trial of Regional Citrate Versus Regional Heparin Anticoagulation for Continuous Renal Replacement Therapy in Critically Ill Adults. Crit Care Med. 2015;43(8):1622-9.
24. Nguyen MK, Kurtz I. Quantitative interrelationship between Gibbs-Donnan equilibrium, osmolality of body fluid compartments, and plasma water sodium concentration. J Appl Physiol. 2006;100(4):1293-300.w 25. Cressoni M, Zanella A, Epp M, Corti I, Patroniti N, Kolobow T, et al.
![Table 4 - Continuous renal replacement therapy data during the first 24 hours [Na + ] 24 hours](https://thumb-eu.123doks.com/thumbv2/123dok_br/19077293.492384/9.892.71.828.124.717/table-continuous-renal-replacement-therapy-data-hours-hours.webp)