The use of World Health Organization growth curves in children and
adolescents that live in regions of moderate altitude
O uso das curvas de crescimento da Organização Mundial da Saúde em crianças e adolescentes que vivem em regiões de altitude moderada
El uso de curvas de crecimiento de la Organización Mundial de la Salud en niños y adolescentes que viven en regiones de altitud moderada
Marco Antonio Cossio-Bolaños1, Thiago Santi Maria2, Rossana Gomez Campos3, Eduardo Henrique F. Pascoal4, Jefferson Eduardo Hespanhol5,
Miguel de Arruda6
Instituição: Faculdade de Educação Física da Universidade Estadual de Campinas (Unicamp), Campinas, SP, Brasil
1Doutor em Ciências do Esporte na Faculdade de Educação Física da
Unicamp; Estagiário do Laboratório de Ciências Morfofuncionais da Faculdade de Medicina da Universidade de Córdoba, Córdoba, Espanha
2Mestrando na Faculdade de Educação Física da Unicamp, Campinas,
SP, Brasil
3Doutoranda na Faculdade de Educação Física da Unicamp e na
Universidade Católica de Valencia, Valência, Espanha
4Bacharel em Educação Física pela Unicamp, Campinas, SP, Brasil
5Doutor em Educação Física na Faculdade de Educação Física da Unicamp;
Professor da Faculdade de Educação Física da Pontifícia Universidade Católica de Campinas (PUC-Campinas), Campinas, SP, Brasil
6Doutor em Ciências do Esporte na Faculdade de Educação Física da
Unicamp; Professor Titular da Faculdade de Educação Física da Unicamp, Campinas, SP, Brasil
ABSTRACT
Objective: To determine the applicability of the World Health Organization growth curves in school children that live in areas of moderate altitude.
Methods: A cross-sectional study, using a stratified random sample of 955 children and adolescents aged 6 to 12 years-old (473 boys and 482 girls) attending public schools in the urban area of Arequipa (Peru). The evaluated variables included body mass (kg) and height (m) values
and the body mass index. Z score and the t test for paired
measurements were applied for statistical analysis.
Results: The boys had similar values of body mass when compared with the reference. However, girls showed higher values than the reference at ages six, seven,
and ten years-old (p<0.001). For height and body mass
in-dex, differences (p<0.001) were noted between the reference and the school children living in areas of moderate altitude for all ages and genders, being the height lower than the ref-erence and the body mass index higher than the reference. Z scores for the body mass index were: boys – 1.0 (six
years-old), 0.69 (seven years-years-old), 0.50 (eight years-years-old), 1.20 (nine years-old), 0.75 (ten years-old), 0.41 (11 years-old) and 0.82 (12 years-old); girls – 0.36 (six years-old), 0.53 (seven and eight old), 0.48 (nine old), 0.89 (10 years-old), 0.55 (11 years-old), and 0.43 (12 years-old).
Conclusions: The body mass index should not be ap-plied to children and adolescents that live in regions of moder-ate altitude. The linear growth retardation presented by this population directly compromises the results of this index.
Key-words: school; children; adolescents; body mass index; altitude.
RESUMO
Objetivo: Determinar a aplicabilidade do uso das curvas de crescimento da Organização Mundial da Saúde (OMS) em escolares que vivem em regiões de altitude moderada.
Métodos: Estudo transversal cuja população foi consti-tuída por uma amostra probabilística estratificada com 955 crianças e adolescentes de seis a 12 anos, sendo 473 meninos
Endereço para correspondência: Marco Antonio Cossio
Avenida Erico Verissimo, 701 – Cidade Universitária CEP 13083-851 – Campinas/SP
E-mail: [email protected]
Fonte financiadora: Coordenação de Aperfeiçoamento de Pessoal de Nível Superior (Capes)
Conflito de interesse: nada a declarar
e 482 meninas que frequentavam escolas públicas da área urbana da Região de Arequipa (Peru). As variáveis avaliadas envolveram medidas de massa corpórea (kg) e estatura (m) e índice de massa corporal. Para as comparações, utilizou-se o escore Z e o teste t para medidas pareadas.
Resultados: Os meninos apresentaram valores similares de massa corpórea quando comparados com a referência. No entanto, as meninas mostraram valores superiores à referência nas idades de seis, sete e dez anos (p<0,001). No caso da estatura e do índice de massa corporal, houve dife-renças (p<0,001) entre a referência e os escolares de mode-rada altitude em todas as idades e em ambos os sexos, com estatura inferior à referência e, consequentemente, maior índice de massa corporal, sendo o escore Z para os meninos: 1,0 (seis anos), 0,69 (sete anos), 0,50 (oito anos), 1,20 (nove anos), 0,75 (dez anos) 0,41 (11 anos) e 0,82 (12 anos); para as meninas, 0,36 (seis anos), 0,53 (sete e oito anos), 0,48 (nove anos), 0,89 (dez anos), 0,55 (11 anos) e 0,43 (12 anos).
Conclusões: O índice de massa corporal não deve ser aplicado a crianças e adolescentes de moderada altitude devido ao retardo no crescimento linear, o que compromete o resultado final deste índice.
Palavras-chave: escolares; crianças; adolescentes; índice de massa corporal; altitude.
RESUMEN
Objetivo: Determinar la aplicabilidad del uso de curvas de crecimiento de la Organización Mundial de la Salud en escolares que viven en regiones de altitud moderada.
Métodos: Estudio transversal, cuya población fue cons-tituida por una muestra probabilística estratificada con 955 niños y adolescentes de seis a 12 años de edad, siendo 473 muchachos y 482 muchachas, que frecuentaban escuelas públicas de área urbana de la Región de Arequipa (Perú). Las variables evaluadas implicaron medidas de masa cor-poral (kg) y estatura (m) y el índice de masa corcor-poral. Para las comparaciones, se utilizó el escore Z y la prueba t para medidas pareadas.
Resultados: Los muchachos presentaron valores similares de masa corporal cuando comparados con la referencia. Sin embargo, las muchachas mostraron valores superiores a la referencia en las edades de seis, siete y diez años (p<0,001). En el caso de la estatura y del índice de masa corporal, hubo diferencias (p<0,001) entre la referencia de los escolares de moderada altitud en todas las edades y en ambos sexos,
con estatura inferior a la referencia y, como consecuencia, mayor índice de masa corporal, siendo el escore Z para los muchachos: 1,0 (seis años), 0,69 (siete años), 0,50 (ocho años), 1,20 (nueve años), 0,75 (diez años), 0,41 (11 años) y 0,82 (12 años) y, para las muchachas, 0,36 (seis años), 0,53 (siete y ocho años), 0,48 (nueve años), 0,89 (diez años), 0,55 (11 años) y 0,43 (12 años).
Conclusiones: El índice de masa corporal no debe ser aplicado a niños y adolescentes de moderada altitud debido al retraso en el crecimiento lineal, lo que compromete el resultado final de este índice.
Palabras clave: escolares; niños; adolescentes; índice de masa corporal; altitud.
Introduction
Nutritional status can be assessed by several different tech-niques, including patient interviews, biochemical analyses and anthropometric assessments. The anthropometric ap-proach is the most convenient and the simplest(1) and height, body weight, circumferences, skin folds and bone diameters
may be measured(2). These variables can be used to achieve
a range of objectives and can be converted into indicators suitable for identifying risks, for planning interventions and for use in investigations of their impact on nutritional
status and health(3). Notwithstanding, interpreting them
requires reference standards. Conde and Monteiro(4)
recom-mend reference curves for this purpose, claiming that they are based on a healthy empirical model and can be used to classify and diagnose the nutritional status of both individu-als and populations.
Several studies have been conducted in high-altitude regions, using the World Health Organization (WHO) and/or National Center for Health Statistics reference
standards to assess physical growth(5-8) and the prevalence
of obesity among the children and adolescents who live in these areas(9-11). These studies indicate that populations that are in the process of growth and development and live at high altitudes suffer a negative impact from altitude-induced hypoxia, inding that their height is from 1 to 4
cm below the 50th percentile on the reference curves(2).
Although, in general, the WHO(12) and some authors(13,14) suggest that body mass index (BMI) should be used to identify and diagnose overweight and obesity, irrespec-tive of the geographic region of the population being
adolescents from populations living at high altitudes have shorter stature because of the altitude, which in turn can affect the ratio of weight to height. In turn, allometric laws
state that shape is unavoidably changed by body weight(15).
Applying BMI to people of shorter stature, such as children and adolescents from high altitude regions, could therefore
be inappropriate(16). There is little literature on physical
growth at altitude, particularly with reference to applying BMI to children and adolescents. In view of this situation, the objective of this study was to determine whether the WHO growth curves are applicable to boys and girls living at moderate altitude (2,320m).
Methods
This was a descriptive, cross-sectional study using data from a longitudinal project begun in 2000 and expected to run until 2015. The study participants were schoolchildren enrolled at public schools in Arequipa province, Peru. The
region has a surface area of 63.528km2 and a population of
1,200,000 inhabitants(17). The province is located in South
America, in the South, at an altitude of 2,320m above sea level, at a longitude of 71° 31’ West of Greenwich and a latitude of 16° 23’ South.
The study sample was recruited from a population of 6,659 schoolchildren aged six to 12 years (3,300 boys and 3,359 girls) enrolled at the four public schools in Arequipa’s
urban areas. The sample size was calculated on the basis of a probabilistic sample frame stratiied by ixed proportions, with a 95% conidence interval and a 5% sampling error, resulting in a minimum sample of 473 (14.3%) boys and 482 (14.3%) girls. The schoolchildren selected were from medium socioeconomic status families (medium/medium and medium/low), since in Peru those schoolchildren who go to school in urban and suburban areas are generally from low socioeconomic status backgrounds and those who live in rural areas at high altitudes have very low socioeconomic status. Children who lived in suburban areas or who were born in areas at sea level were excluded from the sample. The sample therefore comprised children and adolescents who lived at moderate altitude (in Arequipa) and in neighboring areas at the same altitude.
The anthropometric variables body weight and height were measured according to procedures standardized by the International Working Group on Kinanthropometry, as de-scribed by Ross and Marfell-Jones(18): body weight was measured in kg using a Tanita® digital balance with 200g precision and
a range of 0 to 150kg; height was measured in m using a Seca®
aluminum stadiometer with a scale from 0 to 2.5m marked in mm. The Quetelet formula was used to calculate BMI from body
weight and height: [BMI=weight (kg)/height (m)2]. Weight
(kg) and height (m) were each measured twice by a single ex-aminer, with a technical error of measurement of less than 3% and excellent reproducibility (r=0.98 to 0.99).
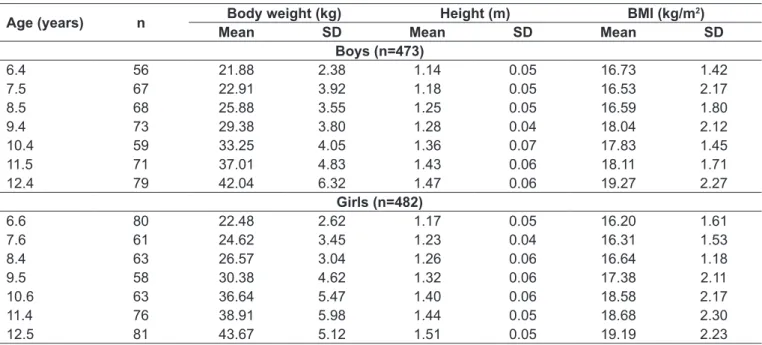
Table 1 - Anthropometric characteristics of children and adolescents living at moderately high altitude
Age (years) n Body weight (kg) Height (m) BMI (kg/m
2)
Mean SD Mean SD Mean SD
Boys (n=473)
6.4 56 21.88 2.38 1.14 0.05 16.73 1.42
7.5 67 22.91 3.92 1.18 0.05 16.53 2.17
8.5 68 25.88 3.55 1.25 0.05 16.59 1.80
9.4 73 29.38 3.80 1.28 0.04 18.04 2.12
10.4 59 33.25 4.05 1.36 0.07 17.83 1.45
11.5 71 37.01 4.83 1.43 0.06 18.11 1.71
12.4 79 42.04 6.32 1.47 0.06 19.27 2.27
Girls (n=482)
6.6 80 22.48 2.62 1.17 0.05 16.20 1.61
7.6 61 24.62 3.45 1.23 0.04 16.31 1.53
8.4 63 26.57 3.04 1.26 0.06 16.64 1.18
9.5 58 30.38 4.62 1.32 0.06 17.38 2.11
10.6 63 36.64 5.47 1.40 0.06 18.58 2.17
11.4 76 38.91 5.98 1.44 0.05 18.68 2.30
12.5 81 43.67 5.12 1.51 0.05 19.19 2.23
The study was approved by the Research Ethics Committee at the University Sports Institute at the Universidade Nacional de San Agustín (Arequipa, Peru). Parents and/or guardians were informed about the study and completed free and informed consent forms.
The decision was taken to compare the results of this study against the median weight, height and BMI on the
WHO(12) reference curves because these are the curves most
often utilized in Peru and are recommended by the Ministry of Health in Brazil.
The results obtained were used to generate descriptive statistics. Z scores ± standard deviations (SD) were calculated from the study data in order to enable comparison with the reference standard. Positive Z scores indicate greater mag-nitude than the reference population and negative Z scores
indicate lower values than the WHO reference. The t test
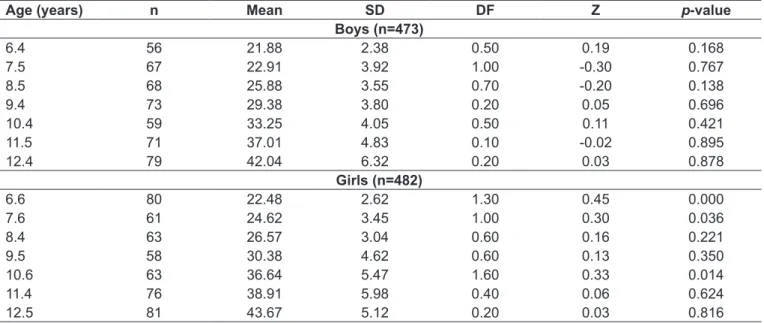
Table 2 - Figures for body weight of children and adolescents living at moderately high altitude and comparison with the World Health Organization reference
Age (years) n Mean SD DF Z p-value
Boys (n=473)
6.4 56 21.88 2.38 0.50 0.19 0.168
7.5 67 22.91 3.92 1.00 -0.30 0.767
8.5 68 25.88 3.55 0.70 -0.20 0.138
9.4 73 29.38 3.80 0.20 0.05 0.696
10.4 59 33.25 4.05 0.50 0.11 0.421
11.5 71 37.01 4.83 0.10 -0.02 0.895
12.4 79 42.04 6.32 0.20 0.03 0.878
Girls (n=482)
6.6 80 22.48 2.62 1.30 0.45 0.000
7.6 61 24.62 3.45 1.00 0.30 0.036
8.4 63 26.57 3.04 0.60 0.16 0.221
9.5 58 30.38 4.62 0.60 0.13 0.350
10.6 63 36.64 5.47 1.60 0.33 0.014
11.4 76 38.91 5.98 0.40 0.06 0.624
12.5 81 43.67 5.12 0.20 0.03 0.816
SD: standard deviation; DF: difference between means; Z: Z score
Table 3 - Figures for height of children and adolescents living at moderately high altitude and comparison with the World Health Organization reference
Age (years) n Mean SD DF Z p-value
Boys (n=473)
6.4 56 114.00 5.00 3.50 -0.78 0.000
7.5 67 118.00 5.00 6.10 -1.11 0.000
8.5 68 125.00 5.00 4.50 -0.73 0.000
9.4 73 128.00 4.00 6.30 -1.03 0.000
10.4 59 136.00 7.00 3.50 -0.54 0.000
11.5 71 143.00 6.00 2.50 -0.36 0.009
12.4 79 147.00 6.00 4.30 -0.60 0.000
Girls (n=482)
6.6 80 117.00 5.00 1.00 -0.19 0.152
7.6 61 123.00 4.00 0.70 -0.12 0.357
8.4 63 126.00 6.00 2.50 -0.42 0.002
9.5 58 132.00 6.00 3.00 -0.48 0.006
10.6 63 140.00 6.00 1.80 -0.28 0.039
11.4 76 144.00 5.00 3.10 -0.46 0.000*
12.5 81 150.00 4.00 3.60 -0.52 0.000*
for paired samples was used to identify signiicant differ-ences between the two groups. Data were tested for normal distribution using the Kolmogorov-Smirnov method.
Results
Table 1 lists the anthropometric data for body weight (kg), height (m) and BMI, for the children and adolescents, broken down by sex and age. Weight and height of both boys and girls and BMI for girls followed a rising path, whereas there were certain variations in BMI for the boys as age increased.
Tables 2, 3 and 4 show the variables body weight (kg), height (m) and BMI by decimalized age. The tables provide
the mean (X), SD, difference between means, Z score, t
statistic and p-value for each comparison between the study
results and the reference curves. In terms of body weight, the results of this study are similar to the WHO reference, although the girls were heavier at six, seven and ten years of age (Table 2).
Table 3 shows the comparison between the heights (m) of the schoolchildren analyzed here and the height refer-ence curves, showing that the boys’ height was signiicantly different from the reference height at all ages and that the girls were different from eight to 12 years of age. In other words, the results show that these children and adolescents from moderately high altitude areas have short stature when compared with the WHO reference on the basis of Z scores.
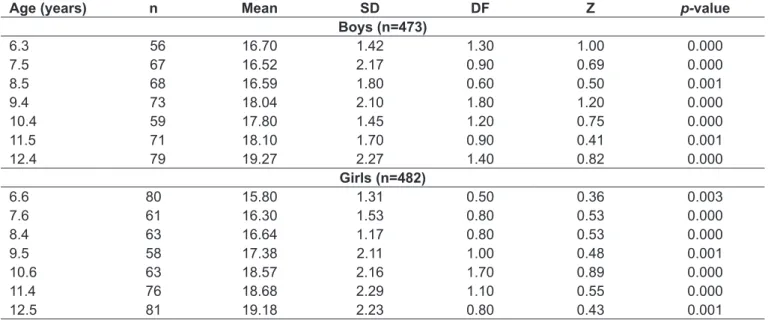
The results for BMI revealed signiicant differences for both sexes at all age groups, with the children studied here having BMI above the WHO reference for their sex and age (Table 4).
Discussion
The results of this study indicate that schoolchildren resi-dent in regions at moderate altitude have body weight that
is similar to the median on the WHO reference curves(12),
but have signiicantly shorter stature, at all ages in the case of the boys and from eight to 12 years of age for the girls. As a consequence, the children and adolescents analyzed had BMI values signiicantly higher than the corresponding points on the growth reference curves.
These results provide evidence that BMI is not applicable to children and adolescents from moderately high altitudes, since it has been demonstrated experimentally that it is not appropriate to use BMI with people of short stature(16), which is the case of the schoolchildren from areas at altitude who were investigated here. This is because BMI is not applicable as an indicator of obesity to human populations who are in the process of growing and who exhibit marked differences
in stature(19), since their bodies’ proportions have not yet
attained their adult state, leading to bias.
Therefore, it is notable that the results of this study in-clude igures for height that are shorter than the reference values, providing further evidence of the retarded physical
Table 4 - Figures for body mass index of children and adolescents living at moderately high altitude and comparison with the World Health Organization
Age (years) n Mean SD DF Z p-value
Boys (n=473)
6.3 56 16.70 1.42 1.30 1.00 0.000
7.5 67 16.52 2.17 0.90 0.69 0.000
8.5 68 16.59 1.80 0.60 0.50 0.001
9.4 73 18.04 2.10 1.80 1.20 0.000
10.4 59 17.80 1.45 1.20 0.75 0.000
11.5 71 18.10 1.70 0.90 0.41 0.001
12.4 79 19.27 2.27 1.40 0.82 0.000
Girls (n=482)
6.6 80 15.80 1.31 0.50 0.36 0.003
7.6 61 16.30 1.53 0.80 0.53 0.000
8.4 63 16.64 1.17 0.80 0.53 0.000
9.5 58 17.38 2.11 1.00 0.48 0.001
10.6 63 18.57 2.16 1.70 0.89 0.000
11.4 76 18.68 2.29 1.10 0.55 0.000
12.5 81 19.18 2.23 0.80 0.43 0.001
growth of children and adolescents of both sexes living in regions with distinctive geographic conditions, such as high altitude, and which has been demonstrated previously(7,8,20,21). Stinson(21) and Greksa(22) reported that this speciic popula-tion exhibits a small degree of retardapopula-tion in linear growth (1 to 4cm) and also in sexual and skeletal maturation.
Therefore, it is possible to use the WHO body weight and height curves with children and adolescents from moderately high-altitude areas, whether for diagnosis of nutritional sta-tus and monitoring of physical growth or to determine the impact of environmental factors. In contrast, BMI should not be used with this type of population since it is directly affected by height, leading to erroneous nutritional diag-noses. Using BMI without correcting for allometry leads to overestimation of excess fat in people of short stature and underestimation in people with tall stature. These biases sup-port the assumption that increases and/or reductions in the height of different populations could lead studies of secular growth trends to reach erroneous conclusions, overestimat-ing the tendency and incidence of underweight, normality, overweight or obesity.
On the other hand, it is evident that there is a scarcity of studies producing references for populations in regions with speciic geographic characteristics such as high altitude that would make it possible to assess their nutritional status and physical growth with greater clarity. The majority of studies undertaken in high-altitude regions are obliged to compare their results against the WHO and/or National Center for Health Statistics references because there are no appropri-ate reference standards available for comparison, which is particularly true of Peru.
Indeed, the most important contribution of this study is the evidence of the impact of altitude on the height of children and adolescents of both sexes, which inevitably af-fects their BMI. As a result, the children and adolescents in this study were classiied as having overweight and obesity when compared with the reference and even when compared
with the results of studies conducted in the same geographic areas(23,24) and at low altitude(25,26), with overweight and obesity predominating.
Notwithstanding, some studies have shown that appe-tite is suppressed in high-altitude areas and in conditions
of hypoxia, leading to weight loss(27-29), which would be
expected to lead to a lower prevalence of overweight and obesity among children and adolescents. However, this inding must be considered in conjunction with many other factors that affect the nutritional status of children and adolescents, such as hormonal, metabolic, psychological and genetic factors, dietary habits and reduced physical activ-ity levels. Irrespective of the geographic region, all of these can trigger the gradual development of countless chronic-degenerative dysfunctions, such as obesity, dyslipidemia, diabetes mellitus, cardiovascular diseases and hypertension, at ever younger ages.
Finally, it should be pointed out that this study suf-fers from certain limitations. The study did not control for physical activity level, diet or biological maturity and these variables could have affected the linear growth of the children and adolescents studied. Additionally, assessing so-cioeconomic status directly by administering a standardized questionnaire would have provided a more complete descrip-tion of the sample. These limitadescrip-tions could therefore affect the overall results of the study, which should be interpreted with care. Despite these limitations, it is believed that the results of this study are still relevant, in view of the large number of children and adolescents investigated and because of the absence of studies of people living at moderately high altitude in Peru’s different geographic regions.
In conclusion, the sample studied had shorter stature than the WHO reference, probably as a result of the im-pact that altitude appears to have on the height of the schoolchildren analyzed here. As a result, BMI should not be relied on for this type of population, since it can over-estimate excess fat in people of short stature.
References
1. Dezenberg CV, Nagy TR, Gower BA, Johnson R, Goran MI. Predicting body composition from anthropometry in pre-adolescent children. Int J Obes Relat Metab Disord 1999;23:253-9.
2. Cossio-Bolaños MA, Arruda M, Gómez RA. Características antropométricas de niños y adolescentes de altura. In: Salazar CM, Figueroa JA, Valdivia JE, López SH, Larios MJ, Mora SW et al,editors. Usos y representaciones de las prácticas físicas-deportivas de los jóvenes mexicanos. Guadalajara: Universidad Colima; Universidad Veracruzana; 2010. p. 185-99.
3. Kaufer-Horwitz M, Toussaint G. Anthropometric indexes to evaluate pediatric overweight and obesity. Bol Med Hosp Infant Mex 2008;65:502-18. 4. Conde WL, Monteiro CA. Body mass index cutoff points for evaluation of
nutritional status in Brazilian children and adolescents. J Pediatr (Rio J) 2006;82:266-72.
6. Stinson S. The physical growth of high altitude Bolivian Aymara children. Am J Phys Anthropol 1980;52:377-85.
7. Pawson IG, Huicho L, Muro M, Pacheco A. Growth of children in two economically diverse Peruvian high-altitude communities. Am J Hum Biol 2001;13:323-40. 8. Cossio-Bolaños MA, Arruda M, Campo RG. Physical growth in children from
6 to 12 years of medium altitude of Arequipa – Peru (3220 msnm). Rev Int Cienc Deporte 2009;14:32-44.
9. Omori K, Greksa LP. Growth and health status of preschool Karen higlanders. Ann Hum Biol 1993;20:21-30.
10. Obert P, Fellmann N, Falgairette G, Bedu M, Van Praagh E, Kemper H et al. The importance of socioeconomic and nutritional conditions rather than altitude on the physical growth of prepubertal Andean highland boys. Ann Hum Biol 1994;21:145-54.
11. Mispireta ML, Rosas AM, Velásquez JE, Lescano AG, Lanata CF. Transición nutricional en el Perú, 1991-2005. Rev Peru Med Exp Salud Publica 2007;24:129-35.
12. WHO Multicentre Growth Reference Study Group. Assessment of differences in linear growth among populations in the WHO Multicentre Growth Reference Study. Acta Paediatr 2006;450(Suppl);56-65.
13. Taylor RW, Jones IE, Williams SM, Goulding A. Body fat percentages measured by dual-energy X-ray absorptiometry corresponding to recently recommended body mass index cutoffs for overweight and obesity in children and adolescents aged 3-18 y. Am J Clin Nutr 2002;76: 1416-21.
14. Zimmermann MB, Gübeli C, Püntener C, Molinari L. Detection of overweight and obesity in a national sample of 6–12-y-old Swiss children: accuracy and validity of reference values for body mass index from the US Centers for Disease Control and Prevention and the International Obesity Task Force. Am J Clin Nutr 2004;79:838-43.
15. Schmidt-Nielsen K. Scaling: why is animal size so important? New York: Cambridge University Press; 1984.
16. Lara-Esqueda A, Aguilar-Salinas CA, Velazquez-Monroy O, Gómez-Pérez FJ, Rosas-Peralta M, Mehta R et al. The body mass index is a less-sensitive tool for detecting cases with obesity-associated co-morbidities in short stature subjects. Int J Obes Relat Metab Disord 2004;28:1443-50.
17. Perú – Instituto Nacional de Estadística e Informática. Encuesta Demográica y de Salud Familiar 2004-2005. Lima: INEI; 2005.
18. Ross WD, Marfell-Jones MJ. Kinanthropometry. In: MacDougall JD, Wenger HA, Geen HJ, editors. Physiological tests for elite athletes. London: Human Kinetics; 1991. p. 223-308.
19. Fernández López JA, Remesar X, Alemany M. Ventajas teóricas del índice de Rohrer (P/A3) sobre el índice de masa corporal (P/A2) para la estimación de la adiposidad en humanos. Rev Esp Obes 2005;3:47-55.
20. Beall C, Baker PT, Baker TS, Haas JD. The effects of high altitude on adolescent growth in southern Peruvian Ameridians. Hum Biol 1977;49:109-24.
21. Stinson S. The effect of high altitude on the growth of children of high socioeconomic status in Bolivia. Am J Phys Anthropol 1982;59:61-71. 22. Greksa LP. Growth and development of Andean high altitude residents. High
Alt Med Biol 2006;7:116-24.
23. Gonzales GF, Villena A. Body mass index and age at menarche in Peruvian children living at high altitude and at sea level. Hum Biol 1996;68: 265-75.
24. Pawson IG, Huicho L. Persistence of growth stunting in a Peruvian high altitude community, 1964-1999. Am J Hum Biol 2010;22:367-74. 25. Peltz G, Aguirre MT, Sanderson M, Fadden MK. The role of fat mass index
in determining obesity. Am J Hum Biol 2010;22:639-47.
26. Al Herbish AS, El Mouzan MI, Al Salloum AA, Al Qureshi MM, Al Omar AA, Foster PJ et al. Body mass index in Saudi Arabian children and adolescents: a national reference and comparison with international standards. Ann Saudi Med 2009;29:342-7.
27. Guilland JC, Klepping J. Nutritional alterations at high altitude in man. Eur J Appl Physiol Occup Physiol 1985;54:517-23.
28. Tschöp M, Strasburger CJ, Hartmann G, Biollaz J, Bärtsch P. Raised leptin concentrations at high altitude associated with loss of appetite. Lancet 1998;352:1119-20.