ISSN 1553-345X
© 2009 Science Publications
Corresponding Author: A.M. Thamer, Department of Civil Engineering, Faculty of Engineering, University Putra Malaysia, 43400 UPM Serdang, Selangor, Malaysia
Investigating the Effect of Three Nitrate Fertilizers on Nitrate
Leaching under the Root Zone in Clay Loam Soil
1
Thamer
Ahmed Mohammed,
1Nooshin
M.,
1Megat Johari Megat Mohd. Noor and
2A. Liaghat
1Department of Civil Engineering, Faculty of Engineering,
University Putra Malaysia, 43400 UPM Serdang, Selangor, Malaysia
2Department of Irrigation and Reclamation Engineering, University of Tehran, Tehran, Iran
Abstract: Problem statements: Nitrogen fertilizer is recognized as an important factor in crop’s yield level, however more application of N fertilizers in the soil have some adverse effects on environment and especially on groundwater contamination. Perception and recognition the factors influencing nitrate transport through soil profile is helpful for fertilizer management to minimize adverse impacts on environment and nitrate leaching below the root zone. Approach: In this study, 9 large cylindrical lysimeters with 1 m height and 0.5 m diameter were filled with clay loam soil and planted with maize to investigate nitrate leaching under different types of N-fertilizer, chemical fertilizer, activated sludge and organic manure. Nitrate concentration in the soil and drainage water samples were analyzed by spectrophotometer method and the mass of nitrate was calculated in soil and drainage water. Crop productions for different treatments were compared too. Results: Results showed that cumulative mass of nitrate leaching from organic fertilizer was greater than the other treatments (229 kg ha−1). Organic manure had the greatest nitrate accumulation in soil (15.17 mg kg−1), which was significantly greater than chemical fertilizer. Conclusions/Recommendations: Experimental results showed that manure application could result in NO3−-N accumulation increase in the deeper soil profiles compared with
activated sludge. Results showed that maize production was significantly higher under activated sludge fertilizer. Observations made in the current study suggest activated sludge fertilizer due to a higher crop production with same level of groundwater contamination, especially in clay loam soils.
Key words: Activated sludge, chemical fertilizer, ground water contamination, nitrate leaching, organic manure
INTRODUCTION
Statistical data showed that nitrogen fertilizer consumption is growing rapidly in the developing countries[3]. This has resulted in serious environmental consequences, such as nitrate (NO3−) accumulation in
ground water, leaching and eutrophication. In Europe, NO3− concentrations exceeding the international
recommendations for drinking water (50 mg L−1) have been found in groundwater under 22% of cultivated land[10,15]. The leaching of nitrates happens when excess nitrogen fertilizer is applied, resulting in increased (NO3−) accumulation in soils when high amount of
water is moved via soil pores and cracks and reach beyond the effective absorption by root zone[16]. Nitrogen is applied to agricultural systems in either inorganic or organic forms. Agricultural plants take it up mainly as inorganic N, which implies that mineralization of organic N precedes plant uptake[2,12].
Hence, organic N is generally more slowly available to plants than the inorganic N. The rate of mineralization of organic N is controlled by environmental conditions (e.g., temperature, moisture) and the chemical composition of the organic material itself[9]. The nitrogen not utilized within the cropping season, may be mineralized outside the plant growth season, thus becoming prone to leaching and groundwater pollution[4]. The potential for N leaching is thus generally considered to be greater when manure is applied, than inorganic fertilizer[6]. But on the other hand, to improve soil fertility, efforts need to be made to increase soil organic matter content. Conventional farming practice (using chemical fertilizers) generally leads to a reduction of soil organic matter[11].
In irrigated soils of arid and semi arid region, where water is applied in excess of evapotranspiration or to leach soluble salts, NO3− leaching may occur[8].
fertilizer-N consumption in the near East[13]. During the last three decades, NO3− concentration of the
groundwater has gradually increased and is reaching 50 mg L−1 NO3− in some parts of Iran. Recharge from
precipitation and irrigation may carry N compounds from the soil into the aquifer, often resulting in elevated NO3− concentrations in wells. Nitrogen leaching in
irrigated agriculture should receive considerable attention, because of possible pollution of groundwater in Iran. Large amounts of N-fertilizer and poorly managed irrigated systems may lead to NO3− leaching
and pollution of groundwater[7]. Nitrogen fertilizer consumption in Iran is mostly in the form of chemical fertilizers. According to accessibility of activated sludge and organic manures, the objective of this study is to compare the effects these fertilizers on the accumulation of nitrate (NO3−) in the soil profile and
nitrate concentration in drainage water. In this study, the results of a lysimeter study cropped with corn under different types of N-fertilizer (manure, chemical fertilizer and activated sludge) in a dry and cool climate of Karaj, Iran, are presented.
MATERIALS AND METHODS
This study was carried out from March to September 2007 at the water and soil research center of Tehran University located in Karaj, 30 km far from Tehran and with latitude of 35°56’ and longitude of 50°58’. The mean annual precipitation is only 250 mm, which is distributed mostly from January to May and from October to December. At the experimental site, total precipitation during the study period was 58 mm and the mean annual temperature is 15°C. The mean monthly temperature during the experiments was 7.5°C in March 2007 while it is 27.5°C in August 2007. The ground level is 1312 m above the sea level.
Nine cylindrical polyethylene lysimeters, 0.56 m in diameter and 1m height, were used in this study. The lysimeters were filled with clay loam soil containing 29.6% clay, 29.4 silt and 41% sand. A perforated PVC pipe was used for drainage in each lysimeter. Size of drainage pipe was 35 mm and it was installed at 8 cm above the bottom. End of the pipes were closed to avoid soil particles entrance. Geotextile was used to cover the perforated part so only water can pass the drainage pipe. Pipes were glued from both sides, inside and outside of the cylinder in order to prevent water leakage.
Three N fertilizers were imposed on clay loam soil, totally three treatments each with three replicates: • Chemical Fertilizer in clay loam soil (CFcl) • Activated Sludge in clay loam soil (AScl) • Cattle manure in clay loam soil (OFcl)
Table 1: Characteristics of clay loam soil
Physical properties Measurements
Sand 60-2000 m (%) 41.0
Silit 2-60 (%) 29.4
Clay <2 m (%) 29.60
Bulk density (g cm−3) 1.20
Porosity (%) 56.00
Chemical properties:
PH 7.66
EC 0.48
Ca2+ (meq L−1) 1.60
Mg2+ (meq L−1) 11.20
Na+ (meq L−1) 1.29
K+ (meq L−1) 0.26
CO32− (meq L−1) 0.00
HCO3− (meq L−1) 4.80
NO3−-N (mg L−1) 35.84
P (mg L−1) 2.40
Chemical fertilizer was a combination of three kinds of fertilizers: Potassium sulfate, ammonium phosphate and urea, which applied respectively, 200, 150 and 100 kg ha−1. Activated sludge was derived from Ekbatan refinery center in Tehran. Activated sludge was applied 20 ton ha−1. Cattle manure was collected from farm of Tehran University and applied 40 ton ha−1. All fertilizers were applied at the recommended rate. The recommended N application rates were based on their application in the farms of Karaj area, but fertilizer had been checked for total N by Kjeldahl method. Results were corresponding to recommended rates. The physical and chemical properties of the soils are shown in Table 1.
Nitrate analysis was conducted on drainage water collected from lysimeters once a week. The NO3−
N-nitrate concentrations were estimated by a similar method with spectrophotometer.
RESULTS
The total amount of water applied on each lysimeter is 2217 mm during the period of experiment (Table 2). This amount of water was estimated based on the corn water requirement and 40% irrigation efficiency, which is common in Karaj City, Iran (Table 2). The amount of the natural precipitation received during the late spring and summer months (May to September 2007) was 25.6 mm, so crop water requirement was supplied mostly by irrigation. The amount of the total drainage water was ranged between 61-94 mm for different treatments during the period between May to September, 2007. Evapotranspiration losses were 787 mm during these months, whereas, the mean temperature was 20.7°C in May while it was 27.6°C in August. The ratio of drainage to irrigation water for lysimeters was 2.7-4 %.
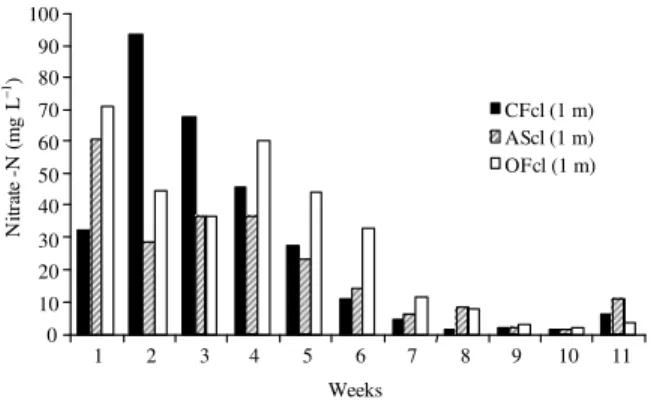
Figure 1 shows the nitrate-N concentrations for lysimeters containing clay loam soil. These concentrations were higher in the first week, but they declined from the fourth week until the end of the season. The NO3−-N concentration in CFcl lysimeters was the
greatest amount in the second week, that was 93 mg L−1, but after that it declined during the season. After the 6 week, the concentrations is less than 10 mg L−1. The maximum concentration of 60 mg L−1 was recorded in the AScl lysimeters in the first week and it then reduced in the later weeks. The maximum concentration of leachate for OFcl was measured in the first week and it is found to be 70 mg L−1 and then the concentration is reduced in the second and third weeks. But a slight increment in the concentration is observed in the fourth week and then declined until the end of the season. The average concentrations for these treatments are 26.62, 20.62 and 28.67 mg L−1 for CFcl, AScl and OFcl respectively. Results of treatments with clay loam soil show that the soil history of cultivation affected nitrate leaching in these treatments. The nitrate concentrations were higher than 10 mg L−1 during half of the season.
Table 2: Water balance data
Month May Jun. Jul. Aug. Sep. Total Total water inputs (mm) 130 457 730 650 250 2217 Drainage (mm):
CFcl (1 m) 10 7 26 18 0 61 AScl (1 m) 11 7 29 20 0 67 OFcl (1 m) 16 18 34 26 0 94 Evapotranspiration (mm) 55 167 254 225 86 787 Temperature (°C) 20.7 25.2 26.9 27.6 25.1 125.38 CFcl: Chemical fertilizer with clay loam soil, AScl: Activated sludge with clay loam soil, OFcl: organic fertilizer with clay loam soil
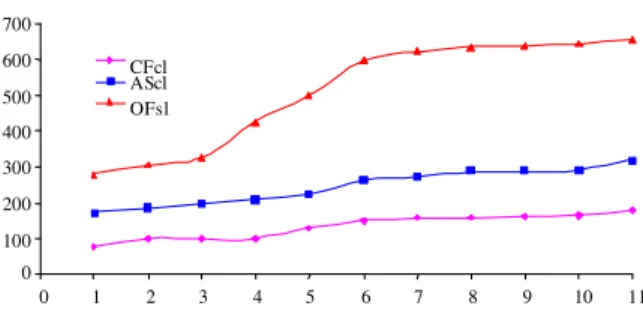
The cumulative mass amount of nitrate leaching in each treatment is shown in Fig. 2. It is found that OFcl lysimeters have the greatest NO3−-N leachate, CFcl had
the least leachate, while AScl lysimeters are between the two. The total nitrate leaching for the clay loam treatments varies from 179.9 mg for CFcl to 655.6 mg for OFcl. It shows that all curves have acute increasing slope from the third week up to the seventh week. This shows great N- NO3− leaching during these weeks. The
considerable point was the great discrepancy between the mass of nitrate-N in the organic fertilizer treatments and other treatments, especially OFcl, in which N-NO3−
mass was more than 2 times greater than the other treatments.
The mean nitrate-N mass was significantly different between the CFcl and the other two clay loam treatments (AScl and OFcl). The results gathered from the statistical analysis are shown in Table 3 at 0.05 level of probability.The results of nitrate concentration in the soil extracts are shown in Table 4.
The samples which are defined with the same letter are not significantly different (p<0.05). The values for each treatment are the means of 3 replications for the clay loam treatments from three depths. The AScl treatment was found to have the greatest nitrate concentration in the soil extracts at the depth of 15 cm, while OFcl had the greatest one at 0.45 and 0.75 m from the top. In general, the greatest N-NO3−
concentration in the soil extract was observed in the OFcl treatment, which was 3.03 mg L−1. Whereas, the minimum N-NO3− concentration was observed in the
CFsl treatment, which was 1.77 mg L−1 and the lowest concentration belonged to CFcl with 2.04 mg L−1.
0 10 20 30 40 50 60 70 80 90 100
1 2 3 4 5 6 7 8 9 10 11 Weeks
N
it
ra
te
-N
(
m
g
L
−
1)
CFcl (1 m) AScl (1 m) OFcl (1 m)
Fig. 1: Nitrate concentrations (mg L−1)
Table 3: Statistical analysis for nitrate-N mass in drainage water Treatments n Minimum Mean Maximum SD
CFcl 33 0.0 16.35b 77.9 22.9
0 100 200 300 400 500 600 700
0 1 2 3 4 5 6 7 8 9 10 11
CFcl AScl OFsl
Fig. 2: Mass amount of nitrate (mg) in drainage water
Table 4: Nitrate concentration in lysimeters containing clay loam soil (mg kg−1)
Soil depths (cm)
---
Treatments 15 45 75 Mean
Chemical fertilizer 10.44b 10.74a 9.43b 10.21bc Activated sludge 15.51a 10.44a 14.56ab 13.51ab Organic fertilizer 13.05ab 12.05a 20.37a 15.17a
Table 5: Maize production under different fertilizations
Mean Biomass biomass dried height of wieght of weight of Treatments corns (cm) maizes (kg) maizes (kg) Chemical Fertilizer 145 4.751b 1.003b Activated Sludge 155 5.584a 1.479a Organic Fertilizer 145 4.782b 1.164b Means with the same letter are not significantly different at the 0.05 level of probability
The Statistical analysis also showed that there was no significant difference between all the treatments at the depth of 0-0.3 m from the surface and only the AScl treatment was found to be significantly different with the CFsl, ASsl, OFsl and CFcl treatments. From 0.3-0.6 m depth, there was no significant difference between all the treatments at the 0.05 level of probability. From 0.6 m to 1 m depths, all these treatments were similar, but the OFcl treatment was found to be significantly different with all other treatments, except for the AScl treatment. The results of the mean nitrate-N mass in lysimeters soil showed that the nitrate-N mass in the AScl and OFcl treatments were significantly greater than the CFsl treatment and the nitrate-N mass was also significantly greater than the ASsl, OFsl and CFcl treatments. There were no significant differences (p<0.05) between the sandy loam treatments. Similarly, no significant difference was found between the AScl and OFcl treatments.
Maize products were harvested in September 2007. The mean height of corns and biomass weight of each treatment were measured. These maize products were then put in an oven for 24 h in 105°C to be dried completely. After that, these dried plants were weighed again. The best production result was found for the
lysimeters containing activated sludge fertilizer. These results suggest that higher crop production can be achieved using the AScl treatment, which is significantly greater than other treatments (Table 5).
DISCUSSION
There is concern about treatments containing cattle manure with concentrations greater than 10 mg L−1. Totally cattle manure showed the most effects of groundwater contamination and activated sludge was the second one. In this study, the results of the chemical fertilizers treatment are in agreement with the other findings[14]. The discrepancies between the results can be attributed to the difference in temperature, soil type and manure application rates.
Results illustrated that soil depth had the greatest effect on reducing nitrate leaching when cattle manure was applied. The discrepancies between treatments containing cattle manure are greater than other treatments using activated sludge and chemical fertilizer. Also, it is found that the results of the present study are in agreement with the other studies[9]. For example, the ratios between the inorganic and organic fertilizers are similar. At 0.75 m lysimeters depth, it is observed that the accumulation of nitrate-N is high when activated sludge is applied and it is low when organic fertilizers were applied although the total nitrogen applied as chemical fertilizer is low compared with other fertilizers but the concentration of nitrate-N in the leachate is great compared with organic fertilizer. This fact reveals that there is a great nitrate contamination in the case of shallow water table when chemical fertilizers are applied. Similarly, it is obvious that low concentration of nitrate in lysimeters using organic fertilizer is related to the fact that nitrogen has not been converted into the nitrate and it is still in its organic form. Therefore, it is prone to leaching in the next seasons. On the other hand, activated sludge had the least concentration in the surface, indicating that it had been leached by irrigation, but its concentration was the greatest in deeper soils. Thus, it can be easily transported through the soil and at the same time contaminate the groundwater. Although it should be considered that residual nitrate in the root zone is valuable to attend crops’ nitrate requirements in the future season too.
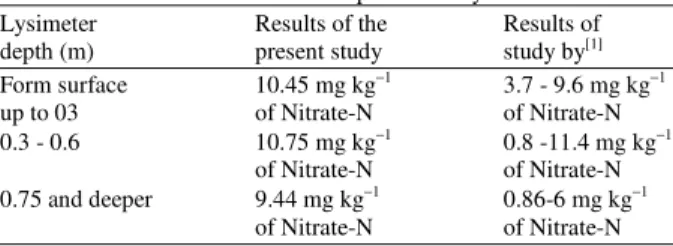
Table 6: Validation of results for the present study
Lysimeter Results of the Results of depth (m) present study study by[1]
Form surface 10.45 mg kg−1 3.7 - 9.6 mg kg−1
up to 03 of Nitrate-N of Nitrate-N 0.3 - 0.6 10.75 mg kg−1 0.8 -11.4 mg kg−1
of Nitrate-N of Nitrate-N 0.75 and deeper 9.44 mg kg−1 0.86-6 mg kg−1
of Nitrate-N of Nitrate-N
Obviously in the deeper parts of soil profile, nitrate-N accumulation is lower under orchard than the under corn cultivation. This is because the root zone is deeper. Moreover, the uptake of the trees is more than the corn in the 1m depth. The agreement in results can be attributed to the fact that similar fertilizer type and also same application rate are used in the experiments of both studies. However, the discrepancy in the results concerning organic fertilizer can be related to the differences in the application rates of nitrate input in poultry manure used in both studies.
In another study[17] conducted a long-term field experiment under wheat and maize rotation system. The mineral fertilizers were ammonium nitrate or urea, single super-phosphate or diammonium phosphate and potassium chloride commercial. The organic fertilizer used in that study was swine manure. Nitrogen fertilizer was applied at 120 and 150 kg N ha−1 to wheat and at 240, 300 and 450 kg N ha−1 to maize. N-NO3−recovered
in the soil from 0-1.8 m was 28 kg ha−1 for the manure fertilizer and 325 kg ha−1 for the NPK fertilizer. The results of the current study showed 88.6 kg ha−1 for the chemical fertilizer. The important reason for lesser N-NO3− accumulation in the soil added with chemical
fertilizers in this study is that soil nitrate is reported in the 1 m depth and the accumulation of nitrate was higher in the top soil, nevertheless that study was referring to 1.8 m of soil profile. The application rate was found to be lower in that particular study. The reason indicated is the higher nitrogen content in cattle manure applied in this study (2.5%) versus the nitrogen content of the swan manure (0.15%) in that study. The findings of another study showed that the loss of NO3--N under arable soil system ranged from 4 to 107 kg NO3--N ha−1 with an average value of 37.8 kg N ha−1 when N was applied no more than 200 kg N ha−1 year−1[5]. The results yielded in the current study support those findings and are also in the range of 4-107 kg ha−1.
The results for the concentration of nitrate-N from the sludge fertilization are in agreement with other studies such as the one in which three kinds of sewage sludge were studied and the effects of fertilization on the availability of nitrogen in the soil were investigated.
The mean concentration of NO3−-N in the soil amended
with three types of sludge which were between 1-20 mg kg−1 for composted sludge, 3-38 mg kg−1 for fresh sludge and from 3-20 mg kg−1 for the thermally dried sludge in that study[18]. In this study, it is found that results of the nitrate mass in soil for activated sludge treatments are within the above range. Nitrate-N mass was 13.5 mg kg−1 for AScl lysimeters.
CONCLUSION
Results of the present study show that application of organic fertilizer such as cattle manure further increased NO3− leaching than chemical fertilizers and
nitrate leaching from activated sludge was significantly greater than chemical fertilizers but less than organic manure. The nitrate-N concentrations were higher than 10 mg N L−1 (the maximum acceptable concentration) in 60% of the observations for OFcl. The Nitrate-N concentrations were higher than 10 mg N L−1 in 48 and 51% of the samplings for the CFcl and OFcl treatments, respectively. Although the mean nitrate-N concentrations were lower under the chemical fertilization, the maximum peak concentration in the clay loam treatments was found to occur under the chemical fertilization conducted in the second week. These results show a lower nitrate losses under the chemical fertilizer and this can be attributed to the low application rate of this type of fertilizer compared with the other types. The OFcl treatment produced the highest cumulative nitrate-N loss, that was 228.98 kg ha−1. Also, results show that nitrate loss is higher when organic manure is applied compared with other treatments, but it is found that the differences are not significant between organic fertilizers and activated sludge. It is found that there are no significant differences in Nitrate-N mass in the soil extracts resulted form CFcl and AScl treatments although OFcl treatment had higher nitrate-N mass compared with CFcl treatment. The highest mean biomass weight of maize was under the activated sludge fertilizer which was significantly higher the other treatments. The results illustrate that although organic fertilizer had higher nitrate concentrations, higher nitrate mass leaching and more accumulation in soil profile, fertilization with the activated sludge had resulted in a higher crop production in this study.
ACKNOWLEDGMENT
and the academic and financial support from University Putra Malaysia is highly appreciated.
REFERENCES
1. Allen, S.C., V.D. Nair, D.A. Graetz, S. Jose and P.K.R. Nair, 2006. Phosphorus loss from organic versus inorganic fertilizers used inalley cropping on a Florida Ultisol. Agric. Ecosyst. Environ., 117: 290-298. DOI: 10.1016/j.agee.2006.04.010 2. Chadwick, D.R., F. John, B.F. Pain, B.J. Chambers
and J. Williams, 2000. Plant uptake of nitrogen from the organic nitrogen agriculturfraction of animal manures: A laboratory experiment. J. Agric.
Sci., 134: 159-168. DOI:
10.1017/S0021859699007510
3. Chalk,P.M., L.K. Heng and P. Moutonnet, 2001. Nitrogen fertilization and its environmental impact. Proceeding of 12th International World Fertilizer Congress, Aug. 3-9, Beijing, China, pp: 1-15. 4. Di, H.J. and K.C. Cameron, 2002. Nitrate leaching
in temperate agroecosystems: Sources, factors and mitigating strategies. Nutr. Cycl. Agroeco., 46: 237-256. DOI: 10.1023/A:1021471531188 5. Di, H.J. and K.C. Cameron, 2002. Nitrate leaching
and pasture production from different nitrogen sources on a shallow stoney soil under flood-irrigated dairy pasture. Aust. J. Soil Res., 40: 317-334. http://cat.inist.fr/?aModele=afficheN&cpsidt=1354 9904
6. Eriksen, J., M. Askegaard and K. Kristensen, 1999. Nitrate leaching in organic dairy/crop rotation as affected by organic manure type, livestock density and crop. Soil Use Manage. J., 15: 176-182. http://direct.bl.uk/bld/PlaceOrder.do?UIN=066554 430&ETOC=RN&from=searchengine
7. Jalali, M., 2005. Nitrates leaching from agricultural land in Hamadan, western Iran. Agric. Ecosyst.
Environ., 110: 210-218. DOI:
10.1016/j.agee.2005.04.011
8. Jalali, M. and D.L. Rowell, 2003. The role of calcite and gypsum in the leaching of potassium in a sandy soil. Agriculture, 39: 379-394. DOI: 10.1017/S001447970300139X
9. Korsaeth, A., L.R. Bakken and H. Riley, 2003. Nitrogen dynamics of grass as affected by N input regimes, soil texture and climate Nutr. Cycl. Agroecosyst., 66: 181-199. DOI: 10.1023/A:1023928717599
10. Laegreid, M. O., C. Bockman and O. Kaarstad, 1999. Agriculture, Fertilizers and Environment. CABI Publishing Associate, Wallingford, UK., ISBN: 0-85199-385-3
11. Melero, S., J.C.R. Porras, J.F. Herencia and E. Madejon, 2006. Chemical and biochemical properties in a silty loam soil under conventional and organic management. Soil Till. Res., 90: 162-170. DOI: 10.1016/j.still.2005.08.016
12. Murphy, D.V., A.J. Macdonald, E.A. Stockdale and K.W.T. Goulding et al., 2000. Soluble organic nitrogen in agricultural soils. Biol. Fertil. Soils, 30: 374-387. DOI: 10.1007/s003740050018 13. Singh, B., Y. Singh and G.S. Sekhon, 1995.
Fertilizer-N use efficiency and nitrate pollution of groundwater in developing countries. J. Contamin. Hydrol., 20: 167-184. DOI: 10.1016/0169-7722(95)00067-4
14. Tarkalson, D.D., J.O. Payero, S.M. Ensley and C.A. Shapiro, 2006. Nitrate accumulation and movement under deficit irrigation in soil receiving cattle manure and commercial fertilizer. Agric. Water Manage., 85: 201-210. DOI: 10.1016/j.agwat.2006.04.005
15. WHO, 1993. Guidelines for Drinking Water Quality Recommendations. 2nd Edn., World Health Organization, Geneva, ISBN: 9241544600. 16. Yuan, X.M. Y.A. Tong, X.Y. Yang, X.L. Li and
F.S. Zhang, 2000. Effect of organic manure on soil nitrate nitrogen accumulation. Soil Environ. Sci., 9: 197-200. DOI: 10.1155/AESS
17. Sheng-Mao, Y., L. Feng-Min, S. Dong-Rang and G. Tian-Wen et al., 2006. Effect of long-term fertilization on soil productivity and Nitrate accumulation in Gansu Oasis. J. Agric. Sci. China, 5: 57-67.DOI: 10.1016/S1671-2927(06)60020-5 18. Ojeda, G., E. Perfect, J.M. Alcaniz and O. Ortiz,
2006. Fractal analysis of soil water hysteresis as influenced by sewage sludge application,
Geoderma, 134: 386-401.